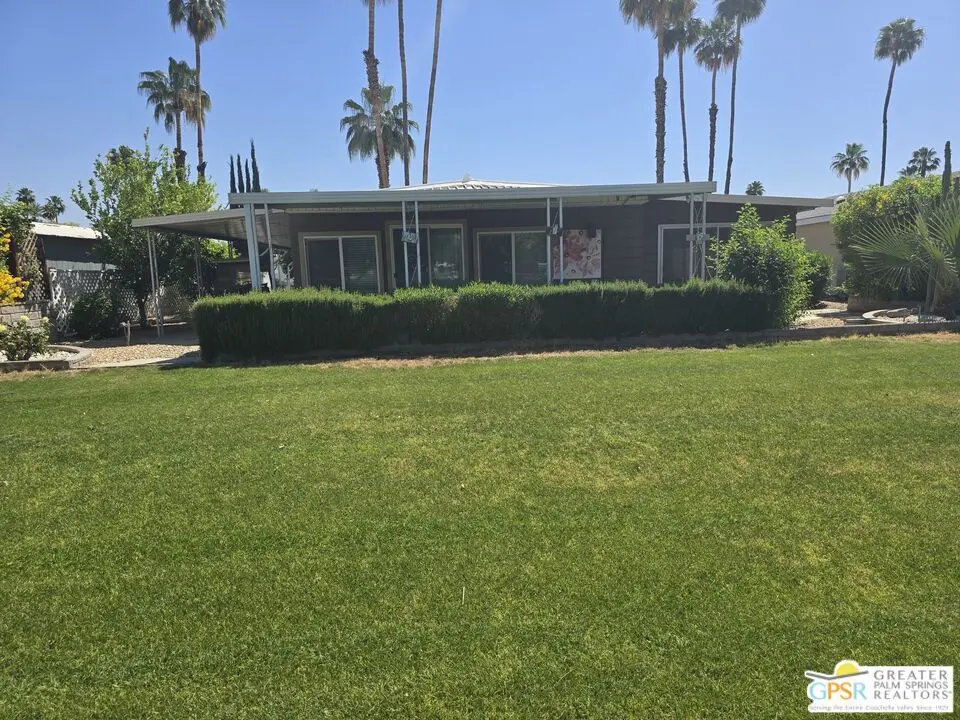
102 N Paseo Laredo · Cathedral City, CA
Flood risk 1/10 · Minimal
- FEMA flood zone
- X
- Chance of flooding over 30 yrs
- 0.0%
- Est. flood insurance / yr
- $507 – $1,088
Fire risk 4/10 · Minor
- Est. fire insurance / yr
- $659 – $1,223
Heat risk 9/10 · Severe
- Hot days now (above 113°F)
- 7 days/yr
- Hot days in 30 yrs
- 20 days/yr
Wind risk 1/10 · Minimal
- Chance of severe wind over 30 yrs
- —
Air-quality risk 5/10 · Moderate
- Unhealthy air days now
- 6 days/yr
- Unhealthy air days in 30 yrs
- 8 days/yr
Risk factors via First Street. Map © Google.
Why this score? — see what drove the C+ grade
The composite is a weighted blend of 9 inputs, each scored 0–100. Each bar is that input's sub-score; the figure is the points it added to the 100-point composite (weight × sub-score).
- Cash flow +30.0/30.0
- 1% rule +10.0/10.0
- DSCR +10.0/10.0
- Rent growth +3.3/5.0
- Livability +3.3/5.0
- Schools +2.7/10.0
- Condition / age +2.5/5.0
- ARV discount +0.0/15.0
- Appreciation +0.0/10.0
$105,000
🖨 Deal sheet 📄 Offer letter ✓ Due diligence
Listing remarks
One of the LOWEST-PRICED homes in Date Palm Country Club! Attention investors, flippers, and buyers looking to customize this 2 bed, 2 bath double-wide (1,440 sq ft). Offers incredible potential in a premier 55+ golf course community (space rent). Step inside to a spacious living and dining area, plus a kitchen that flows into the family room with a built-in wet bar, perfect for entertaining. Both bedrooms are sized generously and both bathrooms include a walk-in shower. Additional highlights include a bonus room off the family room plus an indoor laundry area with washer and dryer. This home has a nice functional layout ready for your updates. Outside, you'll find a two-car tandem carport
Key facts
- Indoor laundry area
- Bonus room
- Private patio
Tags
Property features AI
Finance
- Other: Senior community; Complex of 535 units; Directions: from main gate on Date Palm Dr, after entry take first left (Via Valverde) and follow until it becomes N Paseo Laredo; house will be on the right
- Financial info: Yearly land lease
- HOA & community: Community clubhouse; Common RV parking; Pickleball courts; Tennis courts; Onsite property management; Exercise room; Golf access; Pool and spa; Multipurpose/recreation room; Meeting room; Steam room; Association fees include utilities; Pet-friendly (per association rules)
Exterior
- Parking: Attached carport; 2 covered parking spaces
- Security: Gated community with guard
- Home design: Single-story residential mobile home; Property on leased land
- Construction: Date Palm Country Cl builder tract
- Exterior features: Community pool; Has view of golf course and mountains
Interior
- Kitchen: Dishwasher; Microwave; Range/Oven; Garbage disposal; Refrigerator
- Flooring: Laminate floors
- Bathrooms: 2 full bathrooms
- Heating & cooling: Central heating; Central cooling; Ceiling fan
- Interior features: Family room; Dining area; Living room; Built-ins
- Laundry & utility: Indoor laundry area with washer and dryer
Neighborhood map
What this means for you Summary
Snapshot
- This is a 2-bed/2.0-bath manufactured listed at $105k.
Deal economics
- At list price, monthly cash flow is $2k ($18k/yr) — positive.
- The deal already cash-flows at list — no discount required.
- Meets the 1% rule at list price ($3k rent vs $105k).
- Recommended offer: $102k (3.0% below list) — sets the bar for market timing.
- Cap rate 23.8% vs local median 5.1% in Cathedral City — top-decile yield for the area; either an underpriced asset or a hidden risk that comps aren't pricing in. Stress-test before assuming the spread holds.
Location & tenants
- Location reads 66/100 on livability (#344 in CA) — a middle-class / working-renter tenant base. Strengths: commute A+, housing B+; Watch: employment D+, schools F, amenities D-.
- Palm Springs Unified (suburban): math 21% / reading 42% proficiency, ranked #328 of 517 in CA (top 63%) — families likely to look elsewhere, expect single-tenant / working-renter base with shorter leases; 73% free/reduced lunch — lower-income household profile, screen leases tightly.
- Market conditions: Rents rising (+3.2%/yr); 525 active listings in the ZIP; 40 comparable units currently listed for rent nearby; rentals at typical pace (median 24d on market — plan ~3-4 weeks tenant-placement turnaround); 45% of comp listings sitting > 30 days — soft ceiling on asking rent; 9,195 units permitted in Riverside County in 2024 (1,512 in 5+ unit buildings).
- This rent runs 44% of the median local income ($74k/yr) — at the standard rent-burdened threshold; future hikes will face affordability resistance.
Forward outlook
- Local home prices are declining (-3.0%/yr); year-one equity from $726 of loan paydown is wiped out by about $3k of value loss. Plan a longer hold.
- Riverside County population projected at +22% by 2050 — long-run rental-demand tailwind backs the buy-and-hold thesis.
- At projected returns (-3.0% appreciation + 3.2% rent growth), your $29k cash investment doubles in ~2 years — after that, you're playing with house money.
Negotiation context
- It's been on market 51 days — a 3% lower offer ($102k) is reasonable based on typical stale-listing flexibility.
Risks & watch-outs
- Climate carrying-cost: extreme-heat days projected 7→20/yr by 2055 (HVAC capex compounding) — expect insurance premiums to compound above CPI over the hold.
Questions for the listing agent
- It's been on market 51 days. Have you received any prior offers? Is the seller open to a 3% concession, seller financing, or rate buy-down credit?
- Built in 1972 — when were the roof, HVAC, electrical panel, plumbing, and water heater last replaced?
- Is there a deadline driving the sale (1031 exchange, divorce, estate, relocation)? That informs how much negotiation room exists.
- Schools are F-rated, which usually means shorter tenancies and higher turnover. Who's the typical renter profile here, and what's been the actual vacancy rate?
- What's the average days-on-market for RENTAL listings here right now (not sales)? A rising rental-DOM trend means longer vacancies and softer asking-rent achievability than the comps imply.
- What's the recent tenant-quality profile in this submarket — average credit score on applications, eviction rate, late-payment / NSF rate, and stable-employment percentage? A property-management company in the area should have these aggregated.
- How much new for-sale + rental construction is in the pipeline within 1–3 miles? Heavy new supply typically softens prices + rents 12–24 months out; constrained supply supports both.
Investment metrics
- 1% rule
- 2.59% ✓
- Cap rate
- 23.82%
- Cash-on-cash
- 62.61%
- DSCR
- 3.79
- GRM
- 3.2
CMA / ARV
- ARV (median comp)
- $87,000
- List price
- $105,000
- Delta
- 20.69%
- Verdict
- OVERPRICED
- Comps
- 20 within 1.0 mi
Show comp detail 12 sales within ~0.75 mi
| Address | Dist | Beds/Ba | Sqft | Sold | Price | $/sf | Match |
|---|---|---|---|---|---|---|---|
| 67 Paseo Laredo North | 0.07mi | 2/2.0 | 1,440 (0%) | 1mo | $55,000 | $38 | 96 |
| 229 Calle Leandro | 0.13mi | 2/2.0 | 1,440 (0%) | 3mo | $90,000 | $63 | 92 |
| 35 N Paseo Laredo | 0.13mi | 2/2.0 | 1,440 (0%) | 4mo | $157,000 | $109 | 90 |
| 153 Estrada Way | 0.32mi | 2/2.0 | 1,440 (0%) | 1mo | $46,500 | $32 | 85 |
| 126 Via Valverde | 0.29mi | 2/2.0 | 1,440 (0%) | 2mo | $179,500 | $125 | 84 |
| 409 S Paseo Laredo | 0.52mi | 2/2.0 | 1,440 (0%) | 1mo | $58,000 | $40 | 75 |
| 443 Paseo Perdido | 0.56mi | 2/2.0 | 1,440 (0%) | 0mo | $65,000 | $45 | 74 |
| 464 Cerritos Way | 0.54mi | 2/2.0 | 1,440 (0%) | 2mo | $95,000 | $66 | 73 |
| 24 Mesa View Dr | 0.72mi | 2/2.0 | 1,440 (0%) | 2mo | $68,000 | $47 | 65 |
| 447 Paseo Perdido | 0.57mi | 2/2.0 | 1,590 (+10%) | 1mo | $55,000 | $35 | 55 |
| 318 Via Don Benito | 0.75mi | 2/2.0 | 1,536 (+7%) | 2mo | $85,000 | $55 | 52 |
| 337 Via Don Benito | 0.65mi | 2/2.0 | 1,608 (+12%) | 0mo | $77,000 | $48 | 50 |
Match score weights: distance 35% · size 25% · config 20% · recency 20%. Top-matched comps best support the ARV.
Projected returns pro-forma
-3.0% appreciation · 3.22% rent growth · sell at horizon
- IRR
- 61.8%
- Equity multiple
- 3.76×
- Total profit
- $81,268
- Equity at exit
- $15,656
- IRR
- 66.4%
- Equity multiple
- 7.77×
- Total profit
- $198,965
- Equity at exit
- $9,078
Cash invested: $29,400 (down + closing). Projections, not guarantees.
Landlord ↔ Tenant lean methodology
- Overall (STATE)
- 18 Strongly Tenant-Friendly
- State California
- 18 Strongly Tenant-Friendly · D+13
- County
- — inherits STATE
- City
- — inherits STATE
ZIP-level market 92234
- Home prices YoY
- -27.7%
- Rents YoY
- 3.2%
- Active inventory
- 525
- Price-to-rent
- 3.2×
Monthly cashflow live
- Estimated rent
- $2,724 high interval (Pro) →
- Mortgage (P&I)
- −$551
- Tax from tax record
- −$24 /mo · $284/yr
- Insurance
- −$44
- HOA
- −$0
- Vacancy / Maint / Mgmt
- −$572
- Net cashflow
- $1,534
Break-even live
UW: 25.0% down · 7.5% · 30yr · 1.5% tax · 5.0% vac · 8.0% maint · 8.0% mgmt
Financing live
Cash to close
- Down payment
- $26,250
- Closing costs
- $3,150
- Reserves months
- —
- Total cash needed
- —
Loan-product check · same deal, 3 products live
Conventional
25% down · 7.5% · 30yr
- Down + closing
- —
- Monthly P&I
- —
- Monthly cashflow
- —
- DSCR
- —
- Eligible?
- —
Personal DTI + credit; lowest rate.
DSCR
20% down · 8.5% · 30yr
- Down + closing
- —
- Monthly P&I
- —
- Monthly cashflow
- —
- DSCR
- —
- Eligible?
- —
No personal income docs; deal must DSCR.
Hard money
10% down · 12.0% · 12mo
- Down + closing
- —
- Monthly P&I
- —
- Monthly cashflow
- —
- DSCR
- —
- Eligible?
- —
Short-term bridge; refi at stabilization.
Rent comps 40 comps
| Address | Beds | Baths | Sqft | Rent | $/sqft | DOM | Units | Dist |
|---|---|---|---|---|---|---|---|---|
| 36040 Avenida de las Montanas Unit E Cathedral City, CA | 2.0 | 2.0 | 1220 | $3,200 | $2.62 | 43d | 1 | 0.22mi |
| 159 Estrada Way Cathedral City, CA | 3.0 | 2.0 | 1800 | $2,850 | $1.58 | 43d | 1 | 0.30mi |
| 152 Estrada Way #152 Cathedral City, CA | 2.0 | 2.0 | 1500 | $2,200 | $1.47 | 43d | 1 | 0.31mi |
| 250 S Paseo Laredo Cathedral City, CA | 2.0 | 2.0 | 1600 | $1,800 | $1.12 | 12d | 1 | 0.36mi |
| 251 S Paseo Laredo Unit 251 Cathedral City, CA | 1.0 | 2.0 | 1440 | $2,550 | $1.77 | 24d | 1 | 0.38mi |
| 251 S Paseo Laredo Cathedral City, CA | 2.0 | 2.0 | 1440 | $2,400 | $1.67 | 43d | 1 | 0.38mi |
| 35615 Paseo Circulo E Cathedral City, CA | 1.0 | 2.0 | 1029 | $2,250 | $2.19 | 43d | 1 | 0.53mi |
| 68882 Calle Mula Cathedral City, CA | 2.0 | 2.0 | 1714 | $2,500 | $1.46 | 20d | 1 | 0.58mi |
| 69200 Nilda Dr Cathedral City, CA | 3.0 | 2.0 | 1330 | $2,495 | $1.88 | 21d | 1 | 0.63mi |
| 68859 Paseo Real Cathedral City, CA | 2.0 | 2.0 | 1406 | $3,960 | $2.82 | 14d | 1 | 0.71mi |
| 68859 Paseo Real Cathedral City, CA | 2.0 | 2.0 | 1406 | $3,960 | $2.82 | 43d | 1 | 0.71mi |
| 34750 Marcia Rd Unit 02 Cathedral City, CA | 3.0 | 2.0 | 1325 | $2,000 | $1.51 | 17d | 1 | 0.82mi |
| 68695 F St Cathedral City, CA | 3.0 | 2.5 | 896 | $2,500 | $2.79 | 43d | 1 | 0.88mi |
| 35200 Cathedral Canyon Dr Unit H64 Cathedral City, CA | 2.0 | 2.0 | 1375 | $2,500 | $1.82 | 43d | 1 | 0.90mi |
| 70170 Sun Valley Dr Rancho Mirage, CA | 2.0 | 2.0 | 1368 | $3,800 | $2.78 | 4d | 1 | 0.95mi |
| 35200 Cathedral Canyon Dr Unit B10 Cathedral City, CA | 2.0 | 2.0 | 1384 | $2,600 | $1.88 | 43d | 1 | 0.98mi |
| 8 Mission Ct Rancho Mirage, CA | 2.0 | 2.0 | 1540 | $2,500 | $1.62 | 18d | 1 | 0.99mi |
| 37800 Da Vall Dr #12 Rancho Mirage, CA | 2.0 | 2.0 | 1387 | $2,400 | $1.73 | 43d | 1 | 0.99mi |
| 69180 Victoria Dr #8 Cathedral City, CA | 3.0 | 2.0 | 1230 | $1,995 | $1.62 | 2d | 1 | 1.01mi |
| 35090 Mission Hills Dr Rancho Mirage, CA | 2.0 | 2.0 | 1596 | $3,950 | $2.47 | 24d | 1 | 1.01mi |
| 35082 Mission Hills Dr Rancho Mirage, CA | 2.0 | 2.5 | 1624 | $3,250 | $2.00 | 12d | 1 | 1.02mi |
| 38 Mission Ct Rancho Mirage, CA | 3.0 | 3.0 | 1382 | $3,500 | $2.53 | 43d | 1 | 1.02mi |
| 69646 Antonia Way Rancho Mirage, CA | 2.0 | 2.0 | 966 | $2,450 | $2.54 | 18d | 1 | 1.03mi |
| 35 Mission Ct Rancho Mirage, CA | 3.0 | 2.0 | 1382 | $4,125 | $2.98 | 43d | 1 | 1.04mi |
| 69603 Heather Way Rancho Mirage, CA | 3.0 | 2.0 | 1218 | $2,300 | $1.89 | 43d | 1 | 1.06mi |
| 34361 Denise Way Rancho Mirage, CA | 3.0 | 2.0 | 1400 | $2,800 | $2.00 | 43d | 1 | 1.08mi |
| 35054 Mission Hills Dr Rancho Mirage, CA | 2.0 | 2.0 | 1396 | $2,549 | $1.83 | 4d | 1 | 1.10mi |
| 69155 Dinah Shore Dr Cathedral City, CA | 2.0 | 2.0 | 1100 | $1,795 | $1.63 | 43d | 1 | 1.14mi |
| 69155 Dinah Shore Dr Apt 20 Cathedral City, CA | 2.0 | 2.0 | 1200 | $2,050 | $1.71 | 43d | 1 | 1.16mi |
| 68615 Paseo Soria Cathedral City, CA | 2.0 | 2.0 | 1462 | $3,500 | $2.39 | 7d | 1 | 1.18mi |
| 34073 Emily Way Rancho Mirage, CA | 2.0 | 2.0 | 966 | $2,100 | $2.17 | 17d | 1 | 1.19mi |
| 34073 Emily Way Rancho Mirage, CA | 2.0 | 2.0 | 966 | $2,100 | $2.17 | 21d | 1 | 1.19mi |
| 34071 Denise Way Rancho Mirage, CA | 3.0 | 2.0 | 1218 | $2,599 | $2.13 | 24d | 1 | 1.20mi |
| 34197 Calle Mora Cathedral City, CA | 2.0 | 2.0 | 1171 | $2,300 | $1.96 | 13d | 1 | 1.34mi |
| 34197 Calle Mora Cathedral City, CA | 2.0 | 2.0 | 1171 | $2,300 | $1.96 | 21d | 1 | 1.34mi |
| 34197 Calle Mora Cathedral City, CA | 2.0 | 2.0 | 1171 | $2,300 | $1.96 | 10d | 1 | 1.34mi |
| 70100 Mirage Cove Dr #10 Rancho Mirage, CA | 3.0 | 2.0 | 1570 | $3,000 | $1.91 | 43d | 1 | 1.35mi |
| 68368 Calle Leon Cathedral City, CA | 2.0 | 2.0 | 1406 | $3,790 | $2.70 | 14d | 1 | 1.43mi |
| 68368 Calle Leon Cathedral City, CA | 2.0 | 2.0 | 1406 | $3,790 | $2.70 | 43d | 1 | 1.43mi |
| 68153 Lakeland Dr Cathedral City, CA | 2.0 | 2.0 | 1255 | $2,500 | $1.99 | 24d | 1 | 1.47mi |
Listing history 15 events
-
2026-06-18days on market $105,000 Active 51 DOM
-
2026-06-17days on market $105,000 Active 50 DOM
-
2026-06-16days on market $105,000 Active 49 DOM
-
2026-06-15days on market $105,000 Active 48 DOM
-
2026-06-13days on market $105,000 Active 46 DOM
-
2026-06-13days on market $105,000 Active 45 DOM
-
2026-06-09days on market $105,000 Active 42 DOM
-
2026-06-08days on market $105,000 Active 41 DOM
-
2026-06-07days on market $105,000 Active 40 DOM
-
2026-06-04days on market $105,000 Active 37 DOM
-
2026-06-03days on market $105,000 Active 36 DOM
-
2026-06-02days on market $105,000 Active 35 DOM
-
2026-06-01days on market $105,000 Active 34 DOM
-
2026-05-31days on market $105,000 Active 33 DOM
-
2026-04-28$105,000 Active 1133-char remark
ⓘ Source: listings_history table (triggers on properties + properties_extension) + one-shot
backfill from property_details.listing_events for pre-trigger history.
Tax reassessment forecast CA · Resets to sale price
- Current annual tax
- $284 · $24/mo
- Projected year-2 tax
- $798 · $66/mo
- Expected delta
- +$514/yr (+$43/mo · 181.2%)
ⓘ Screening estimate from a state-policy table — verify with the county assessor before closing.
Climate risk First Street
- Flood 1/10 Low FEMA zone X · 0% chance over 30 yrs
- Wildfire 4/10 Moderate
- Heat 9/10 Extreme 7 d/yr ≥113°F today · 20 d/yr by 30 yrs out
- Wind 1/10 Low
- Air quality 5/10 Major 6 unhealthy d/yr today · 8 by 30 yrs out
Nearby sold comps map
Loading sold comps map…
Walkable amenities ~0.75 mi
Loading nearby amenities…
Taxation est. · year 1
- Rental income
- $32,690
- − Mortgage interest
- −$5,882
- − Property taxes
- −$284
- − Insurance
- −$525
- − Repairs & maintenance
- −$2,615
- − Management
- −$2,615
- − Depreciation
- −$3,055
- Taxable income
- $17,714
- Est. tax owed @ 24.0%
- −$4,251
- After-tax cash flow
- $14,157/yr
For passive investors: Depreciation is non-cash, so a rental often shows a tax loss while cash-flowing — sheltering income. Rental losses are passive: they offset passive income freely, and up to $25,000/yr can offset ordinary (W-2) income if you actively participate and your MAGI is under $100k (phasing out to $0 by $150k); unused losses carry forward. On sale, claimed depreciation is recaptured at up to 25%, and gains may owe capital-gains tax (a 1031 exchange can defer both). Figures are a year-1 estimate at your 24.0% rate — not tax advice; consult a CPA.
Schools (NCES district)
- District
- Palm Springs Unified
- NCES district ID
- 0629550
- Math proficiency
- 21% ▼ -7.00%
- Reading proficiency
- 42% ▬ 0.00%
- Median HH income
- $43,638
- Composite
- 26.76/100
- National rank
- #7131
- State rank
- #328 of 517 in CA
Livability — Cathedral City
- Score
- 66/100
- State rank
- #344
- US rank
- #11749
Category grades
Schools grade is shown separately in the Schools card above.
Census & demographics
- Census place
- Cathedral City, CA
- County
- Riverside County · 2,287,001 people
- City population
- 52,267
- Metro
- Riverside-San Bernardino-Ontario, CA
- Population (ZIP)
- 52,267
- Household income
- $73,572
- Rent vs Own
- Severe rent burden
- 1682.0
Population outlook (Riverside County) Hauer SSP2
- Today (2025)
- 2,664,475 people
- By 2030
- 2,802,692 · +5.2%
- By 2040
- 3,050,904 · +14.5%
- By 2050
- 3,256,783 · +22.2%
- By 2075
- 3,655,058 · +37.2%
- By 2100
- 3,766,594 · +41.4%
Race, ethnicity, and origin ACS 2023
- Neighborhood character
- Diverse neighborhood (Simpson 0.56)
- Race & ethnicity
- Hispanic / Latino 59% White 30% Two or more races 27% Asian 6% Native American 2% Black 2%
- Hispanic origin (detail)
- Mexican 51%
- Common ancestry
- Lithuanian 2% Romanian 1% Italian 1%
- Foreign-born
- 28% · Canada, Vietnam
- Languages at home
- 48% English-only · Spanish 46% Tagalog/Filipino 3% Other Asian/Pacific 1%
Political lean MEDSL · Riverside
- 2024 margin
- Toss-up / Even · D 48.0% · R 49.3% · Other 2.6%
- 2008→2024 swing
- -3.6pp toward R · 2008: 2.3pp · 2024: -1.3pp
- All cycles
- 2024: R+1.3 2020: D+8.0 2016: D+4.3 2012: R+0.4 2008: D+2.3
Not yet ingested
- Civics
- —
Market trends
- HPI YoY
- ▼ -136.57%
- Current HPI
- 356.9845
- Rent YoY
- ▲ 3.22%
- Metro
- Riverside-San Bernardino-Ontario, CA
- State GDP YoY
- ▲ 3.21%
- F500 in state
- 116
Industry mix (Fortune 500 HQ in CA)
| Industry | F500 HQs | Revenue |
|---|---|---|
| Technology | 27 | $1,492B |
|
||
| Financial Services | 3 | $174B |
|
||
| Retail | 3 | $44B |
|
||
| Insurance | 3 | $26B |
|
||
| Media / Entertainment | 2 | $115B |
|
||
| Pharmaceuticals / Biotech | 2 | $62B |
|
||
Price history
1 event — show timeline
- 2026-04-28 Listed $105,000 TheMLS
Property tax history
+1.8%/yrLatest (2025): $284 · -2.1% YoY. Source: county tax records.
Cash-flow waterfall
monthlySold comps — $/sqft
last 12 mo · ≤1 miLoading sold comps…