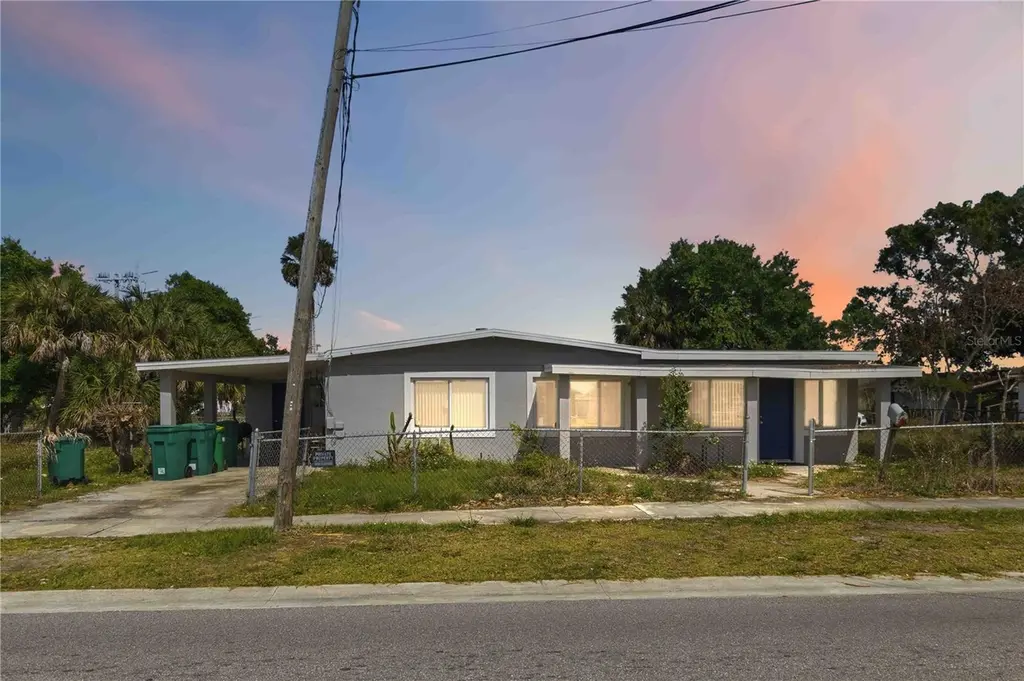
214 Blake Ave · Cocoa, FL
Flood risk 1/10 · Minimal
- FEMA flood zone
- X (unshaded)
- Chance of flooding over 30 yrs
- 0.0%
- Est. flood insurance / yr
- $507 – $1,088
Fire risk 3/10 · Minor
- Est. fire insurance / yr
- $947 – $1,759
Heat risk 10/10 · Severe
- Hot days now (above 106°F)
- 7 days/yr
- Hot days in 30 yrs
- 23 days/yr
Wind risk 10/10 · Severe
- Chance of severe wind over 30 yrs
- 99.0%
Air-quality risk 1/10 · Minimal
- Unhealthy air days now
- 0 days/yr
- Unhealthy air days in 30 yrs
- 0 days/yr
Risk factors via First Street. Map © Google.
Why this score? — see what drove the D+ grade
The composite is a weighted blend of 9 inputs, each scored 0–100. Each bar is that input's sub-score; the figure is the points it added to the 100-point composite (weight × sub-score).
- Cash flow +17.9/30.0
- ARV discount +7.5/15.0
- DSCR +5.6/10.0
- Schools +4.7/10.0
- 1% rule +4.6/10.0
- Livability +3.6/5.0
- Rent growth +3.5/5.0
- Condition / age +2.5/5.0
- Appreciation +0.0/10.0
$189,000
🖨 Deal sheet (PDF) 📄 Offer letter ✓ Due diligence
Listing remarks
Single-family home offering 4 bedrooms, 2 bathrooms, and 1,536 square feet, situated on an oversized corner lot of just over a quarter of an acre with no HOA restrictions. This property provides a strong foundation with key improvements already completed, including a new roof, impact-rated windows, and impact-rated metal exterior doors. The stucco exterior has been recently updated with fresh paint, giving the home a clean and solid exterior presence. The interior layout offers a functional footprint with great bones and plenty of flexibility to update, redesign, or enhance over time. The generous lot size adds even more potential, with space for outdoor living or expansion. Located just mi
Key facts
- Oversized corner lot
- New roof
- Impact rated windows
Tags
Property features AI
Finance
- Other: Lot approximately 0.28 acres (1/4 to less than 1/2 acre); Asphalt/paved road access
- HOA & community: No HOA association listed; Pets allowed
Exterior
- Parking: Carport (1 space)
- Utilities: Public water; Public sewer; Cable available; Electricity connected; Water connected; Sewer connected
- Home design: Single family residence; Residential property; One story; Faces west
- Construction: Block, concrete, and stucco construction; Shingle roof; Slab foundation; Built as a residential single family home
- Exterior features: Private mailbox; Sidewalk
Interior
- Kitchen: Range; Refrigerator; Other appliances
- Bedrooms: 4 bedrooms
- Flooring: Carpet; Tile
- Bathrooms: 2 full bathrooms
- Heating & cooling: Central heating (electric); Central air conditioning
- Interior features: Ceiling fans; Other interior features
- Laundry & utility: Laundry room (other features)
Neighborhood map
What this means for you Summary
Snapshot
- This is a 3-bed/2.0-bath single-family listed at $189k.
Deal economics
- At list price, monthly cash flow is $159 ($2k/yr) — positive.
- The deal already cash-flows at list — no discount required.
- To meet the 1% rule (rent ≥ 1% of price), the offer needs to be $181k (4.3% below list).
- Recommended offer: $181k (4.3% below list) — sets the bar for 1% rule.
Location & tenants
- Location reads 72/100 on livability (#344 in FL) — a middle-class / working-renter tenant base. Strengths: commute A+, cost of living A+, housing A+; Watch: crime F, amenities F, employment D-.
- Brevard (suburban): math 53% / reading 57% proficiency, ranked #19 of 73 in FL (top 26%) — acceptable for families but not a draw, mixed tenant base, ~2y average lease.
- Zoned schools: Endeavour Elementary School (math 15% / reading 20%, grade F, #2,117 of 2,144 statewide, top 99%, 717 students, 72% FRL); Ronald Mcnair Magnet Middle School (math 58% / reading 50%, grade B-, #196 of 571 statewide, top 36%, 364 students, 58% FRL); Rockledge Senior High School (math 27% / reading 49%, grade F, #328 of 667 statewide, top 50%, 1,558 students, 50% FRL) — zoned schools average 60% FRL vs 43% district-wide (17 pts higher); higher-poverty schools than district average — tighter screening recommended.
- Zoned-school proficiency averages 36% at this address vs 55% district-wide (-18 pts) — the specific schools serving this property underperform the Brevard average; the district grade overstates school quality for this exact location.
- Market conditions: Rents rising fast (+4.1%/yr); 167 active listings in the ZIP; 15 comparable units currently listed for rent nearby; rentals at typical pace (median 25d on market — plan ~3-4 weeks tenant-placement turnaround); lower-income renter base — watch delinquency; 4,602 units permitted in Brevard County in 2024 (702 in 5+ unit buildings).
- At $1,808/mo this rent would consume 49% of the median local household income ($44k/yr) (locally 1007% of renters already pay >50% of income on rent) — very limited rent-growth headroom before tenants either downsize or default.
Forward outlook
- Local home prices are declining (-3.0%/yr); year-one equity from $1k of loan paydown is wiped out by about $6k of value loss. Plan a longer hold.
- Brevard County population projected at +15% by 2050 — modest demand growth; plan on rents tracking national, not racing it.
Negotiation context
- It's been on market 44 days — a 3% lower offer ($183k) is reasonable based on typical stale-listing flexibility.
Risks & watch-outs
- Watch-outs: built in 1959 — expect roof / HVAC / electrical / plumbing capex.
- Climate carrying-cost: severe wind risk, 99% chance of damaging wind over 30y; extreme-heat days projected 7→23/yr by 2055 (HVAC capex compounding) — expect insurance premiums to compound above CPI over the hold.
Questions for the listing agent
- It's been on market 44 days. Have you received any prior offers? Is the seller open to a 4% concession, seller financing, or rate buy-down credit?
- Built in 1959 — when were the roof, HVAC, electrical panel, plumbing, and water heater last replaced?
- Is there a deadline driving the sale (1031 exchange, divorce, estate, relocation)? That informs how much negotiation room exists.
- Schools are B-rated — typically a magnet for longer-tenancy family renters. What's the average tenant stay here, and is there a school-zone premium baked into asking?
- Crime grade is F in this area — have there been break-ins, vandalism, or insurance claims at this property in the last 3 years? What carrier currently insures it and at what premium?
- The area grade is low — what's the realistic commute time and amenity access for the typical tenant pool here? Any planned neighborhood developments (good or bad) we should know about?
- What's the average days-on-market for RENTAL listings here right now (not sales)? A rising rental-DOM trend means longer vacancies and softer asking-rent achievability than the comps imply.
- What's the recent tenant-quality profile in this submarket — average credit score on applications, eviction rate, late-payment / NSF rate, and stable-employment percentage? A property-management company in the area should have these aggregated.
- How much new for-sale + rental construction is in the pipeline within 1–3 miles? Heavy new supply typically softens prices + rents 12–24 months out; constrained supply supports both.
Investment metrics
- 1% rule
- 0.96% ✗
- Cap rate
- 7.31%
- Cash-on-cash
- 3.62%
- DSCR
- 1.16
- GRM
- 8.7
CMA / ARV
No comps found within radius.
Projected returns pro-forma
-3.0% appreciation · 4.13% rent growth · sell at horizon
- IRR
- -9.4%
- Equity multiple
- 0.65×
- Total profit
- $-18,386
- Equity at exit
- $28,181
- IRR
- 1.5%
- Equity multiple
- 1.11×
- Total profit
- $5,817
- Equity at exit
- $16,341
Cash invested: $52,920 (down + closing). Projections, not guarantees.
Landlord ↔ Tenant lean methodology
- Overall (STATE)
- 87 Strongly Landlord-Friendly
- State Florida
- 87 Strongly Landlord-Friendly · R+3
- County
- — inherits STATE
- City
- — inherits STATE
ZIP-level market 32922
- Home prices YoY
- -20.3%
- Rents YoY
- 4.1%
- Active inventory
- 167
- Price-to-rent
- 8.7×
Monthly cashflow live
- Estimated rent
- $1,808 high interval (Pro) →
- Mortgage (P&I)
- −$991
- Tax from tax record
- −$199 /mo · $2,392/yr
- Insurance
- −$79
- HOA
- −$0
- Vacancy / Maint / Mgmt
- −$380
- Net cashflow
- $159
Break-even live
Sensitivity live
| Price | -10% $266 | -5% $213 | +0% $159 | +5% $106 | +10% $52 |
|---|---|---|---|---|---|
| Rent | -10% $17 | -5% $88 | +0% $159 | +5% $231 | +10% $302 |
| Rate | -1.0pp $255 | -0.5pp $208 | base $159 | +0.5pp $110 | +1.0pp $61 |
UW: 25.0% down · 7.5% · 30yr · 1.5% tax · 5.0% vac · 8.0% maint · 8.0% mgmt
Financing live
Cash to close
- Down payment
- $47,250
- Closing costs
- $5,670
- Reserves months
- —
- Total cash needed
- —
Loan-product check · same deal, 3 products live
Conventional
25% down · 7.5% · 30yr
- Down + closing
- —
- Monthly P&I
- —
- Monthly cashflow
- —
- DSCR
- —
- Eligible?
- —
Personal DTI + credit; lowest rate.
DSCR
20% down · 8.5% · 30yr
- Down + closing
- —
- Monthly P&I
- —
- Monthly cashflow
- —
- DSCR
- —
- Eligible?
- —
No personal income docs; deal must DSCR.
Hard money
10% down · 12.0% · 12mo
- Down + closing
- —
- Monthly P&I
- —
- Monthly cashflow
- —
- DSCR
- —
- Eligible?
- —
Short-term bridge; refi at stabilization.
Rent comps 15 comps
| Address | Beds | Baths | Sqft | Rent | $/sqft | DOM | Units | Dist |
|---|---|---|---|---|---|---|---|---|
| 613 Paw Paw St Apt A Cocoa, FL | 2.0 | 1.0 | 1104 | $1,175 | $1.06 | 25d | 1 | 0.28mi |
| 516 Donley St Cocoa, FL | 2.0 | 2.0 | 1485 | $1,800 | $1.21 | 20d | 1 | 0.32mi |
| 305 Prospect Ave Cocoa, FL | 3.0 | 1.0 | 1180 | $1,595 | $1.35 | 25d | 1 | 0.45mi |
| 305 Edinburgh Dr Cocoa, FL | 3.0 | 1.5 | 1280 | $1,750 | $1.37 | 25d | 1 | 0.45mi |
| 1105 Santa Rosa Dr Rockledge, FL | 3.0 | 2.0 | 1096 | $2,000 | $1.82 | 25d | 1 | 0.56mi |
| 39 Carmalt St Unit B Cocoa, FL | 2.0 | 1.0 | 1514 | $1,550 | $1.02 | 25d | 1 | 0.63mi |
| 420 N Fiske Blvd Cocoa, FL | 3.0 | 1.5 | 1382 | $1,695 | $1.23 | 25d | 1 | 0.65mi |
| 944 Kentucky Ave Rockledge, FL | 3.0 | 2.0 | 1236 | $1,945 | $1.57 | 20d | 1 | 0.71mi |
| 295 Royal Tern CIR Rockledge, FL | 1.0–3.0 | 1.0–2.0 | 1020 | $2,467 | $2.42 | 16d | 33 | 0.73mi |
| 1515 Peachtree St Cocoa, FL | 3.0 | 2.0 | 1056 | $1,475 | $1.40 | 25d | 1 | 0.97mi |
| 102 Riverside Dr #806 Cocoa, FL | 3.0 | 3.0 | 2019 | $3,500 | $1.73 | 25d | 1 | 0.97mi |
| 1607 Amalfi Dr Cocoa, FL | 3.0–4.0 | 2.0 | 1750 | $2,488 | $1.42 | 15d | 5 | 1.11mi |
| 1147 Manatee Dr Rockledge, FL | 3.0 | 2.0 | 1810 | $2,095 | $1.16 | 20d | 1 | 1.14mi |
| 1105 Myrtle Ln Cocoa, FL | 3.0 | 1.5 | 1232 | $1,800 | $1.46 | 16d | 1 | 1.22mi |
| 1675 S Fiske Blvd #155 Rockledge, FL | 2.0 | 2.0 | 1170 | $1,750 | $1.50 | 15d | 1 | 1.46mi |
Listing history 17 events
-
2026-06-22days on market $189,000 Active 44 DOM
-
2026-06-18days on market $189,000 Active 41 DOM
-
2026-06-17days on market $189,000 Active 40 DOM
-
2026-06-16days on market $189,000 Active 39 DOM
-
2026-06-15days on market $189,000 Active 38 DOM
-
2026-06-14days on market $189,000 Active 36 DOM
-
2026-06-10days on market $189,000 Active 33 DOM
-
2026-06-08days on market $189,000 Active 31 DOM
-
2026-06-07days on market $189,000 Active 30 DOM
-
2026-06-05days on market $189,000 Active 27 DOM
-
2026-06-03days on market $189,000 Active 26 DOM
-
2026-06-02days on market $189,000 Active 25 DOM
-
2026-06-01days on market $189,000 Active 24 DOM
-
2026-05-31days on market $189,000 Active 23 DOM
-
2026-05-31days on market $189,000 Active 22 DOM
-
2026-05-08status Pending
-
2026-04-20$189,000 Active
ⓘ Source: listings_history table (triggers on properties + properties_extension) + one-shot
backfill from property_details.listing_events for pre-trigger history.
Tax reassessment forecast FL · Resets to sale price
- Current annual tax
- $2,392 · $199/mo
- Projected year-2 tax
- $2,392 · $199/mo
- Expected delta
- $0/yr ($0/mo · 0.0%)
ⓘ Screening estimate from a state-policy table — verify with the county assessor before closing.
Climate risk First Street
- Flood 1/10 Low FEMA zone X (unshaded) · 0% chance over 30 yrs
- Wildfire 3/10 Moderate
- Heat 10/10 Extreme 7 d/yr ≥106°F today · 23 d/yr by 30 yrs out
- Wind 10/10 Extreme 99% chance of damaging wind over 30 yrs
- Air quality 1/10 Low 0 unhealthy d/yr today · 0 by 30 yrs out
Nearby sold comps map
Loading sold comps map…
Walkable amenities ~0.75 mi
Loading nearby amenities…
Taxation est. · year 1
- Rental income
- $21,701
- − Mortgage interest
- −$10,587
- − Property taxes
- −$2,392
- − Insurance
- −$945
- − Repairs & maintenance
- −$1,736
- − Management
- −$1,736
- − Depreciation
- −$5,498
- Taxable loss
- −$1,193
- Est. tax savings @ 24.0%
- +$286
- After-tax cash flow
- $2,200/yr
For passive investors: Depreciation is non-cash, so a rental often shows a tax loss while cash-flowing — sheltering income. Rental losses are passive: they offset passive income freely, and up to $25,000/yr can offset ordinary (W-2) income if you actively participate and your MAGI is under $100k (phasing out to $0 by $150k); unused losses carry forward. On sale, claimed depreciation is recaptured at up to 25%, and gains may owe capital-gains tax (a 1031 exchange can defer both). Figures are a year-1 estimate at your 24.0% rate — not tax advice; consult a CPA.
Schools (NCES district)
- District
- Brevard
- NCES district ID
- 1200150
- Math proficiency
- 53% ▼ -9.00%
- Reading proficiency
- 57% ▼ -4.00%
- Median HH income
- $49,426
- Composite
- 46.86/100
- National rank
- #2370
- State rank
- #19 of 73 in FL
Livability — Cocoa
- Score
- 72/100
- State rank
- #344
- US rank
- #5979
Category grades
Schools grade is shown separately in the Schools card above.
Census & demographics
- Census place
- Cocoa, FL
- County
- Brevard County · 602,871 people
- City population
- 67,424
- Metro
- Palm Bay-Melbourne-Titusville, FL
- Population (ZIP)
- 14,700
- Household income
- $44,469
- Rent vs Own
- Severe rent burden
- 1007.0
Population outlook (Brevard County) Hauer SSP2
- Today (2025)
- 623,254 people
- By 2030
- 648,420 · +4.0%
- By 2040
- 690,009 · +10.7%
- By 2050
- 715,669 · +14.8%
- By 2075
- 775,744 · +24.5%
- By 2100
- 776,687 · +24.6%
Race, ethnicity, and origin ACS 2023
- Neighborhood character
- Diverse neighborhood (Simpson 0.66)
- Race & ethnicity
- White 45% Black 29% Hispanic / Latino 21% Two or more races 12%
- Hispanic origin (detail)
- Mexican 10% Puerto Rican 1% Cuban 4%
- Common ancestry
- Slovak 2% Romanian 2% Lithuanian 1%
- Foreign-born
- 14% · Canada
- Languages at home
- 81% English-only · Spanish 16% German/W. Germanic 2%
Political lean MEDSL · Brevard
- 2024 margin
- Strong R (+20.8) · D 39.1% · R 59.9% · Other 1.0%
- 2008→2024 swing
- -10.4pp toward R · 2008: -10.4pp · 2024: -20.8pp
- All cycles
- 2024: R+20.8 2020: R+16.4 2016: R+19.8 2012: R+12.7 2008: R+10.4
Not yet ingested
- Civics
- —
Market trends
- HPI YoY
- ▼ -68.95%
- Current HPI
- 271.1139
- Rent YoY
- ▲ 4.13%
- Metro
- Palm Bay-Melbourne-Titusville, FL
- State GDP YoY
- ▲ 3.28%
- F500 in state
- 36
Industry mix (Fortune 500 HQ in FL)
| Industry | F500 HQs | Revenue |
|---|---|---|
| Industrial Technology | 2 | $29B |
|
||
| Insurance | 2 | $17B |
|
||
| Retail | 1 | $60B |
|
||
| Technology Distribution | 1 | $58B |
|
||
| Homebuilding | 1 | $35B |
|
||
| Technology Manufacturing | 1 | $35B |
|
||
Price history
2 events — show timeline
- 2026-05-08 Pending — Stellar MLS as Distributed by MLS Grid
- 2026-04-20 Listed $189,000 Stellar MLS as Distributed by MLS Grid
Property tax history
+9.1%/yrLatest (2025): $2,392 · +3.4% YoY. Source: county tax records.
Cash-flow waterfall
monthlySold comps — $/sqft
last 12 mo · ≤1 miLoading sold comps…