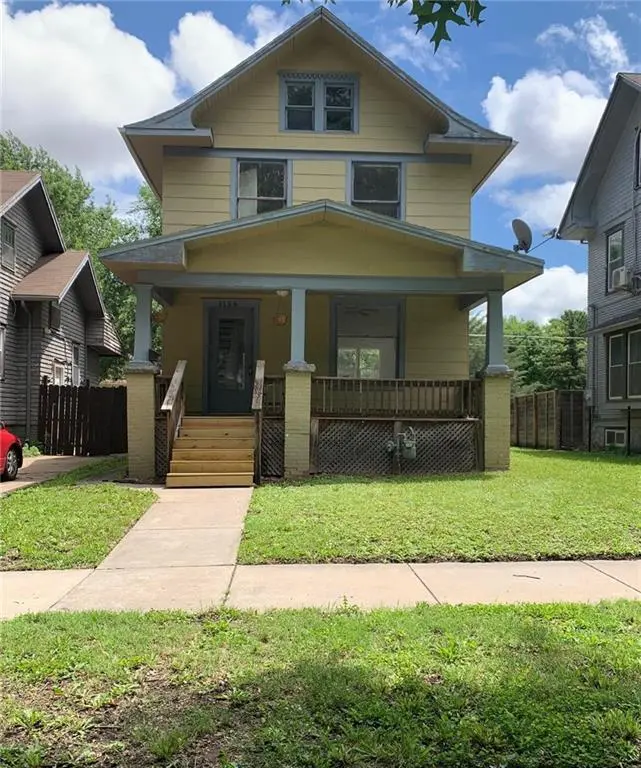
1156 SW Garfield Ave · Topeka, KS
Flood risk 1/10 · Minimal
- FEMA flood zone
- X (unshaded)
- Chance of flooding over 30 yrs
- 0.0%
- Est. flood insurance / yr
- $473 – $860
Fire risk 1/10 · Minimal
- Est. fire insurance / yr
- $1,154 – $2,142
Heat risk 4/10 · Minor
- Hot days now (above 107°F)
- 7 days/yr
- Hot days in 30 yrs
- 16 days/yr
Wind risk 2/10 · Minimal
- Chance of severe wind over 30 yrs
- —
Air-quality risk 3/10 · Minor
- Unhealthy air days now
- 3 days/yr
- Unhealthy air days in 30 yrs
- 4 days/yr
Risk factors via First Street. Map © Google.
Why this score? — see what drove the B grade
The composite is a weighted blend of 9 inputs, each scored 0–100. Each bar is that input's sub-score; the figure is the points it added to the 100-point composite (weight × sub-score).
- Cash flow +28.7/30.0
- ARV discount +15.0/15.0
- DSCR +10.0/10.0
- 1% rule +7.8/10.0
- Rent growth +3.6/5.0
- Livability +3.5/5.0
- Condition / age +2.5/5.0
- Schools +1.7/10.0
- Appreciation +0.0/10.0
$79,500
🖨 Deal sheet 📄 Offer letter ✓ Due diligence
Listing remarks
Great Home in Elmhurst Subdivision with lots of charm! Classic Covered Porch! Oversized windows for lots of natural light! Wood Floors throughout the home. Formal living room & formal dining room. Sun room/ Laundry room on the main level. Lots of room in this classic Galley kitchen, a highly efficient layout. Bedrooms are roomy, Primary has a Private sun room. Full bath upstairs & half bath is on the main level. The attic is accessible from bedroom 2, via stairs. Large backyard. Garage is in the alley. Full basement, no finished area. Must See!
Key facts
- Covered porch
- Formal dining room
- Wood floors
Tags
Property features AI
Finance
- HOA & community: No association fees
Exterior
- Parking: Detached garage that faces the rear (1-car)
- Utilities: Public water; Public sewer
- Home design: Single-family residence; Residential property; 2-story floor plan; Entry-level rooms on main floor
- Construction: Frame construction; Composition roof; Approximately 101+ years old
- Exterior features: Deck; Partial fencing; Not in a flood plain
Interior
- Kitchen: Kitchen on main level
- Bedrooms: 2 bedrooms (one on second level)
- Flooring: Vinyl flooring; Wood flooring
- Bathrooms: 1 full bath; 1 half bath
- Heating & cooling: Natural gas heating; Electric cooling
- Interior features: Sun room; Formal dining area; Full, unfinished basement
- Laundry & utility: Main-level laundry located off the kitchen
Neighborhood map
What this means for you Summary
Snapshot
- This is a 2-bed/1.5-bath single-family listed at $80k.
Deal economics
- At list price, monthly cash flow is $264 ($3k/yr) — positive.
- The deal already cash-flows at list — no discount required.
- Meets the 1% rule at list price ($1k rent vs $80k).
- Recommended offer: $78k (1.5% below list) — sets the bar for market timing.
- Cap rate 10.3% vs local median 4.3% in Topeka — top-decile yield for the area; either an underpriced asset or a hidden risk that comps aren't pricing in. Stress-test before assuming the spread holds.
Location & tenants
- Location reads 69/100 on livability (#195 in KS) — a middle-class / working-renter tenant base. Strengths: cost of living A+, housing A+, health & safety A+; Watch: employment C-, crime F, commute F.
- Topeka Public Schools (urban): math 17% / reading 23% proficiency, ranked #158 of 169 in KS (top 94%) — low school quality limits family demand, transient renter base, plan for 1-2y turnover; 69% free/reduced lunch — lower-income household profile, screen leases tightly.
- Zoned schools: Topeka High (math 11% / reading 20%, grade F, #248 of 327 statewide, top 76%, 1,514 students, 72% FRL) — zoned schools at 72% FRL track the district average.
- Market conditions: Rents rising fast (+4.4%/yr); 130 active listings in the ZIP; 19 comparable units currently listed for rent nearby; rentals at typical pace (median 21d on market — plan ~3-4 weeks tenant-placement turnaround); 219 units permitted in Shawnee County in 2024 (25 in 5+ unit buildings).
Forward outlook
- Local home prices are declining (-3.0%/yr); year-one equity from $550 of loan paydown is wiped out by about $2k of value loss. Plan a longer hold.
- Shawnee County population projected to shrink 7% by 2050 — rents likely to lag national; underwrite the cash flow, not the appreciation.
- At projected returns (-3.0% appreciation + 4.4% rent growth), your $22k cash investment doubles in ~8 years — after that, you're playing with house money.
Negotiation context
- It's been on market 19 days — a 2% lower offer ($78k) is reasonable based on typical stale-listing flexibility.
- 2 sale attempts since 10y ago with the ask held roughly flat each time — persistent listings suggest the price (not the market) is what's stuck; bring a comps-based counter.
- Current owner paid $28k; list at $80k implies a 184% gain — meaningful room to come down on a strong offer.
Risks & watch-outs
- Watch-outs: built in 1900 — expect roof / HVAC / electrical / plumbing capex.
Questions for the listing agent
- Built in 1900 — when were the roof, HVAC, electrical panel, plumbing, and water heater last replaced?
- Is there a deadline driving the sale (1031 exchange, divorce, estate, relocation)? That informs how much negotiation room exists.
- Schools are D-rated, which usually means shorter tenancies and higher turnover. Who's the typical renter profile here, and what's been the actual vacancy rate?
- Crime grade is F in this area — have there been break-ins, vandalism, or insurance claims at this property in the last 3 years? What carrier currently insures it and at what premium?
- What's the average days-on-market for RENTAL listings here right now (not sales)? A rising rental-DOM trend means longer vacancies and softer asking-rent achievability than the comps imply.
- What's the recent tenant-quality profile in this submarket — average credit score on applications, eviction rate, late-payment / NSF rate, and stable-employment percentage? A property-management company in the area should have these aggregated.
- How much new for-sale + rental construction is in the pipeline within 1–3 miles? Heavy new supply typically softens prices + rents 12–24 months out; constrained supply supports both.
Investment metrics
- 1% rule
- 1.28% ✓
- Cap rate
- 10.29%
- Cash-on-cash
- 14.26%
- DSCR
- 1.63
- GRM
- 6.5
CMA / ARV
- ARV (on-the-fly)
- $121,688
- Comps found
- 3
Show comp detail 3 sales within ~0.75 mi
| Address | Dist | Beds/Ba | Sqft | Sold | Price | $/sf | Match |
|---|---|---|---|---|---|---|---|
| 1417 Munson Ave | 0.07mi | 3/1.0 (+1) | 1,036 (-10%) | 9mo | $110,000 | $106 | 66 |
| 740 SW Jewell Ave | 0.58mi | 2/1.0 | 1,114 (-3%) | 5mo | $164,900 | $148 | 62 |
| 1031 SW High Ave | 0.62mi | 2/1.0 | 1,030 (-10%) | 14mo | $107,000 | $104 | 40 |
Match score weights: distance 35% · size 25% · config 20% · recency 20%. Top-matched comps best support the ARV.
Projected returns pro-forma
-3.0% appreciation · 4.39% rent growth · sell at horizon
- IRR
- 6.1%
- Equity multiple
- 1.24×
- Total profit
- $5,413
- Equity at exit
- $11,854
- IRR
- 16.7%
- Equity multiple
- 2.46×
- Total profit
- $32,528
- Equity at exit
- $6,874
Cash invested: $22,260 (down + closing). Projections, not guarantees.
Landlord ↔ Tenant lean methodology
- Overall (STATE)
- 83 Strongly Landlord-Friendly
- State Kansas
- 83 Strongly Landlord-Friendly · R+10
- County
- — inherits STATE
- City
- — inherits STATE
ZIP-level market 66604
- Rents YoY
- 4.4%
- Active inventory
- 130
- Price-to-rent
- 6.5×
Monthly cashflow live
- Estimated rent
- $1,017 high interval (Pro) →
- Mortgage (P&I)
- −$417
- Tax from tax record
- −$89 /mo · $1,067/yr
- Insurance
- −$33
- HOA
- −$0
- Vacancy / Maint / Mgmt
- −$214
- Net cashflow
- $264
Break-even live
UW: 25.0% down · 7.5% · 30yr · 1.5% tax · 5.0% vac · 8.0% maint · 8.0% mgmt
Financing live
Cash to close
- Down payment
- $19,875
- Closing costs
- $2,385
- Reserves months
- —
- Total cash needed
- —
Loan-product check · same deal, 3 products live
Conventional
25% down · 7.5% · 30yr
- Down + closing
- —
- Monthly P&I
- —
- Monthly cashflow
- —
- DSCR
- —
- Eligible?
- —
Personal DTI + credit; lowest rate.
DSCR
20% down · 8.5% · 30yr
- Down + closing
- —
- Monthly P&I
- —
- Monthly cashflow
- —
- DSCR
- —
- Eligible?
- —
No personal income docs; deal must DSCR.
Hard money
10% down · 12.0% · 12mo
- Down + closing
- —
- Monthly P&I
- —
- Monthly cashflow
- —
- DSCR
- —
- Eligible?
- —
Short-term bridge; refi at stabilization.
Rent comps 19 comps
| Address | Beds | Baths | Sqft | Rent | $/sqft | DOM | Units | Dist |
|---|---|---|---|---|---|---|---|---|
| 1027 SW Woodward Ave Topeka, KS | 3.0 | 1.0 | 864 | $1,195 | $1.38 | 20d | 1 | 0.40mi |
| 937 SW Jewell Ave Topeka, KS | 3.0 | 1.0 | 1297 | $1,295 | $1.00 | 20d | 1 | 0.46mi |
| 1515 SW 15th St Topeka, KS | 1.0 | 1.0 | 775 | $700 | $0.90 | 20d | 1 | 0.51mi |
| 1510 SW Lane St Topeka, KS | 1.0 | 1.0 | 750 | $675 | $0.90 | 20d | 1 | 0.55mi |
| 1436 SW Byron St Topeka, KS | 2.0 | 1.0 | 900 | $720 | $0.80 | 20d | 1 | 0.61mi |
| 1268 SW Western Ave Unit 1A Topeka, KS | 2.0 | 1.0 | 1404 | $1,000 | $0.71 | 20d | 1 | 0.64mi |
| 728 SW Lindenwood Ave Topeka, KS | 2.0 | 1.0 | 968 | $1,195 | $1.23 | 20d | 1 | 0.65mi |
| 1116 SW 18th St Topeka, KS | 3.0 | 1.0 | 1105 | $1,175 | $1.06 | 20d | 1 | 0.84mi |
| 512 SW 14th St Topeka, KS | 2.0 | 1.0 | 815 | $895 | $1.10 | 20d | 1 | 0.87mi |
| 1624 SW Polk St Topeka, KS | 3.0 | 2.0 | 1288 | $1,350 | $1.05 | 20d | 1 | 0.94mi |
| 1900 SW Washburn Ave Topeka, KS | 2.0 | 1.0 | 883 | $890 | $1.01 | 20d | 1 | 0.94mi |
| 507 SW 6th Ave Unit 001 Topeka, KS | 1.0 | 1.0 | 710 | $700 | $0.99 | 20d | 1 | 1.06mi |
| 603 SW Topeka Blvd Topeka, KS | 1.0 | 1.0 | 710 | $700 | $0.99 | 20d | 1 | 1.08mi |
| 1438 SW Van Buren St Apt 4 Topeka, KS | 2.0 | 1.0 | 700 | $825 | $1.18 | 20d | 1 | 1.11mi |
| 1623 SW Campbell Ave Topeka, KS | 2.0 | 1.0 | 828 | $1,100 | $1.33 | 20d | 1 | 1.11mi |
| 2045 SW Macvicar Ave Topeka, KS | 2.0 | 2.0 | 860 | $875 | $1.02 | 20d | 1 | 1.26mi |
| 111 NW Quinton Ave Topeka, KS | 3.0 | 1.5 | 1232 | $1,045 | $0.85 | 20d | 1 | 1.29mi |
| 2409 SW 21st St Topeka, KS | 3.0 | 1.0 | 890 | $850 | $0.96 | 20d | 1 | 1.32mi |
| 2130 SW Fillmore St Topeka, KS | 2.0 | 1.0 | 800 | $800 | $1.00 | 20d | 1 | 1.38mi |
Listing history 14 events
-
2026-06-19days on market $79,500 Active 19 DOM
-
2026-06-18days on market $79,500 Active 18 DOM
-
2026-06-17days on market $79,500 Active 17 DOM
-
2026-06-16days on market $79,500 Active 16 DOM
-
2026-06-15days on market $79,500 Active 15 DOM
-
2026-06-14days on market $79,500 Active 13 DOM
-
2026-06-13days on market $79,500 Active 12 DOM
-
2026-06-10days on market $79,500 Active 10 DOM
-
2026-06-09days on market $79,500 Active 9 DOM
-
2026-06-08days on market $79,500 Active 8 DOM
-
2026-06-07days on market $79,500 Active 7 DOM
-
2026-06-02days on market $79,500 Active 2 DOM
-
2026-06-01remarks 555-char remark
-
2026-06-01$79,500 Active 1 DOM
ⓘ Source: listings_history table (triggers on properties + properties_extension) + one-shot
backfill from property_details.listing_events for pre-trigger history.
Tax reassessment forecast KS · Resets to sale price
- Current annual tax
- $1,067 · $89/mo
- Projected year-2 tax
- $1,121 · $93/mo
- Expected delta
- +$54/yr (+$4/mo · 5.0%)
ⓘ Screening estimate from a state-policy table — verify with the county assessor before closing.
Climate risk First Street
- Flood 1/10 Low FEMA zone X (unshaded) · 0% chance over 30 yrs
- Wildfire 1/10 Low
- Heat 4/10 Moderate 7 d/yr ≥107°F today · 16 d/yr by 30 yrs out
- Wind 2/10 Low
- Air quality 3/10 Moderate 3 unhealthy d/yr today · 4 by 30 yrs out
Nearby sold comps map
Loading sold comps map…
Walkable amenities ~0.75 mi
Loading nearby amenities…
Taxation est. · year 1
- Rental income
- $12,204
- − Mortgage interest
- −$4,453
- − Property taxes
- −$1,067
- − Insurance
- −$398
- − Repairs & maintenance
- −$976
- − Management
- −$976
- − Depreciation
- −$2,313
- Taxable income
- $2,021
- Est. tax owed @ 24.0%
- −$485
- After-tax cash flow
- $2,689/yr
For passive investors: Depreciation is non-cash, so a rental often shows a tax loss while cash-flowing — sheltering income. Rental losses are passive: they offset passive income freely, and up to $25,000/yr can offset ordinary (W-2) income if you actively participate and your MAGI is under $100k (phasing out to $0 by $150k); unused losses carry forward. On sale, claimed depreciation is recaptured at up to 25%, and gains may owe capital-gains tax (a 1031 exchange can defer both). Figures are a year-1 estimate at your 24.0% rate — not tax advice; consult a CPA.
Schools (NCES district)
- District
- Topeka Public Schools
- NCES district ID
- 2012260
- Math proficiency
- 17% ▼ -8.00%
- Reading proficiency
- 23% ▼ -2.00%
- Median HH income
- $37,405
- Composite
- 16.69/100
- National rank
- #9167
- State rank
- #158 of 169 in KS
Livability — Topeka
- Score
- 69/100
- State rank
- #195
- US rank
- #8848
Category grades
Schools grade is shown separately in the Schools card above.
Census & demographics
- Census place
- Topeka, KS
- County
- Shawnee County · 118,130 people
- City population
- 118,130
- Metro
- Topeka, KS
- Population (ZIP)
- 23,006
- Household income
- $60,874
- Rent vs Own
- Severe rent burden
- 1192.0
Population outlook (Shawnee County) Hauer SSP2
- Today (2025)
- 179,277 people
- By 2030
- 177,762 · -0.8%
- By 2040
- 172,341 · -3.9%
- By 2050
- 166,330 · -7.2%
- By 2075
- 152,417 · -15.0%
- By 2100
- 134,782 · -24.8%
Race, ethnicity, and origin ACS 2023
- Neighborhood character
- Predominantly White (70%)
- Race & ethnicity
- White 70% Hispanic / Latino 15% Two or more races 11% Black 6% Asian 1%
- Hispanic origin (detail)
- Mexican 12%
- Common ancestry
- Slovak 2% Lithuanian 2% Romanian 1%
- Foreign-born
- 4% · Canada, China
- Languages at home
- 94% English-only · Spanish 4% Other Asian/Pacific 1% Other Indo-European 1%
Political lean MEDSL · Shawnee
- 2024 margin
- Toss-up / Even · D 49.3% · R 48.8% · Other 2.0%
- 2008→2024 swing
- +0.8pp no change · 2008: -0.3pp · 2024: 0.5pp
- All cycles
- 2024: D+0.5 2020: D+3.0 2016: R+2.8 2012: R+1.7 2008: R+0.3
Not yet ingested
- Civics
- —
Market trends
- HPI YoY
- ▼ -151.78%
- Current HPI
- 227.637
- Rent YoY
- ▲ 4.39%
- Metro
- Topeka, KS
- State GDP YoY
- —
- F500 in state
- 0
Price history
+183.9% since first listed5 events — show timeline
- 2026-05-31 Listed $79,500 Heartland MLS as Distributed by MLS Grid
- 2016-04-18 Listed $58,000 Sunflower MLS as distributed by MLS GRID
- 2009-06-01 Sold (Public Records) — Public Records
- 2008-02-21 Sold (Public Records) — Public Records
- 1985-06-01 Sold (Public Records) $28,000 Public Records
Property tax history
-0.3%/yrLatest (2025): $1,067 · +6.8% YoY. Source: county tax records.
Cash-flow waterfall
monthlySold comps — $/sqft
last 12 mo · ≤1 miLoading sold comps…