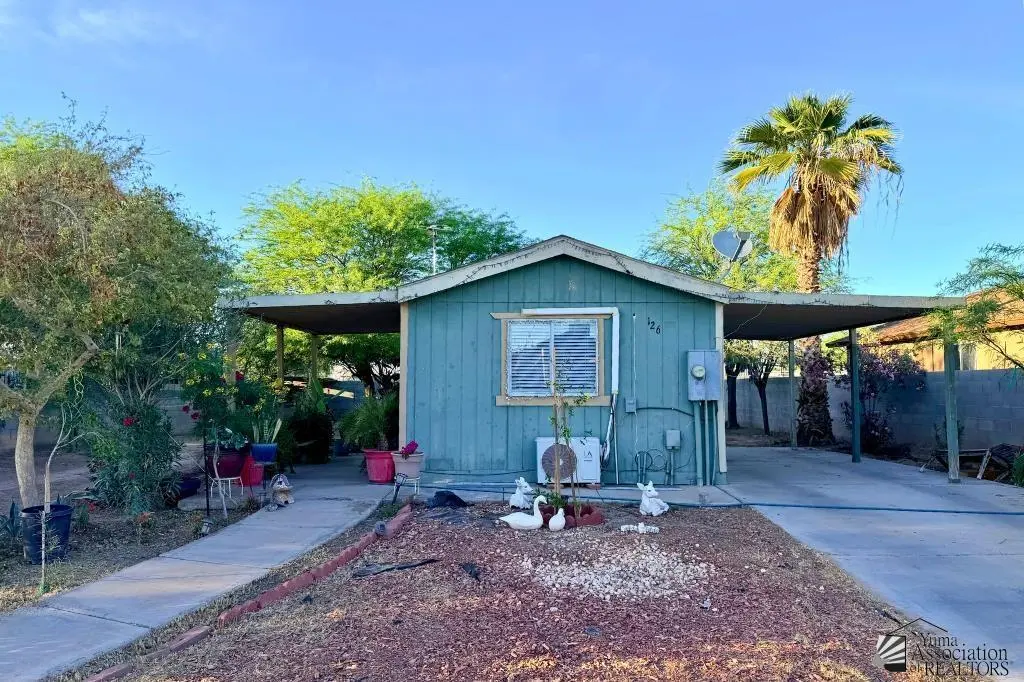
126 E Los Valles St · San Luis, AZ
Flood risk 1/10 · Minimal
- FEMA flood zone
- X
- Chance of flooding over 30 yrs
- 0.0%
- Est. flood insurance / yr
- $507 – $1,088
Fire risk 2/10 · Minimal
- Est. fire insurance / yr
- $610 – $1,132
Heat risk 9/10 · Severe
- Hot days now (above 112°F)
- 6 days/yr
- Hot days in 30 yrs
- 16 days/yr
Wind risk 1/10 · Minimal
- Chance of severe wind over 30 yrs
- —
Air-quality risk 2/10 · Minimal
- Unhealthy air days now
- 1 days/yr
- Unhealthy air days in 30 yrs
- 1 days/yr
Risk factors via First Street. Map © Google.
Why this score? — see what drove the C- grade
The composite is a weighted blend of 9 inputs, each scored 0–100. Each bar is that input's sub-score; the figure is the points it added to the 100-point composite (weight × sub-score).
- Cash flow +22.0/30.0
- ARV discount +7.5/15.0
- DSCR +7.0/10.0
- 1% rule +4.7/10.0
- Livability +3.8/5.0
- Rent growth +2.5/5.0
- Condition / age +2.5/5.0
- Schools +1.3/10.0
- Appreciation +0.0/10.0
$139,900
🖨 Deal sheet 📄 Offer letter ✓ Due diligence
Listing remarks
Discover the charm of this single-wide home nestled in Rancho Los Oros subdivision in San Luis, AZ. This cozy residence features 2 bedrooms and a bathroom, perfect for comfortable living. Step outside to enjoy your fully fenced backyard. The easy-care landscaping makes maintenance a breeze, allowing you more time to enjoy your new home. Don't miss the opportunity to make this property your own—experience the perfect blend of comfort and convenience in a welcoming community!
Key facts
- Welcoming community
- 5,278 sq ft lot
- Garage
Tags
Property features AI
Exterior
- Parking: Attached carport; 1 covered parking space; 1 total parking space
- Utilities: Public water; Public sewer
- Home design: Manufactured home; Residential property
- Exterior features: Paved road access; Curbs and sidewalks
Interior
- Kitchen: Electric range
- Flooring: Wood flooring; Tile flooring
- Bathrooms: 1 full bathroom
- Heating & cooling: Has heating; Has cooling
- Interior features: Double-pane windows; No fireplace
Neighborhood map
What this means for you Summary
Snapshot
- This is a 2-bed/1.0-bath manufactured listed at $140k.
Deal economics
- At list price, monthly cash flow is $224 ($3k/yr) — positive.
- The deal already cash-flows at list — no discount required.
- To meet the 1% rule (rent ≥ 1% of price), the offer needs to be $136k (3.1% below list).
- Recommended offer: $132k (6.0% below list) — sets the bar for market timing.
- Cap rate 8.2% vs local median 4.1% in San Luis — top-decile yield for the area; either an underpriced asset or a hidden risk that comps aren't pricing in. Stress-test before assuming the spread holds.
Location & tenants
- Location reads 76/100 on livability (#13 in AZ, #3,388 nationally) — a middle-class / working-renter tenant base. Strengths: crime A+, cost of living A+, housing A+; Watch: amenities D+, employment D, schools F.
- Yuma Union High School District (4507) (urban): math 14% / reading 16% proficiency, ranked #212 of 249 in AZ (top 85%) — low school quality limits family demand, transient renter base, plan for 1-2y turnover.
- Market conditions: 115 active listings in the ZIP; 1,399 units permitted in Yuma County in 2024 (180 in 5+ unit buildings).
Forward outlook
- Local home prices are declining (-3.0%/yr); year-one equity from $967 of loan paydown is wiped out by about $4k of value loss. Plan a longer hold.
- Yuma County population projected at +4% by 2050 — modest demand growth; plan on rents tracking national, not racing it.
Negotiation context
- It's been on market 70 days — a 6% lower offer ($132k) is reasonable based on typical stale-listing flexibility.
- Current owner paid $60k; list at $140k implies a 133% gain — meaningful room to come down on a strong offer.
Risks & watch-outs
- Climate carrying-cost: extreme-heat days projected 6→16/yr by 2055 (HVAC capex compounding) — expect insurance premiums to compound above CPI over the hold.
Questions for the listing agent
- It's been on market 70 days. Have you received any prior offers? Is the seller open to a 6% concession, seller financing, or rate buy-down credit?
- Why hasn't it sold? Are there any deal-killer items the seller is aware of (foundation, flood, title, zoning, code violations)?
- Is there a deadline driving the sale (1031 exchange, divorce, estate, relocation)? That informs how much negotiation room exists.
- Schools are F-rated, which usually means shorter tenancies and higher turnover. Who's the typical renter profile here, and what's been the actual vacancy rate?
- What's the average days-on-market for RENTAL listings here right now (not sales)? A rising rental-DOM trend means longer vacancies and softer asking-rent achievability than the comps imply.
- What's the recent tenant-quality profile in this submarket — average credit score on applications, eviction rate, late-payment / NSF rate, and stable-employment percentage? A property-management company in the area should have these aggregated.
- How much new for-sale + rental construction is in the pipeline within 1–3 miles? Heavy new supply typically softens prices + rents 12–24 months out; constrained supply supports both.
Investment metrics
- 1% rule
- 0.97% ✗
- Cap rate
- 8.21%
- Cash-on-cash
- 6.85%
- DSCR
- 1.30
- GRM
- 8.6
CMA / ARV
No comps found within radius.
Projected returns pro-forma
-3.0% appreciation · 3.0% rent growth · sell at horizon
- IRR
- -5.8%
- Equity multiple
- 0.78×
- Total profit
- $-8,487
- Equity at exit
- $20,860
- IRR
- 3.8%
- Equity multiple
- 1.27×
- Total profit
- $10,726
- Equity at exit
- $12,096
Cash invested: $39,172 (down + closing). Projections, not guarantees.
Landlord ↔ Tenant lean methodology
- Overall (STATE)
- 87 Strongly Landlord-Friendly
- State Arizona
- 87 Strongly Landlord-Friendly · R+3
- County
- — inherits STATE
- City
- — inherits STATE
ZIP-level market 85336
- Active inventory
- 115
- Price-to-rent
- 8.6×
Monthly cashflow live
- Estimated rent
- $1,355 medium interval (Pro) →
- Mortgage (P&I)
- −$734
- Tax from tax record
- −$55 /mo · $664/yr
- Insurance
- −$58
- HOA
- −$0
- Vacancy / Maint / Mgmt
- −$285
- Net cashflow
- $224
Break-even live
UW: 25.0% down · 7.5% · 30yr · 1.5% tax · 5.0% vac · 8.0% maint · 8.0% mgmt
Financing live
Cash to close
- Down payment
- $34,975
- Closing costs
- $4,197
- Reserves months
- —
- Total cash needed
- —
Loan-product check · same deal, 3 products live
Conventional
25% down · 7.5% · 30yr
- Down + closing
- —
- Monthly P&I
- —
- Monthly cashflow
- —
- DSCR
- —
- Eligible?
- —
Personal DTI + credit; lowest rate.
DSCR
20% down · 8.5% · 30yr
- Down + closing
- —
- Monthly P&I
- —
- Monthly cashflow
- —
- DSCR
- —
- Eligible?
- —
No personal income docs; deal must DSCR.
Hard money
10% down · 12.0% · 12mo
- Down + closing
- —
- Monthly P&I
- —
- Monthly cashflow
- —
- DSCR
- —
- Eligible?
- —
Short-term bridge; refi at stabilization.
Listing history 21 events
-
2026-06-19pricedays on market $139,900 Active 70 DOM
-
2026-06-18days on market $148,500 Active 69 DOM
-
2026-06-17days on market $148,500 Active 68 DOM
-
2026-06-16days on market $148,500 Active 67 DOM
-
2026-06-15days on market $148,500 Active 66 DOM
-
2026-06-14days on market $148,500 Active 64 DOM
-
2026-06-12days on market $148,500 Active 63 DOM
-
2026-06-10days on market $148,500 Active 61 DOM
-
2026-06-09days on market $148,500 Active 60 DOM
-
2026-06-08days on market $148,500 Active 59 DOM
-
2026-06-07days on market $148,500 Active 58 DOM
-
2026-06-05days on market $148,500 Active 56 DOM
-
2026-06-04days on market $148,500 Active 54 DOM
-
2026-06-02days on market $148,500 Active 53 DOM
-
2026-06-01days on market $148,500 Active 52 DOM
-
2026-05-31days on market $148,500 Active 51 DOM
-
2026-05-30days on market $148,500 Active 50 DOM
-
2026-05-01price $148,500
-
2026-04-15price $159,000
-
2026-04-10$169,900 Active
-
2005-07-28soldstatus $60,000
ⓘ Source: listings_history table (triggers on properties + properties_extension) + one-shot
backfill from property_details.listing_events for pre-trigger history.
Tax reassessment forecast AZ · Resets to sale price
- Current annual tax
- $664 · $55/mo
- Projected year-2 tax
- $923 · $77/mo
- Expected delta
- +$260/yr (+$22/mo · 39.1%)
ⓘ Screening estimate from a state-policy table — verify with the county assessor before closing.
Climate risk First Street
- Flood 1/10 Low FEMA zone X · 0% chance over 30 yrs
- Wildfire 2/10 Low
- Heat 9/10 Extreme 6 d/yr ≥112°F today · 16 d/yr by 30 yrs out
- Wind 1/10 Low
- Air quality 2/10 Low 1 unhealthy d/yr today · 1 by 30 yrs out
Nearby sold comps map
Loading sold comps map…
Walkable amenities ~0.75 mi
Loading nearby amenities…
Taxation est. · year 1
- Rental income
- $16,265
- − Mortgage interest
- −$7,837
- − Property taxes
- −$664
- − Insurance
- −$700
- − Repairs & maintenance
- −$1,301
- − Management
- −$1,301
- − Depreciation
- −$4,070
- Taxable income
- $393
- Est. tax owed @ 24.0%
- −$94
- After-tax cash flow
- $2,588/yr
For passive investors: Depreciation is non-cash, so a rental often shows a tax loss while cash-flowing — sheltering income. Rental losses are passive: they offset passive income freely, and up to $25,000/yr can offset ordinary (W-2) income if you actively participate and your MAGI is under $100k (phasing out to $0 by $150k); unused losses carry forward. On sale, claimed depreciation is recaptured at up to 25%, and gains may owe capital-gains tax (a 1031 exchange can defer both). Figures are a year-1 estimate at your 24.0% rate — not tax advice; consult a CPA.
Schools (NCES district)
- District
- Yuma Union High School District (4507)
- NCES district ID
- 0409630
- Math proficiency
- 14% ▼ -12.00%
- Reading proficiency
- 16% ▼ -10.00%
- Median HH income
- $40,512
- Composite
- 12.86/100
- National rank
- #9592
- State rank
- #212 of 249 in AZ
Livability — San Luis
- Score
- 76/100
- State rank
- #13
- US rank
- #3388
Category grades
Schools grade is shown separately in the Schools card above.
Census & demographics
- Census place
- San Luis, AZ
- City population
- 28,810
- Population (ZIP)
- 7,884
Population outlook (Yuma County) Hauer SSP2
- Today (2025)
- 211,633 people
- By 2030
- 214,114 · +1.2%
- By 2040
- 217,856 · +2.9%
- By 2050
- 220,276 · +4.1%
- By 2075
- 222,359 · +5.1%
- By 2100
- 198,880 · -6.0%
Race, ethnicity, and origin ACS 2023
- Neighborhood character
- Predominantly Hispanic (100%)
- Race & ethnicity
- Hispanic / Latino 100% Two or more races 53%
- Hispanic origin (detail)
- Mexican 100%
- Foreign-born
- 48% · Canada
- Languages at home
- 1% English-only · Spanish 99%
Political lean MEDSL · Yuma
- 2024 margin
- Strong R (+20.4) · D 39.3% · R 59.8%
- 2008→2024 swing
- -6.6pp toward R · 2008: -13.8pp · 2024: -20.4pp
- All cycles
- 2024: R+20.4 2020: R+6.2 2016: R+5.5 2012: R+16.1 2008: R+13.8
Not yet ingested
- Civics
- —
Market trends
- HPI YoY
- ▼ -89.09%
- Current HPI
- 104.3929
- Rent YoY
- —
- Metro
- —
- State GDP YoY
- ▲ 4.54%
- F500 in state
- 20
Industry mix (Fortune 500 HQ in AZ)
| Industry | F500 HQs | Revenue |
|---|---|---|
| Technology | 2 | $13B |
|
||
| Mining / Metals | 1 | $23B |
|
||
| Environmental Services | 1 | $16B |
|
||
| Metals / Steel | 1 | $14B |
|
||
| Technology Distribution | 1 | $9B |
|
||
| Homebuilding | 1 | $8B |
|
||
Price history
+147.5% since first listed4 events — show timeline
- 2026-05-01 Price Changed $148,500 YAR
- 2026-04-15 Price Changed $159,000 YAR
- 2026-04-10 Listed $169,900 YAR
- 2005-07-28 Sold (Public Records) $60,000 Public Records
Property tax history
+3.7%/yrLatest (2025): $664 · +8.3% YoY. Source: county tax records.
Cash-flow waterfall
monthlySold comps — $/sqft
last 12 mo · ≤1 miLoading sold comps…