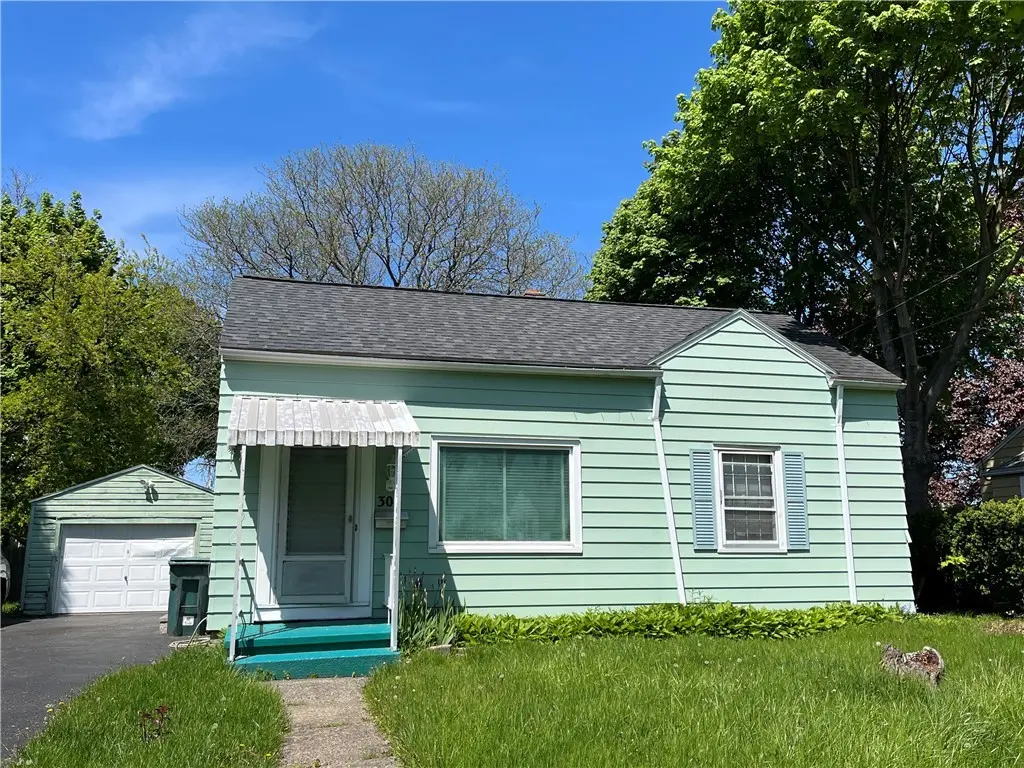
304 Ashwood Dr · Rochester, NY
Flood risk 1/10 · Minimal
- FEMA flood zone
- X (unshaded)
- Chance of flooding over 30 yrs
- 0.0%
- Est. flood insurance / yr
- $473 – $860
Fire risk 1/10 · Minimal
- Est. fire insurance / yr
- $691 – $1,283
Heat risk 2/10 · Minimal
- Hot days now (above 95°F)
- 7 days/yr
- Hot days in 30 yrs
- 15 days/yr
Wind risk 1/10 · Minimal
- Chance of severe wind over 30 yrs
- —
Air-quality risk 2/10 · Minimal
- Unhealthy air days now
- 1 days/yr
- Unhealthy air days in 30 yrs
- 2 days/yr
Risk factors via First Street. Map © Google.
Why this score? — see what drove the B grade
The composite is a weighted blend of 9 inputs, each scored 0–100. Each bar is that input's sub-score; the figure is the points it added to the 100-point composite (weight × sub-score).
- Cash flow +30.0/30.0
- 1% rule +10.0/10.0
- DSCR +10.0/10.0
- ARV discount +7.5/15.0
- Rent growth +4.5/5.0
- Livability +3.8/5.0
- Condition / age +2.5/5.0
- Schools +1.9/10.0
- Appreciation +0.0/10.0
$59,900
🖨 Deal sheet 📄 Offer letter ✓ Due diligence
Listing remarks
CLASSIC THREE BEDROOM CAPE in the HEART of the NORTHLAND-LYCEUM NEIGHBORHOOD with INCREDIBLE WALKABILITY to SCHOOLS, PARKS, SHOPPING, etc! ORIGINAL HARDWOOD FLOORS, BRIGHT & CHEERY EAT-IN KITCHEN, WELL PROPORTIONED LIVING SPACES, LOW MAINTENANCE VINYL SIDING, VINYL REPLACEMENT WINDOWS, DETACHED GARAGE, SPACIOUS FLAT LOT. This home needs some TLC but has SO MUCH POTENTIAL!!! Estate sale - property sold as is. No additional photos will be added ——> as it is best seen in person! * * * * SHOWINGS BEGIN on WED 6/10– OFFERS DUE/DELAYED NEGOTIATIONS on WED 6/17 @ 10:00 AM * * *
Key facts
- Eat-in kitchen
- Walkability to parks
- 7,800 sq ft lot
Tags
Property features AI
Exterior
- Parking: Detached garage; One garage space
- Utilities: Electricity connected; High-speed internet available; Public water connected; Sewer connected
- Home design: Single-story; Resale property; Vinyl siding
- Construction: Vinyl siding construction; Block foundation; Existing (year built details)
- Exterior features: Blacktop driveway; Rectangular residential lot, approximately 60 x 130
Interior
- Kitchen: Eat-in kitchen; Gas water heater (listed under appliances); See remarks for additional kitchen details/appliances
- Bedrooms: Two main-level bedrooms
- Flooring: Hardwood; Laminate; Varies
- Bathrooms: One full bathroom (main level)
- Heating & cooling: Gas forced-air heating
- Interior features: Eat-in kitchen; Separate/formal living room; Natural woodwork; Main level primary; Bedroom on main level; Other (see remarks)
- Laundry & utility: Laundry located in basement
Neighborhood map
What this means for you Summary
Snapshot
- This is a 3-bed/1.0-bath single-family listed at $60k.
Deal economics
- At list price, monthly cash flow is $830 ($10k/yr) — positive.
- The deal already cash-flows at list — no discount required.
- Meets the 1% rule at list price ($2k rent vs $60k).
- Cap rate 22.9% vs local median 9.3% in Rochester — top-decile yield for the area; either an underpriced asset or a hidden risk that comps aren't pricing in. Stress-test before assuming the spread holds.
Location & tenants
- Location reads 76/100 on livability (#222 in NY, #3,482 nationally) — a middle-class / working-renter tenant base. Strengths: commute A+, cost of living A+, housing A+; Watch: schools D+, crime F, employment F.
- Rochester City School District (urban): math 21% / reading 26% proficiency, ranked #589 of 590 in NY (top 100%) — low school quality limits family demand, transient renter base, plan for 1-2y turnover; 82% free/reduced lunch — lower-income household profile, screen leases tightly.
- Market conditions: Rents rising fast (+7.9%/yr); 199 active listings in the ZIP; 34 comparable units currently listed for rent nearby; rentals at typical pace (median 14d on market — plan ~3-4 weeks tenant-placement turnaround); 1,169 units permitted in Monroe County in 2024 (591 in 5+ unit buildings).
Forward outlook
- Local home prices are declining (-3.0%/yr); year-one equity from $414 of loan paydown is wiped out by about $2k of value loss. Plan a longer hold.
- Monroe County population projected to shrink 6% by 2050 — rents likely to lag national; underwrite the cash flow, not the appreciation.
- At projected returns (-3.0% appreciation + 7.9% rent growth), your $17k cash investment doubles in ~2 years — after that, you're playing with house money.
Negotiation context
- Only 10 days on market — expect competitive offers; lowballing is unlikely to land.
Risks & watch-outs
- Watch-outs: built in 1950 — expect roof / HVAC / electrical / plumbing capex.
Questions for the listing agent
- Built in 1950 — when were the roof, HVAC, electrical panel, plumbing, and water heater last replaced?
- Is there a deadline driving the sale (1031 exchange, divorce, estate, relocation)? That informs how much negotiation room exists.
- Schools are D-rated, which usually means shorter tenancies and higher turnover. Who's the typical renter profile here, and what's been the actual vacancy rate?
- Crime grade is F in this area — have there been break-ins, vandalism, or insurance claims at this property in the last 3 years? What carrier currently insures it and at what premium?
- What's the average days-on-market for RENTAL listings here right now (not sales)? A rising rental-DOM trend means longer vacancies and softer asking-rent achievability than the comps imply.
- What's the recent tenant-quality profile in this submarket — average credit score on applications, eviction rate, late-payment / NSF rate, and stable-employment percentage? A property-management company in the area should have these aggregated.
- How much new for-sale + rental construction is in the pipeline within 1–3 miles? Heavy new supply typically softens prices + rents 12–24 months out; constrained supply supports both.
Investment metrics
- 1% rule
- 2.67% ✓
- Cap rate
- 22.91%
- Cash-on-cash
- 59.36%
- DSCR
- 3.64
- GRM
- 3.1
CMA / ARV
- ARV (on-the-fly)
- $168,192
- Comps found
- 12
Show comp detail 12 sales within ~0.75 mi
| Address | Dist | Beds/Ba | Sqft | Sold | Price | $/sf | Match |
|---|---|---|---|---|---|---|---|
| 166 Lyceum St | 0.33mi | 3/1.0 | 1,110 (-4%) | 3mo | $140,000 | $126 | 76 |
| 1824 Clifford Ave | 0.63mi | 3/1.0 | 1,188 (+3%) | 2mo | $62,500 | $53 | 64 |
| 298 Fieldwood Dr | 0.05mi | 4/2.0 (+1) | 1,320 (+15%) | 2mo | $193,000 | $146 | 63 |
| 1822 Clifford Ave | 0.63mi | 3/1.0 | 1,188 (+3%) | 3mo | $95,000 | $80 | 63 |
| 201 Arbutus St | 0.57mi | 4/1.5 (+1) | 1,180 (+2%) | 0mo | $210,000 | $178 | 62 |
| 82 Willmont St | 0.53mi | 2/1.0 (-1) | 1,100 (-4%) | 1mo | $155,000 | $141 | 62 |
| 265 Springfield Ave | 0.52mi | 4/1.5 (+1) | 1,268 (+10%) | 0mo | $200,000 | $158 | 52 |
| 439 Crossfield Rd | 0.45mi | 2/1.0 (-1) | 1,006 (-13%) | 3mo | $145,000 | $144 | 50 |
| 443 Crossfield Rd | 0.46mi | 2/1.0 (-1) | 1,001 (-13%) | 2mo | $165,000 | $165 | 50 |
| 74 Heberle Rd | 0.75mi | 2/1.0 (-1) | 1,065 (-8%) | 2mo | $225,000 | $211 | 46 |
| 93 Willmont St | 0.54mi | 2/2.0 (-1) | 1,022 (-11%) | 2mo | $145,000 | $142 | 45 |
| 23 Martinot Ave | 0.73mi | 3/1.0 | 1,292 (+12%) | 1mo | $255,000 | $197 | 45 |
Match score weights: distance 35% · size 25% · config 20% · recency 20%. Top-matched comps best support the ARV.
Projected returns pro-forma
-3.0% appreciation · 7.89% rent growth · sell at horizon
- IRR
- 63.6%
- Equity multiple
- 4.07×
- Total profit
- $51,440
- Equity at exit
- $8,931
- IRR
- 69.7%
- Equity multiple
- 9.97×
- Total profit
- $150,522
- Equity at exit
- $5,179
Cash invested: $16,772 (down + closing). Projections, not guarantees.
Landlord ↔ Tenant lean methodology
- Overall (STATE)
- 15 Strongly Tenant-Friendly
- State New York
- 15 Strongly Tenant-Friendly · D+10
- County
- — inherits STATE
- City
- — inherits STATE
ZIP-level market 14609
- Home prices YoY
- -30.4%
- Rents YoY
- 7.9%
- Active inventory
- 199
- Price-to-rent
- 3.1×
Monthly cashflow live
- Estimated rent
- $1,601 high interval (Pro) →
- Mortgage (P&I)
- −$314
- Tax from tax record
- −$96 /mo · $1,152/yr
- Insurance
- −$25
- HOA
- −$0
- Vacancy / Maint / Mgmt
- −$336
- Net cashflow
- $830
Break-even live
UW: 25.0% down · 7.5% · 30yr · 1.5% tax · 5.0% vac · 8.0% maint · 8.0% mgmt
Financing live
Cash to close
- Down payment
- $14,975
- Closing costs
- $1,797
- Reserves months
- —
- Total cash needed
- —
Loan-product check · same deal, 3 products live
Conventional
25% down · 7.5% · 30yr
- Down + closing
- —
- Monthly P&I
- —
- Monthly cashflow
- —
- DSCR
- —
- Eligible?
- —
Personal DTI + credit; lowest rate.
DSCR
20% down · 8.5% · 30yr
- Down + closing
- —
- Monthly P&I
- —
- Monthly cashflow
- —
- DSCR
- —
- Eligible?
- —
No personal income docs; deal must DSCR.
Hard money
10% down · 12.0% · 12mo
- Down + closing
- —
- Monthly P&I
- —
- Monthly cashflow
- —
- DSCR
- —
- Eligible?
- —
Short-term bridge; refi at stabilization.
Rent comps 34 comps
| Address | Beds | Baths | Sqft | Rent | $/sqft | DOM | Units | Dist |
|---|---|---|---|---|---|---|---|---|
| 2145 Norton St Rochester, NY | 2.0 | 1.0 | 700 | $902 | $1.29 | 43d | 1 | 0.27mi |
| 326 Northland Ave Rochester, NY | 3.0 | 1.0 | 1168 | $1,500 | $1.28 | 2d | 1 | 0.34mi |
| 36 Charwood Cir Irondequoit, NY | 1.0–2.0 | 1.0–1.5 | 930 | $2,005 | $2.16 | 2d | 9 | 0.37mi |
| 36 Charwood Cir Irondequoit, NY | 2.0 | 1.0–1.5 | 1000 | $1,675 | $1.68 | 43d | 3 | 0.37mi |
| 2362 Culver Rd Irondequoit, NY | 1.0–2.0 | 1.0 | 675 | $1,455 | $2.16 | 2d | 3 | 0.53mi |
| 1890 Clifford Ave Rochester, NY | 3.0 | 1.0 | 936 | $1,800 | $1.92 | 23d | 1 | 0.58mi |
| 2450 Culver Rd Rochester, NY | 3.0 | 1.5 | 1380 | $2,400 | $1.74 | 3d | 1 | 0.61mi |
| 2519 Culver Rd Rochester, NY | 1.0–2.0 | 1.0 | 800 | $1,395 | $1.74 | 10d | 4 | 0.70mi |
| 222 Ellison St Rochester, NY | 2.0 | 1.0 | 971 | $1,000 | $1.03 | 14d | 1 | 0.82mi |
| 50 Harwick Rd Rochester, NY | 1.0–2.0 | 1.0 | 687 | $1,350 | $1.96 | 3d | 3 | 0.84mi |
| — Rochester, NY | 2.0 | 1.0 | 896 | $1,100 | $1.23 | 14d | 1 | 0.84mi |
| 21 Portland Ct Rochester, NY | 2.0 | 1.0 | 850 | $1,210 | $1.42 | 43d | 1 | 0.85mi |
| 86-88 Baycliff Dr Unit 86 Rochester, NY | 2.0 | 1.0 | 900 | $1,030 | $1.14 | 21d | 1 | 0.87mi |
| 32 Portland Pkwy Rochester, NY | 2.0 | 1.0 | 652 | $1,485 | $2.28 | 2d | 8 | 0.89mi |
| 182 Laurelton Rd Unit 182 Rochester, NY | 2.0 | 1.5 | 1000 | $1,600 | $1.60 | 10d | 1 | 0.89mi |
| 47 Priscilla St Rochester, NY | 4.0 | 1.5 | 1250 | $1,900 | $1.52 | 21d | 1 | 0.93mi |
| 95 Onondaga Rd Rochester, NY | 1.0–2.0 | 1.0 | 825 | $1,630 | $1.98 | 2d | 1 | 0.95mi |
| 100 Hulda Park Rochester, NY | 1.0–2.0 | 1.0–1.5 | 3759 | $782 | $0.21 | 21d | 1 | 0.95mi |
| 16 Cummings St Rochester, NY | 2.0 | 1.0 | 782 | $1,250 | $1.60 | 43d | 1 | 0.96mi |
| 16 Cummings St Rochester, NY | 2.0 | 1.0 | 782 | $1,250 | $1.60 | 19d | 1 | 0.96mi |
| 52 Frances St Rochester, NY | 4.0 | 1.0 | 1256 | $1,595 | $1.27 | 43d | 1 | 1.04mi |
| 420 Rosewood Ter Rochester, NY | 3.0 | 1.0 | 1246 | $1,300 | $1.04 | 3d | 1 | 1.09mi |
| 171 Mohawk St Rochester, NY | 3.0 | 2.0 | 1054 | $1,775 | $1.68 | 43d | 1 | 1.11mi |
| 117 Northaven Ter Rochester, NY | 4.0 | 2.0 | 1460 | $1,975 | $1.35 | 10d | 1 | 1.16mi |
| 1159 Culver Rd Unit A2 UP Rochester, NY | 3.0 | 1.0 | 1313 | $1,500 | $1.14 | 43d | 1 | 1.23mi |
| 25 Trust St Rochester, NY | 3.0 | 1.5 | 1003 | $1,600 | $1.60 | 3d | 1 | 1.26mi |
| 459-461 Parsells Ave Rochester, NY | 2.0 | 1.0 | 1053 | $1,450 | $1.38 | 23d | 1 | 1.27mi |
| 127 Carter St #125 Rochester, NY | 2.0 | 1.0 | 1320 | $1,400 | $1.06 | 43d | 1 | 1.30mi |
| 147 5th St Rochester, NY | 4.0 | 1.0 | 1289 | $1,950 | $1.51 | 21d | 1 | 1.31mi |
| 195 Parsells Ave Rochester, NY | 4.0 | 1.0 | 1413 | $1,265 | $0.90 | 3d | 1 | 1.32mi |
| 176 Roycroft Dr Rochester, NY | 3.0 | 1.0 | 1169 | $950 | $0.81 | 10d | 1 | 1.38mi |
| 1196 E Ridge Rd Rochester, NY | 1.0–2.0 | 1.0 | 800 | $1,265 | $1.58 | 23d | 1 | 1.40mi |
| 500 Garson Ave Rochester, NY | 2.0 | 1.0 | 740 | $1,050 | $1.42 | 3d | 1 | 1.43mi |
| 2 Kings Ct Way Rochester, NY | 1.0–2.0 | 1.0–1.5 | 999 | $1,615 | $1.62 | 2d | 8 | 1.47mi |
Listing history 10 events
-
2026-06-18status $59,900 Pending 10 DOM
-
2026-06-18days on market $59,900 Active 10 DOM
-
2026-06-17days on market $59,900 Active 9 DOM
-
2026-06-16days on market $59,900 Active 8 DOM
-
2026-06-15days on market $59,900 Active 7 DOM
-
2026-06-13days on market $59,900 Active 5 DOM
-
2026-06-13days on market $59,900 Active 4 DOM
-
2026-06-10days on market $59,900 Active 2 DOM
-
2026-06-09remarks 585-char remark
-
2026-06-09$59,900 Active 1 DOM
ⓘ Source: listings_history table (triggers on properties + properties_extension) + one-shot
backfill from property_details.listing_events for pre-trigger history.
Tax reassessment forecast NY · Partial reset (capped growth)
- Current annual tax
- $1,152 · $96/mo
- Projected year-2 tax
- $1,152 · $96/mo
- Expected delta
- $0/yr ($0/mo · 0.0%)
ⓘ Screening estimate from a state-policy table — verify with the county assessor before closing.
Climate risk First Street
- Flood 1/10 Low FEMA zone X (unshaded) · 0% chance over 30 yrs
- Wildfire 1/10 Low
- Heat 2/10 Low 7 d/yr ≥95°F today · 15 d/yr by 30 yrs out
- Wind 1/10 Low
- Air quality 2/10 Low 1 unhealthy d/yr today · 2 by 30 yrs out
Nearby sold comps map
Loading sold comps map…
Walkable amenities ~0.75 mi
Loading nearby amenities…
Taxation est. · year 1
- Rental income
- $19,211
- − Mortgage interest
- −$3,355
- − Property taxes
- −$1,152
- − Insurance
- −$300
- − Repairs & maintenance
- −$1,537
- − Management
- −$1,537
- − Depreciation
- −$1,743
- Taxable income
- $9,589
- Est. tax owed @ 24.0%
- −$2,301
- After-tax cash flow
- $7,655/yr
For passive investors: Depreciation is non-cash, so a rental often shows a tax loss while cash-flowing — sheltering income. Rental losses are passive: they offset passive income freely, and up to $25,000/yr can offset ordinary (W-2) income if you actively participate and your MAGI is under $100k (phasing out to $0 by $150k); unused losses carry forward. On sale, claimed depreciation is recaptured at up to 25%, and gains may owe capital-gains tax (a 1031 exchange can defer both). Figures are a year-1 estimate at your 24.0% rate — not tax advice; consult a CPA.
Schools (NCES district)
- District
- Rochester City School District
- NCES district ID
- 3624750
- Math proficiency
- 21% ▬ 0.00%
- Reading proficiency
- 26% ▲ 4.00%
- Median HH income
- $30,923
- Composite
- 18.98/100
- National rank
- #8850
- State rank
- #589 of 590 in NY
Livability — Rochester
- Score
- 76/100
- State rank
- #222
- US rank
- #3482
Category grades
Schools grade is shown separately in the Schools card above.
Census & demographics
- Census place
- Rochester, NY
- County
- Monroe County · 674,131 people
- City population
- 432,803
- Metro
- Rochester, NY
- Population (ZIP)
- 40,274
- Household income
- $64,603
- Rent vs Own
- Severe rent burden
- 2183.0
Population outlook (Monroe County) Hauer SSP2
- Today (2025)
- 759,460 people
- By 2030
- 757,154 · -0.3%
- By 2040
- 740,644 · -2.5%
- By 2050
- 714,443 · -5.9%
- By 2075
- 645,883 · -15.0%
- By 2100
- 547,084 · -28.0%
Race, ethnicity, and origin ACS 2023
- Neighborhood character
- Diverse neighborhood (Simpson 0.69)
- Race & ethnicity
- White 44% Black 28% Hispanic / Latino 20% Two or more races 10% Asian 2%
- Hispanic origin (detail)
- Puerto Rican 15% Cuban 1% Dominican 1%
- Common ancestry
- Romanian 4% Lithuanian 2% Iranian 1%
- Foreign-born
- 8% · Canada
- Languages at home
- 81% English-only · Spanish 14% Russian/Polish/Slavic 2% Other Indo-European 1%
Political lean MEDSL · Monroe
- 2024 margin
- D (+19.1) · D 59.5% · R 40.5%
- 2008→2024 swing
- +1.4pp toward D · 2008: 17.7pp · 2024: 19.1pp
- All cycles
- 2024: D+19.1 2020: D+21.0 2016: D+14.1 2012: D+17.4 2008: D+17.7
Not yet ingested
- Civics
- —
Market trends
- HPI YoY
- ▼ -143.57%
- Current HPI
- 328.7053
- Rent YoY
- ▲ 7.89%
- Metro
- Rochester, NY
- State GDP YoY
- ▲ 2.60%
- F500 in state
- 92
Industry mix (Fortune 500 HQ in NY)
| Industry | F500 HQs | Revenue |
|---|---|---|
| Financial Services | 10 | $950B |
|
||
| Consumer Goods | 9 | $162B |
|
||
| Insurance | 4 | $225B |
|
||
| Telecommunications | 2 | $144B |
|
||
| Pharmaceuticals | 2 | $112B |
|
||
| Media / Entertainment | 2 | $69B |
|
||
Price history
+1.5% since first listed2 events — show timeline
- 2026-06-08 Listed $59,900 UNYREIS
- 2002-12-18 Sold (Public Records) $59,000 Public Records
Property tax history
-5.5%/yrLatest (2025): $1,152 · +101.6% YoY. Source: county tax records.
Cash-flow waterfall
monthlySold comps — $/sqft
last 12 mo · ≤1 miLoading sold comps…