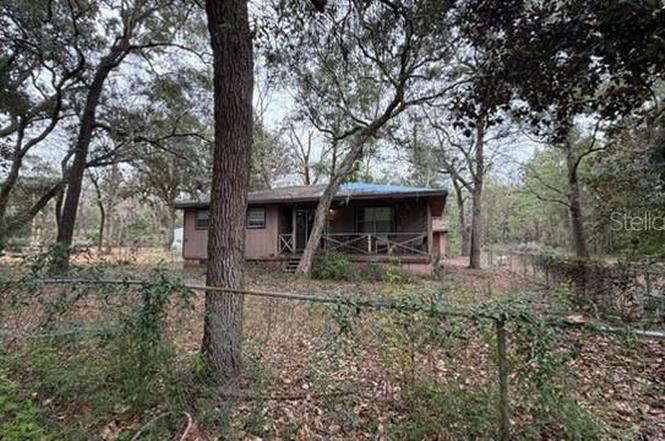
7415 Bernadette Dr · Holley, FL
Flood risk 5/10 · Moderate
- FEMA flood zone
- X (unshaded)
- Chance of flooding over 30 yrs
- 0.24%
- Est. flood insurance / yr
- $507 – $1,088
Fire risk 3/10 · Minor
- Est. fire insurance / yr
- $947 – $1,759
Heat risk 10/10 · Severe
- Hot days now (above 105°F)
- 7 days/yr
- Hot days in 30 yrs
- 22 days/yr
Wind risk 9/10 · Severe
- Chance of severe wind over 30 yrs
- 99.0%
Air-quality risk 2/10 · Minimal
- Unhealthy air days now
- 1 days/yr
- Unhealthy air days in 30 yrs
- 1 days/yr
Risk factors via First Street. Map © Google.
Why this score? — see what drove the B- grade
The composite is a weighted blend of 9 inputs, each scored 0–100. Each bar is that input's sub-score; the figure is the points it added to the 100-point composite (weight × sub-score).
- Cash flow +24.9/30.0
- ARV discount +15.0/15.0
- DSCR +8.1/10.0
- 1% rule +5.9/10.0
- Schools +5.3/10.0
- Rent growth +3.2/5.0
- Livability +3.2/5.0
- Condition / age +2.5/5.0
- Appreciation +0.0/10.0
$195,000
🖨 Deal sheet 📄 Offer letter ✓ Due diligence
Listing remarks MLS
Cabin in the woods with wonderful sunsets over East Bay. Horses allowed here. Plenty of access to East Bay to fish.
Key facts
- One acre of land
- 0.91 acre lot
- Built 1981
Tags
Property features AI
Finance
- Other: Approximately 0.91 acre lot (about 1/2 to less than 1 acre); Road surface: Other; Living area reported as 1,032 (public records)
- Financial info: Annual taxes reported; Property not homestead; No CDD
- HOA & community: No HOA
Exterior
- Parking: No parking details provided
- Security: No security details provided
- Utilities: No water source; Other sewer; Other utilities
- Home design: Single family residence; Residential property; One story; Faces northwest
- Construction: Other construction materials; Other roof; Other foundation
- Exterior features: Other exterior features
Interior
- Kitchen: Other appliances
- Bedrooms: 2 bedrooms
- Flooring: Other flooring
- Bathrooms: 1 full bathroom
- Heating & cooling: Other heating; Other cooling
- Interior features: Other interior features
- Laundry & utility: Laundry features: Other
Neighborhood map
What this means for you Summary
Snapshot
- This is a 2-bed/1.0-bath single-family listed at $195k.
Deal economics
- At list price, monthly cash flow is $420 ($5k/yr) — positive.
- The deal already cash-flows at list — no discount required.
- Meets the 1% rule at list price ($2k rent vs $195k).
- Recommended offer: $172k (12.0% below list) — sets the bar for market timing.
- Cap rate 8.9% vs local median 3.2% in Holley — top-decile yield for the area; either an underpriced asset or a hidden risk that comps aren't pricing in. Stress-test before assuming the spread holds.
Location & tenants
- Location reads 64/100 on livability (#698 in FL) — a middle-class / working-renter tenant base. Strengths: crime A+, housing A+, cost of living B+; Watch: schools F, amenities F, commute F.
- Santa Rosa (suburban): math 63% / reading 60% proficiency, ranked #8 of 73 in FL (top 11%) — acceptable for families but not a draw, mixed tenant base, ~2y average lease.
- Market conditions: Rents rising (+2.7%/yr); 768 active listings in the ZIP; 2 comparable units currently listed for rent nearby; solid renter incomes; 1,983 units permitted in Santa Rosa County in 2024 (128 in 5+ unit buildings).
Forward outlook
- Local home prices are declining (-3.0%/yr); year-one equity from $1k of loan paydown is wiped out by about $6k of value loss. Plan a longer hold.
- Santa Rosa County population projected at +31% by 2050 — long-run rental-demand tailwind backs the buy-and-hold thesis.
Negotiation context
- It's been on market 157 days — a 12% lower offer ($172k) is reasonable based on typical stale-listing flexibility.
- 3 sale attempts since 24y ago; this cycle's ask has dropped $30k (13%) from the opening price — seller is motivated, your offer sets the floor, not the list.
- Current owner paid $64k; list at $195k implies a 207% gain — meaningful room to come down on a strong offer.
Risks & watch-outs
- Climate carrying-cost: moderate flood risk; severe wind risk, 99% chance of damaging wind over 30y; extreme-heat days projected 7→22/yr by 2055 (HVAC capex compounding) — expect insurance premiums to compound above CPI over the hold.
Questions for the listing agent
- It's been on market 157 days. Have you received any prior offers? Is the seller open to a 12% concession, seller financing, or rate buy-down credit?
- Why hasn't it sold? Are there any deal-killer items the seller is aware of (foundation, flood, title, zoning, code violations)?
- Is there a deadline driving the sale (1031 exchange, divorce, estate, relocation)? That informs how much negotiation room exists.
- Schools are F-rated, which usually means shorter tenancies and higher turnover. Who's the typical renter profile here, and what's been the actual vacancy rate?
- What's the average days-on-market for RENTAL listings here right now (not sales)? A rising rental-DOM trend means longer vacancies and softer asking-rent achievability than the comps imply.
- What's the recent tenant-quality profile in this submarket — average credit score on applications, eviction rate, late-payment / NSF rate, and stable-employment percentage? A property-management company in the area should have these aggregated.
- How much new for-sale + rental construction is in the pipeline within 1–3 miles? Heavy new supply typically softens prices + rents 12–24 months out; constrained supply supports both.
Investment metrics
- 1% rule
- 1.09% ✓
- Cap rate
- 8.88%
- Cash-on-cash
- 9.22%
- DSCR
- 1.41
- GRM
- 7.7
CMA / ARV
- ARV (on-the-fly)
- $267,288
- Comps found
- 1
Show comp detail 1 sale within ~0.75 mi
| Address | Dist | Beds/Ba | Sqft | Sold | Price | $/sf | Match |
|---|---|---|---|---|---|---|---|
| 3101 Lynn Dr | 0.08mi | 3/1.0 (+1) | 1,054 (+2%) | 21mo | $273,000 | $259 | 71 |
Match score weights: distance 35% · size 25% · config 20% · recency 20%. Top-matched comps best support the ARV.
Projected returns pro-forma
-3.0% appreciation · 2.74% rent growth · sell at horizon
- IRR
- -2.7%
- Equity multiple
- 0.90×
- Total profit
- $-5,453
- Equity at exit
- $29,075
- IRR
- 6.7%
- Equity multiple
- 1.50×
- Total profit
- $27,304
- Equity at exit
- $16,860
Cash invested: $54,600 (down + closing). Projections, not guarantees.
Landlord ↔ Tenant lean methodology
- Overall (STATE)
- 87 Strongly Landlord-Friendly
- State Florida
- 87 Strongly Landlord-Friendly · R+3
- County
- — inherits STATE
- City
- — inherits STATE
ZIP-level market 32566
- Home prices YoY
- -26.2%
- Rents YoY
- 2.7%
- Active inventory
- 768
- Price-to-rent
- 7.7×
Monthly cashflow live
- Estimated rent
- $2,119 medium interval (Pro) →
- Mortgage (P&I)
- −$1,023
- Tax from tax record
- −$151 /mo · $1,811/yr
- Insurance
- −$81
- HOA
- −$0
- Vacancy / Maint / Mgmt
- −$445
- Net cashflow
- $420
Break-even live
UW: 25.0% down · 7.5% · 30yr · 1.5% tax · 5.0% vac · 8.0% maint · 8.0% mgmt
Financing live
Cash to close
- Down payment
- $48,750
- Closing costs
- $5,850
- Reserves months
- —
- Total cash needed
- —
Loan-product check · same deal, 3 products live
Conventional
25% down · 7.5% · 30yr
- Down + closing
- —
- Monthly P&I
- —
- Monthly cashflow
- —
- DSCR
- —
- Eligible?
- —
Personal DTI + credit; lowest rate.
DSCR
20% down · 8.5% · 30yr
- Down + closing
- —
- Monthly P&I
- —
- Monthly cashflow
- —
- DSCR
- —
- Eligible?
- —
No personal income docs; deal must DSCR.
Hard money
10% down · 12.0% · 12mo
- Down + closing
- —
- Monthly P&I
- —
- Monthly cashflow
- —
- DSCR
- —
- Eligible?
- —
Short-term bridge; refi at stabilization.
Rent comps 2 comps
| Address | Beds | Baths | Sqft | Rent | $/sqft | DOM | Units | Dist |
|---|---|---|---|---|---|---|---|---|
| 3661 London Rd Navarre, FL | 3.0 | 2.0 | 1304 | $1,950 | $1.50 | 23d | 1 | 1.28mi |
| 2634 Hidden Estates Cir Navarre, FL | 3.0 | 2.0 | 1463 | $2,200 | $1.50 | 13d | 1 | 1.34mi |
Listing history 29 events
-
2026-06-18days on market $195,000 Active 157 DOM
-
2026-06-17days on market $195,000 Active 156 DOM
-
2026-06-16days on market $195,000 Active 155 DOM
-
2026-06-15days on market $195,000 Active 154 DOM
-
2026-06-14days on market $195,000 Active 152 DOM
-
2026-06-10days on market $195,000 Active 149 DOM
-
2026-06-09days on market $195,000 Active 148 DOM
-
2026-06-08days on market $195,000 Active 147 DOM
-
2026-06-07days on market $195,000 Active 146 DOM
-
2026-06-05days on market $195,000 Active 143 DOM
-
2026-06-03days on market $195,000 Active 142 DOM
-
2026-06-02days on market $195,000 Active 141 DOM
-
2026-06-01days on market $195,000 Active 140 DOM
-
2026-05-31days on market $195,000 Active 139 DOM
-
2026-05-31days on market $195,000 Active 138 DOM
-
2026-03-09price $195,000
-
2026-02-10price $205,000
-
2026-01-19price $213,000
-
2026-01-12$225,000 Active
-
2002-07-23soldstatus $63,600
-
2002-07-16soldstatus $63,600 115-char remark
Show marketing remark (188 chars)
BACK ON THE MARKET/CABIN IN THE WOODS EAST BAY VU**HORSES ALLOWED HERE. PLENTY OF ACCESS TO EAST BAY TO FISH. THIS LOAN IS ASSUMABLE VA WITH QUALIFIED BUYER. BANK PAYS MOST CLOSING COSTS.
-
2002-07-16soldstatus $63,600 188-char remark
Show marketing remark (188 chars)
BACK ON THE MARKET/CABIN IN THE WOODS EAST BAY VU**HORSES ALLOWED HERE. PLENTY OF ACCESS TO EAST BAY TO FISH. THIS LOAN IS ASSUMABLE VA WITH QUALIFIED BUYER. BANK PAYS MOST CLOSING COSTS.
-
2002-03-27$68,000 115-char remark
Show marketing remark (188 chars)
BACK ON THE MARKET/CABIN IN THE WOODS EAST BAY VU**HORSES ALLOWED HERE. PLENTY OF ACCESS TO EAST BAY TO FISH. THIS LOAN IS ASSUMABLE VA WITH QUALIFIED BUYER. BANK PAYS MOST CLOSING COSTS.
-
2002-03-27$68,000 188-char remark
Show marketing remark (188 chars)
BACK ON THE MARKET/CABIN IN THE WOODS EAST BAY VU**HORSES ALLOWED HERE. PLENTY OF ACCESS TO EAST BAY TO FISH. THIS LOAN IS ASSUMABLE VA WITH QUALIFIED BUYER. BANK PAYS MOST CLOSING COSTS.
-
2001-06-26soldstatus $70,000
-
1996-08-05soldstatus $50,000
-
1996-08-05soldstatus $50,000
-
1986-12-01soldstatus $30,000
-
1984-10-01soldstatus $42,800
ⓘ Source: listings_history table (triggers on properties + properties_extension) + one-shot
backfill from property_details.listing_events for pre-trigger history.
Tax reassessment forecast FL · Resets to sale price
- Current annual tax
- $1,811 · $151/mo
- Projected year-2 tax
- $1,811 · $151/mo
- Expected delta
- $0/yr ($0/mo · 0.0%)
ⓘ Screening estimate from a state-policy table — verify with the county assessor before closing.
Climate risk First Street
- Flood 5/10 Major FEMA zone X (unshaded) · 24% chance over 30 yrs
- Wildfire 3/10 Moderate
- Heat 10/10 Extreme 7 d/yr ≥105°F today · 22 d/yr by 30 yrs out
- Wind 9/10 Extreme 99% chance of damaging wind over 30 yrs
- Air quality 2/10 Low 1 unhealthy d/yr today · 1 by 30 yrs out
Nearby sold comps map
Loading sold comps map…
Walkable amenities ~0.75 mi
Loading nearby amenities…
Taxation est. · year 1
- Rental income
- $25,433
- − Mortgage interest
- −$10,923
- − Property taxes
- −$1,811
- − Insurance
- −$975
- − Repairs & maintenance
- −$2,035
- − Management
- −$2,035
- − Depreciation
- −$5,673
- Taxable income
- $1,982
- Est. tax owed @ 24.0%
- −$476
- After-tax cash flow
- $4,559/yr
For passive investors: Depreciation is non-cash, so a rental often shows a tax loss while cash-flowing — sheltering income. Rental losses are passive: they offset passive income freely, and up to $25,000/yr can offset ordinary (W-2) income if you actively participate and your MAGI is under $100k (phasing out to $0 by $150k); unused losses carry forward. On sale, claimed depreciation is recaptured at up to 25%, and gains may owe capital-gains tax (a 1031 exchange can defer both). Figures are a year-1 estimate at your 24.0% rate — not tax advice; consult a CPA.
Schools (NCES district)
- District
- Santa Rosa
- NCES district ID
- 1201650
- Math proficiency
- 63% ▼ -6.00%
- Reading proficiency
- 60% ▼ -5.00%
- Median HH income
- $58,161
- Composite
- 53.12/100
- National rank
- #1511
- State rank
- #8 of 73 in FL
Livability — Holley
- Score
- 64/100
- State rank
- #698
- US rank
- #14641
Category grades
Schools grade is shown separately in the Schools card above.
Census & demographics
- Census place
- Holley, FL
- County
- Santa Rosa County · 194,764 people
- Metro
- Pensacola-Ferry Pass-Brent, FL
- Population (ZIP)
- 43,883
- Household income
- $105,551
- Rent vs Own
- Severe rent burden
- 608.0
Population outlook (Santa Rosa County) Hauer SSP2
- Today (2025)
- 195,978 people
- By 2030
- 209,782 · +7.0%
- By 2040
- 235,293 · +20.1%
- By 2050
- 256,408 · +30.8%
- By 2075
- 298,074 · +52.1%
- By 2100
- 303,216 · +54.7%
Race, ethnicity, and origin ACS 2023
- Neighborhood character
- Predominantly White (75%)
- Race & ethnicity
- White 75% Two or more races 9% Hispanic / Latino 9% Black 6% Asian 3%
- Hispanic origin (detail)
- Mexican 3% Puerto Rican 2%
- Common ancestry
- Scotch-Irish 3% Lithuanian 3% Romanian 2%
- Foreign-born
- 6% · Canada, Jamaica, Vietnam
- Languages at home
- 92% English-only · Spanish 4% German/W. Germanic 1% Tagalog/Filipino 1%
Political lean MEDSL · Santa Rosa
- 2024 margin
- Solid R (+51.0) · D 24.1% · R 75.0%
- 2008→2024 swing
- -3.0pp toward R · 2008: -47.9pp · 2024: -51.0pp
- All cycles
- 2024: R+51.0 2020: R+46.5 2016: R+53.5 2012: R+52.6 2008: R+47.9
Not yet ingested
- Civics
- —
Market trends
- HPI YoY
- ▼ -105.87%
- Current HPI
- 298.6821
- Rent YoY
- ▲ 2.74%
- Metro
- Pensacola-Ferry Pass-Brent, FL
- State GDP YoY
- ▲ 3.28%
- F500 in state
- 36
Industry mix (Fortune 500 HQ in FL)
| Industry | F500 HQs | Revenue |
|---|---|---|
| Industrial Technology | 2 | $29B |
|
||
| Insurance | 2 | $17B |
|
||
| Retail | 1 | $60B |
|
||
| Technology Distribution | 1 | $58B |
|
||
| Homebuilding | 1 | $35B |
|
||
| Technology Manufacturing | 1 | $35B |
|
||
Price history
+355.6% since first listed14 events — show timeline
- 2026-03-09 Price Changed $195,000 Stellar MLS as Distributed by MLS Grid
- 2026-02-10 Price Changed $205,000 Stellar MLS as Distributed by MLS Grid
- 2026-01-19 Price Changed $213,000 Stellar MLS as Distributed by MLS Grid
- 2026-01-12 Listed $225,000 Stellar MLS as Distributed by MLS Grid
- 2002-07-23 Sold (Public Records) $63,600 Public Records
- 2002-07-16 Sold (MLS) $63,600 PARMLS
- 2002-07-16 Sold (MLS) $63,600 NAMLS
- 2002-03-27 Listed $68,000 PARMLS
- 2002-03-27 Listed $68,000 NAMLS
- 2001-06-26 Sold (Public Records) $70,000 Public Records
- 1996-08-05 Sold (Public Records) $50,000 Public Records
- 1996-08-05 Sold (Public Records) $50,000 Public Records
- 1986-12-01 Sold (Public Records) $30,000 Public Records
- 1984-10-01 Sold (Public Records) $42,800 Public Records
Property tax history
+4.4%/yrLatest (2025): $1,811 · +7.9% YoY. Source: county tax records.
Cash-flow waterfall
monthlySold comps — $/sqft
last 12 mo · ≤1 miLoading sold comps…