7880 54th Ave N #38 · West Lealman, FL
Flood risk 7/10 · Major
- FEMA flood zone
- X (shaded)
- Chance of flooding over 30 yrs
- 0.9%
- Est. flood insurance / yr
- $507 – $1,088
Fire risk 1/10 · Minimal
- Est. fire insurance / yr
- $947 – $1,759
Heat risk 10/10 · Severe
- Hot days now (above 107°F)
- 7 days/yr
- Hot days in 30 yrs
- 24 days/yr
Wind risk 10/10 · Severe
- Chance of severe wind over 30 yrs
- 99.0%
Air-quality risk 4/10 · Minor
- Unhealthy air days now
- 4 days/yr
- Unhealthy air days in 30 yrs
- 4 days/yr
Risk factors via First Street. Map © Google.
Why this score? — see what drove the D+ grade
The composite is a weighted blend of 9 inputs, each scored 0–100. Each bar is that input's sub-score; the figure is the points it added to the 100-point composite (weight × sub-score).
- Cash flow +18.9/30.0
- 1% rule +6.9/10.0
- DSCR +6.0/10.0
- Schools +4.3/10.0
- Livability +4.0/5.0
- Rent growth +2.7/5.0
- Condition / age +2.5/5.0
- ARV discount +0.0/15.0
- Appreciation +0.0/10.0
$155,000
🖨 Deal sheet 📄 Offer letter ✓ Due diligence
Listing remarks
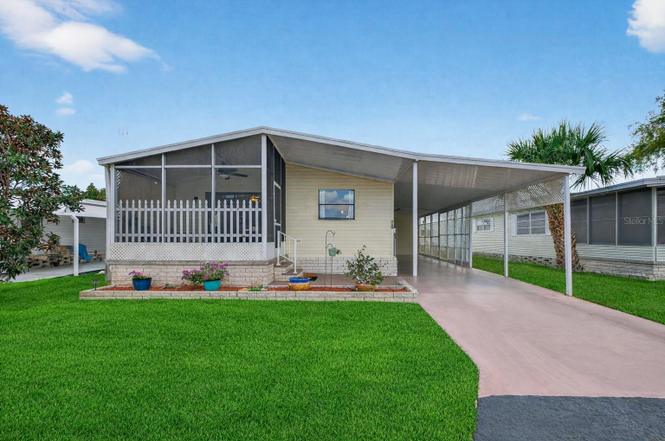
Welcome to relaxed, low-maintenance living in the highly sought-after 55+ community of Club Chalet—a centrally located community featuring comfort, convenience, and outstanding value just minutes from everything you love about Florida living. This inviting 2-bedroom, 2-bath residence with 1,056 square feet of living space is thoughtfully designed to maximize space, storage, and natural light throughout. Vaulted ceilings create an open and airy atmosphere throughout the main living areas, while newer flooring adds a fresh, modern feel and enhances everyday comfort. Large windows allow sunlight to fill the home, creating a bright and welcoming environment from morning through evening. T
Key facts
- Screened patio
- Large laundry room
- Heated swimming pool
Tags
Property features AI
Finance
- Other: Property type: Residential (manufactured home); Lot size approximately 17.85 acres (10 to less than 20 acres); Zoning R-6; Partially furnished; Living area listed as 1,056 (public records); total building area listed as 1,908; Universal property ID available
- HOA & community: Club Chalet - Sandy Miller association (monthly fee $272); Association amenities include clubhouse, pool, shuffleboard court; Association fee covers pool, grounds maintenance, recreational facilities; Association fee required; Senior community; Pets not allowed; Community features include owned association recreation and playground
Exterior
- Parking: Covered parking; Driveway; Off-street parking; Carport with 3 spaces
- Utilities: Public water; Public sewer; Electricity available and connected
- Home design: Manufactured double-wide home; One story; Entry faces east
- Construction: Metal frame with vinyl siding; Metal roof; Stilt / on piling foundation; Built as a manufactured home (double wide)
- Exterior features: Outdoor lighting; Other exterior features
Interior
- Kitchen: Dishwasher; Range; Range hood; Microwave; Refrigerator; Electric water heater
- Bedrooms: 2 bedrooms
- Flooring: Carpet; Ceramic tile; Laminate
- Bathrooms: 2 full bathrooms
- Heating & cooling: Central heating (electric); Central air conditioning
- Interior features: Ceiling fans; High ceilings; Open floorplan with living/dining combo; Thermostat; Vaulted ceilings; Walk-in closets
- Laundry & utility: Laundry room; Washer; Dryer
Neighborhood map
What this means for you Summary
Snapshot
- This is a 2-bed/2.0-bath manufactured listed at $155k.
Deal economics
- At list price, monthly cash flow is $93 ($1k/yr) — positive.
- The deal already cash-flows at list — no discount required.
- Meets the 1% rule at list price ($2k rent vs $155k).
- Recommended offer: $141k (9.0% below list) — sets the bar for market timing.
- Cap rate 7.5% vs local median 1.8% in West Lealman — top-decile yield for the area; either an underpriced asset or a hidden risk that comps aren't pricing in. Stress-test before assuming the spread holds.
Location & tenants
- Location reads 81/100 on livability (#84 in FL, #1,396 nationally) — a professional / high-income tenant draw. Strengths: commute A+, cost of living A+, housing A+; Watch: schools C-, employment D+, amenities F.
- Pinellas (suburban): math 51% / reading 51% proficiency, ranked #31 of 73 in FL (top 42%) — acceptable for families but not a draw, mixed tenant base, ~2y average lease.
- Market conditions: Rents flat; 309 active listings in the ZIP; 33 comparable units currently listed for rent nearby; rentals at typical pace (median 22d on market — plan ~3-4 weeks tenant-placement turnaround); 2,676 units permitted in Pinellas County in 2024 (1,422 in 5+ unit buildings).
- This rent runs 41% of the median local income ($54k/yr) — at the standard rent-burdened threshold; future hikes will face affordability resistance.
Forward outlook
- Local home prices are declining (-3.0%/yr); year-one equity from $1k of loan paydown is wiped out by about $5k of value loss. Plan a longer hold.
- Pinellas County population projected at +14% by 2050 — modest demand growth; plan on rents tracking national, not racing it.
Negotiation context
- It's been on market 119 days — a 9% lower offer ($141k) is reasonable based on typical stale-listing flexibility.
- Current owner paid $78k; list at $155k implies a 99% gain — meaningful room to come down on a strong offer.
Risks & watch-outs
- Watch-outs: flood insurance adds $66/mo.
- Climate carrying-cost: major flood risk; severe wind risk, 99% chance of damaging wind over 30y; extreme-heat days projected 7→24/yr by 2055 (HVAC capex compounding) — expect insurance premiums to compound above CPI over the hold.
Questions for the listing agent
- It's been on market 119 days. Have you received any prior offers? Is the seller open to a 9% concession, seller financing, or rate buy-down credit?
- What's the actual annual flood-insurance premium (NFIP or private), and is the property in a SFHA with mandatory coverage?
- What does the HOA fee cover, when was the last increase, and are there any pending special assessments or reserve-fund shortfalls?
- Why hasn't it sold? Are there any deal-killer items the seller is aware of (foundation, flood, title, zoning, code violations)?
- Is there a deadline driving the sale (1031 exchange, divorce, estate, relocation)? That informs how much negotiation room exists.
- The area grade is low — what's the realistic commute time and amenity access for the typical tenant pool here? Any planned neighborhood developments (good or bad) we should know about?
- What's the average days-on-market for RENTAL listings here right now (not sales)? A rising rental-DOM trend means longer vacancies and softer asking-rent achievability than the comps imply.
- What's the recent tenant-quality profile in this submarket — average credit score on applications, eviction rate, late-payment / NSF rate, and stable-employment percentage? A property-management company in the area should have these aggregated.
- How much new for-sale + rental construction is in the pipeline within 1–3 miles? Heavy new supply typically softens prices + rents 12–24 months out; constrained supply supports both.
Investment metrics
- 1% rule
- 1.19% ✓
- Cap rate
- 7.53%
- Cash-on-cash
- 4.40%
- DSCR
- 1.20
- GRM
- 7.0
CMA / ARV
- ARV (on-the-fly)
- $104,544
- Comps found
- 4
Show comp detail 4 sales within ~0.75 mi
| Address | Dist | Beds/Ba | Sqft | Sold | Price | $/sf | Match |
|---|---|---|---|---|---|---|---|
| 5254 Yellow Pine St N | 0.05mi | 3/1.5 (+1) | 1,056 (0%) | 11mo | $149,000 | $141 | 81 |
| 7777 46th Ave N #36 | 0.39mi | 2/2.0 | 960 (-9%) | 1mo | $50,000 | $52 | 66 |
| 7777 46th Ave N #33 | 0.39mi | 2/2.0 | 960 (-9%) | 6mo | $95,000 | $99 | 62 |
| 5131 81st St N | 0.33mi | 2/2.0 | 960 (-9%) | 20mo | $85,000 | $89 | 53 |
Match score weights: distance 35% · size 25% · config 20% · recency 20%. Top-matched comps best support the ARV.
Projected returns pro-forma
-3.0% appreciation · 0.99% rent growth · sell at horizon
- IRR
- -15.0%
- Equity multiple
- 0.48×
- Total profit
- $-22,664
- Equity at exit
- $23,111
- IRR
- -11.0%
- Equity multiple
- 0.41×
- Total profit
- $-25,720
- Equity at exit
- $13,402
Cash invested: $43,400 (down + closing). Projections, not guarantees.
Landlord ↔ Tenant lean methodology
- Overall (STATE)
- 87 Strongly Landlord-Friendly
- State Florida
- 87 Strongly Landlord-Friendly · R+3
- County
- — inherits STATE
- City
- — inherits STATE
ZIP-level market 33709
- Rents YoY
- 1.0%
- Active inventory
- 309
- Price-to-rent
- 7.0×
Monthly cashflow live
- Estimated rent
- $1,848 high interval (Pro) →
- Mortgage (P&I)
- −$813
- Tax from tax record
- −$152 /mo · $1,819/yr
- Insurance
- −$65
- Flood insurance flood zone
- −$66 /mo · $798/yr
- HOA
- −$272
- Vacancy / Maint / Mgmt
- −$388
- Net cashflow
- $93
Break-even live
UW: 25.0% down · 7.5% · 30yr · 1.5% tax · 5.0% vac · 8.0% maint · 8.0% mgmt
Financing live
Cash to close
- Down payment
- $38,750
- Closing costs
- $4,650
- Reserves months
- —
- Total cash needed
- —
Loan-product check · same deal, 3 products live
Conventional
25% down · 7.5% · 30yr
- Down + closing
- —
- Monthly P&I
- —
- Monthly cashflow
- —
- DSCR
- —
- Eligible?
- —
Personal DTI + credit; lowest rate.
DSCR
20% down · 8.5% · 30yr
- Down + closing
- —
- Monthly P&I
- —
- Monthly cashflow
- —
- DSCR
- —
- Eligible?
- —
No personal income docs; deal must DSCR.
Hard money
10% down · 12.0% · 12mo
- Down + closing
- —
- Monthly P&I
- —
- Monthly cashflow
- —
- DSCR
- —
- Eligible?
- —
Short-term bridge; refi at stabilization.
Rent comps 33 comps
| Address | Beds | Baths | Sqft | Rent | $/sqft | DOM | Units | Dist |
|---|---|---|---|---|---|---|---|---|
| 5521 80th St N #312 Saint Petersburg, FL | 1.0 | 1.0 | 1055 | $1,500 | $1.42 | 4d | 1 | 0.22mi |
| 5357 81st St N #14 Saint Petersburg, FL | 2.0 | 2.0 | 1110 | $1,550 | $1.40 | 24d | 1 | 0.25mi |
| 5287 81st St N #26 Saint Petersburg, FL | 2.0 | 2.0 | 1010 | $1,500 | $1.49 | 4d | 1 | 0.26mi |
| 5217 81st St N #22 Saint Petersburg, FL | 2.0 | 1.0 | 1010 | $1,700 | $1.68 | 24d | 1 | 0.27mi |
| 5530 80th St N Unit C204 Saint Petersburg, FL | 1.0 | 1.0 | 880 | $1,450 | $1.65 | 24d | 1 | 0.31mi |
| 5725 80th St N #210 Saint Petersburg, FL | 2.0 | 2.0 | 1125 | $1,900 | $1.69 | 24d | 1 | 0.35mi |
| 4653 78th Ln N St Petersburg, FL | 3.0 | 2.0 | 1312 | $2,695 | $2.05 | 24d | 1 | 0.39mi |
| 5257 81st Ln N #6 Saint Petersburg, FL | 1.0 | 1.0 | 745 | $1,375 | $1.85 | 24d | 1 | 0.40mi |
| 5750 80th St N St Petersburg, FL | 1.0–2.0 | 1.0–1.5 | 987 | $1,800 | $1.82 | 24d | 2 | 0.40mi |
| 8002 48th Ave N Saint Petersburg, FL | 1.0 | 1.0 | 1050 | $2,000 | $1.90 | 2d | 1 | 0.41mi |
| 5980 80th St N #205 St Petersburg, FL | 2.0 | 2.0 | 1100 | $1,950 | $1.77 | 4d | 1 | 0.45mi |
| 7249 Parkside Villas Dr N Saint Petersburg, FL | 2.0 | 2.0 | 956 | $1,950 | $2.04 | 24d | 1 | 0.46mi |
| 7238 55th Ave N Saint Petersburg, FL | 2.0 | 2.0 | 1085 | $1,899 | $1.75 | 17d | 1 | 0.48mi |
| 4930 72nd St N Saint Petersburg, FL | 2.0 | 1.0 | 1352 | $1,950 | $1.44 | 4d | 1 | 0.49mi |
| 7140 55th Ave N Saint Petersburg, FL | 3.0 | 2.0 | 1085 | $2,000 | $1.84 | 21d | 1 | 0.56mi |
| 4801 71st St N Saint Petersburg, FL | 2.0 | 1.0 | 726 | $1,900 | $2.62 | 4d | 1 | 0.65mi |
| 4801 71st St N St Petersburg, FL | 2.0 | 1.0 | 726 | $1,900 | $2.62 | 17d | 1 | 0.65mi |
| 5410 70th Way N Saint Petersburg, FL | 3.0 | 1.0 | 1160 | $2,100 | $1.81 | 3d | 1 | 0.66mi |
| 5410 70th Way N Saint Petersburg, FL | 3.0 | 1.0 | 1354 | $2,100 | $1.55 | 3d | 1 | 0.66mi |
| 4711 Sunnydale Ln N Unit A St. Petersburg, FL | 2.0 | 1.0 | 800 | $1,750 | $2.19 | 24d | 1 | 0.80mi |
| 5136 68th St N Unit C St. Petersburg, FL | 2.0 | 1.0 | 957 | $1,700 | $1.78 | 4d | 1 | 0.81mi |
| 5136 68th St N Unit B St. Petersburg, FL | 3.0 | 1.0 | 1302 | $1,900 | $1.46 | 4d | 1 | 0.81mi |
| 6366 71st St N Pinellas Park, FL | 2.0 | 2.0 | 970 | $2,200 | $2.27 | 24d | 1 | 0.85mi |
| 6468 Bonnie Bay Cir N Pinellas Park, FL | 2.0 | 2.0 | 970 | $1,800 | $1.86 | 13d | 1 | 0.85mi |
| 4701 68th St N Saint Petersburg, FL | 1.0 | 1.0 | 700 | $1,099 | $1.57 | 24d | 1 | 0.90mi |
| 6398 Woodland Blvd Unit 1366035P Pinellas Park, FL | 3.0 | 2.0 | 1367 | $5,922 | $4.33 | 16d | 1 | 0.91mi |
| 3855 39th Ave N St Petersburg, FL | 2.0 | 2.5 | 1100 | $1,850 | $1.68 | 21d | 1 | 0.94mi |
| 4390 68th St N Saint Petersburg, FL | 3.0 | 1.0 | 864 | $1,950 | $2.26 | 24d | 1 | 0.95mi |
| 3451 79th St N Saint Petersburg, FL | 2.0 | 2.0 | 1150 | $2,500 | $2.17 | 24d | 1 | 1.16mi |
| 6522 54th Ave N Saint Petersburg, FL | 1.0–3.0 | 1.0–2.0 | 892 | $1,600 | $1.79 | 1d | 10 | 1.16mi |
| 3501 Boca Ciega Dr N Saint Petersburg, FL | 2.0 | 2.0 | 1144 | $3,400 | $2.97 | 4d | 1 | 1.18mi |
| 6524 54th Ave N Unit 2 St. Petersburg, FL | 2.0 | 1.0 | 840 | $1,360 | $1.62 | 24d | 1 | 1.18mi |
| 9071 47th Ave N St. Petersburg, FL | 2.0 | 2.0 | 1100 | $2,000 | $1.82 | 24d | 1 | 1.31mi |
HOA detail
- Monthly dues
- $272 · $3,264/yr
Listing history 17 events
-
2026-06-18days on market $155,000 Active 119 DOM
-
2026-06-17days on market $155,000 Active 118 DOM
-
2026-06-16days on market $155,000 Active 117 DOM
-
2026-06-15days on market $155,000 Active 116 DOM
-
2026-06-13pricedays on market $155,000 Active 114 DOM
-
2026-06-09days on market $159,000 Active 110 DOM
-
2026-06-08days on market $159,000 Active 109 DOM
-
2026-06-07days on market $159,000 Active 108 DOM
-
2026-06-04days on market $159,000 Active 105 DOM
-
2026-06-03days on market $159,000 Active 104 DOM
-
2026-06-01days on market $159,000 Active 102 DOM
-
2026-05-31days on market $159,000 Active 101 DOM
-
2026-05-19price $159,000
-
2026-03-31price $165,000
-
2026-02-19$175,000 Active
-
2005-07-01soldstatus $78,000
-
1999-12-01soldstatus $17,000
ⓘ Source: listings_history table (triggers on properties + properties_extension) + one-shot
backfill from property_details.listing_events for pre-trigger history.
Tax reassessment forecast FL · Resets to sale price
- Current annual tax
- $1,819 · $152/mo
- Projected year-2 tax
- $1,819 · $152/mo
- Expected delta
- $0/yr ($0/mo · 0.0%)
ⓘ Screening estimate from a state-policy table — verify with the county assessor before closing.
Climate risk First Street
- Flood 7/10 Severe FEMA zone X (shaded) · 90% chance over 30 yrs
- Wildfire 1/10 Low
- Heat 10/10 Extreme 7 d/yr ≥107°F today · 24 d/yr by 30 yrs out
- Wind 10/10 Extreme 99% chance of damaging wind over 30 yrs
- Air quality 4/10 Moderate 4 unhealthy d/yr today · 4 by 30 yrs out
Nearby sold comps map
Loading sold comps map…
Walkable amenities ~0.75 mi
Loading nearby amenities…
Taxation est. · year 1
- Rental income
- $22,181
- − Mortgage interest
- −$8,682
- − Property taxes
- −$1,819
- − Insurance
- −$1,572
- − Repairs & maintenance
- −$1,774
- − Management
- −$1,774
- − HOA
- −$3,264
- − Depreciation
- −$4,509
- Taxable loss
- −$1,215
- Est. tax savings @ 24.0%
- +$292
- After-tax cash flow
- $1,405/yr
For passive investors: Depreciation is non-cash, so a rental often shows a tax loss while cash-flowing — sheltering income. Rental losses are passive: they offset passive income freely, and up to $25,000/yr can offset ordinary (W-2) income if you actively participate and your MAGI is under $100k (phasing out to $0 by $150k); unused losses carry forward. On sale, claimed depreciation is recaptured at up to 25%, and gains may owe capital-gains tax (a 1031 exchange can defer both). Figures are a year-1 estimate at your 24.0% rate — not tax advice; consult a CPA.
Schools (NCES district)
- District
- Pinellas
- NCES district ID
- 1201560
- Math proficiency
- 51% ▼ -5.00%
- Reading proficiency
- 51% ▼ -3.00%
- Median HH income
- $46,270
- Composite
- 43.27/100
- National rank
- #3046
- State rank
- #31 of 73 in FL
Livability — West Lealman
- Score
- 81/100
- State rank
- #84
- US rank
- #1396
Category grades
Schools grade is shown separately in the Schools card above.
Census & demographics
- Census place
- West Lealman, FL
- County
- Pinellas County · 939,478 people
- Metro
- Tampa-St. Petersburg-Clearwater, FL
- Population (ZIP)
- 25,050
- Household income
- $53,501
- Rent vs Own
- Severe rent burden
- 712.0
Population outlook (Pinellas County) Hauer SSP2
- Today (2025)
- 1,027,532 people
- By 2030
- 1,063,586 · +3.5%
- By 2040
- 1,125,020 · +9.5%
- By 2050
- 1,168,637 · +13.7%
- By 2075
- 1,265,188 · +23.1%
- By 2100
- 1,260,357 · +22.7%
Race, ethnicity, and origin ACS 2023
- Neighborhood character
- Predominantly White (73%)
- Race & ethnicity
- White 73% Hispanic / Latino 11% Two or more races 10% Black 5% Asian 5%
- Hispanic origin (detail)
- Mexican 2% Puerto Rican 3% Cuban 2% Dominican 1%
- Common ancestry
- Lithuanian 3% Romanian 3% Slovak 2%
- Foreign-born
- 14% · Canada, Vietnam, Jamaica
- Languages at home
- 84% English-only · Spanish 9% Other Indo-European 2% Vietnamese 2%
Political lean MEDSL · Pinellas
- 2024 margin
- Lean R (+5.2) · D 46.9% · R 52.1%
- 2008→2024 swing
- -13.5pp toward R · 2008: 8.3pp · 2024: -5.2pp
- All cycles
- 2024: R+5.2 2020: D+0.2 2016: R+1.1 2012: D+5.6 2008: D+8.3
Not yet ingested
- Civics
- —
Market trends
- HPI YoY
- ▼ -416.74%
- Current HPI
- 391.368
- Rent YoY
- ▲ 0.99%
- Metro
- Tampa-St. Petersburg-Clearwater, FL
- State GDP YoY
- ▲ 3.28%
- F500 in state
- 36
Industry mix (Fortune 500 HQ in FL)
| Industry | F500 HQs | Revenue |
|---|---|---|
| Industrial Technology | 2 | $29B |
|
||
| Insurance | 2 | $17B |
|
||
| Retail | 1 | $60B |
|
||
| Technology Distribution | 1 | $58B |
|
||
| Homebuilding | 1 | $35B |
|
||
| Technology Manufacturing | 1 | $35B |
|
||
Price history
+835.3% since first listed5 events — show timeline
- 2026-05-19 Price Changed $159,000 Stellar MLS as Distributed by MLS Grid
- 2026-03-31 Price Changed $165,000 Stellar MLS as Distributed by MLS Grid
- 2026-02-19 Listed $175,000 Stellar MLS as Distributed by MLS Grid
- 2005-07-01 Sold (Public Records) $78,000 Public Records
- 1999-12-01 Sold (Public Records) $17,000 Public Records
Property tax history
+2.7%/yrLatest (2025): $1,819 · +165.0% YoY. Source: county tax records.
Cash-flow waterfall
monthlySold comps — $/sqft
last 12 mo · ≤1 miLoading sold comps…