 🏗️ New Construction
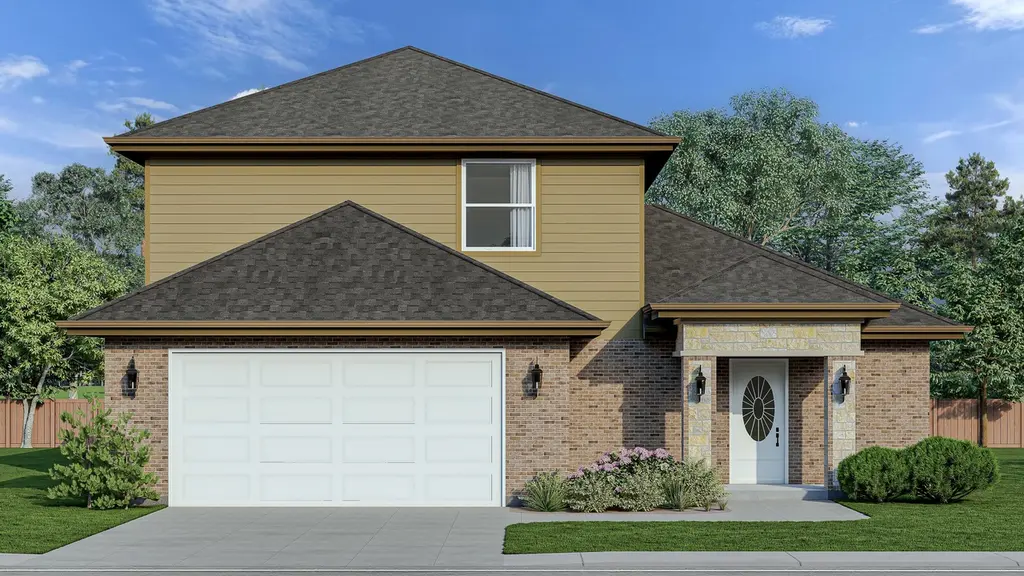
Model 3 Plan · Los Fresnos, TX
Flood risk No data
- FEMA flood zone
- —
- Chance of flooding over 30 yrs
- —
- Est. flood insurance / yr
- —
Fire risk No data
- Est. fire insurance / yr
- —
Heat risk No data
- Hot days now (above threshold)
- —
- Hot days in 30 yrs
- —
Wind risk No data
- Chance of severe wind over 30 yrs
- —
Air-quality risk No data
- Unhealthy air days now
- —
- Unhealthy air days in 30 yrs
- —
Risk factors via First Street. Map © Google.
Why this score? — see what drove the F grade
The composite is a weighted blend of 9 inputs, each scored 0–100. Each bar is that input's sub-score; the figure is the points it added to the 100-point composite (weight × sub-score).
- Appreciation +7.9/10.0
- ARV discount +7.5/15.0
- Cash flow +4.0/30.0
- Livability +3.6/5.0
- Schools +3.3/10.0
- Rent growth +2.5/5.0
- Condition / age +2.5/5.0
- 1% rule +0.2/10.0
- DSCR +0.0/10.0
$272,000
🖨 Deal sheet 📄 Offer letter ✓ Due diligence
Listing remarks MLS
Encino Homes is expanding in Los Fresnos with the development of Encino Crossing. Encino Crossing is an exclusive development consisting of 41 Single Family Homes and 55 Duplexes. Home availability at Encino Crossing. Two story 3 beds 2.5 baths 2 car garage 1,690 sq ft living space $272,000 (Price changes based on lot selected)
Key facts
- 2 parking spots
- Listed 93 days
Neighborhood map
What this means for you Summary
Snapshot
- This is a 3-bed/2.5-bath single-family listed at $272k.
Deal economics
- At list price, monthly cash flow is $-936 ($-11k/yr) — negative.
- To cash-flow at today's rent, offer at most $196k (27.8% below list).
- To meet the 1% rule (rent ≥ 1% of price), the offer needs to be $172k (36.9% below list).
- Recommended offer: $172k (36.9% below list) — sets the bar for 1% rule.
Location & tenants
- Location reads 71/100 on livability (#327 in TX) — a middle-class / working-renter tenant base. Strengths: cost of living A+, housing A+, health & safety A+; Watch: schools D+, employment D, crime F.
- Los Fresnos CISD (suburban): math 34% / reading 44% proficiency, ranked #444 of 826 in TX (top 54%) — families likely to look elsewhere, expect single-tenant / working-renter base with shorter leases.
- Market conditions: 231 active listings in the ZIP; 7 comparable units currently listed for rent nearby; rentals lingering (median 44d on market — plan ~5-8 weeks vacancy on turnover, expect pricing pressure); 57% of comp listings sitting > 30 days — soft ceiling on asking rent; 2,326 units permitted in Cameron County in 2024 (503 in 5+ unit buildings).
Forward outlook
- In year one you build about $21k of equity ($2k loan paydown + $19k appreciation (5.8% local appreciation)).
- Cameron County population projected at +3% by 2050 — modest demand growth; plan on rents tracking national, not racing it.
- By year 2, paydown + projected appreciation supports a ~$34k cash-out refi (75% LTV) — recoverable capital for the next deal without selling this one.
Negotiation context
- It's been on market 93 days — a 9% lower offer ($248k) is reasonable based on typical stale-listing flexibility.
Questions for the listing agent
- What do current leases actually rent for vs. the listed asking? Can we see a recent rent roll and the last 12 months of T-12 income?
- It's been on market 93 days. Have you received any prior offers? Is the seller open to a 37% concession, seller financing, or rate buy-down credit?
- Why hasn't it sold? Are there any deal-killer items the seller is aware of (foundation, flood, title, zoning, code violations)?
- Is there a deadline driving the sale (1031 exchange, divorce, estate, relocation)? That informs how much negotiation room exists.
- Schools are D-rated, which usually means shorter tenancies and higher turnover. Who's the typical renter profile here, and what's been the actual vacancy rate?
- Crime grade is F in this area — have there been break-ins, vandalism, or insurance claims at this property in the last 3 years? What carrier currently insures it and at what premium?
- The area grade is low — what's the realistic commute time and amenity access for the typical tenant pool here? Any planned neighborhood developments (good or bad) we should know about?
- What's the average days-on-market for RENTAL listings here right now (not sales)? A rising rental-DOM trend means longer vacancies and softer asking-rent achievability than the comps imply.
- What's the recent tenant-quality profile in this submarket — average credit score on applications, eviction rate, late-payment / NSF rate, and stable-employment percentage? A property-management company in the area should have these aggregated.
- How much new for-sale + rental construction is in the pipeline within 1–3 miles? Heavy new supply typically softens prices + rents 12–24 months out; constrained supply supports both.
Investment metrics
- 1% rule
- 0.52% ✗
- Cap rate
- 2.91%
- Cash-on-cash
- -12.09%
- DSCR
- 0.46
- GRM
- 16.1
CMA / ARV
- ARV (median comp)
- $331,749
- List price
- $272,000
- Delta
- -18.01%
- Verdict
- UNDERPRICED
- Comps
- 20 within 1.0 mi
Show comp detail 2 sales within ~0.75 mi
| Address | Dist | Beds/Ba | Sqft | Sold | Price | $/sf | Match |
|---|---|---|---|---|---|---|---|
| 519 Oriole Dr | 0.56mi | 3/2.5 | 1,925 (+14%) | 10mo | $334,900 | $174 | 42 |
| 520 Eagle Dr | 0.58mi | 4/2.5 (+1) | 1,850 (+10%) | 16mo | $348,500 | $188 | 39 |
Match score weights: distance 35% · size 25% · config 20% · recency 20%. Top-matched comps best support the ARV.
Projected returns pro-forma
5.78% appreciation · 3.0% rent growth · sell at horizon
- IRR
- 5.1%
- Equity multiple
- 1.34×
- Total profit
- $31,902
- Equity at exit
- $203,977
- IRR
- 7.5%
- Equity multiple
- 2.53×
- Total profit
- $141,750
- Equity at exit
- $366,017
Cash invested: $92,890 (down + closing). Projections, not guarantees.
Landlord ↔ Tenant lean methodology
- Overall (STATE)
- 87 Strongly Landlord-Friendly
- State Texas
- 87 Strongly Landlord-Friendly · R+5
- County
- — inherits STATE
- City
- — inherits STATE
ZIP-level market 78566
- Home prices YoY
- 2.7%
- Active inventory
- 231
- Price-to-rent
- 13.2×
Monthly cashflow live
- Estimated rent
- $1,717 high interval (Pro) →
- Mortgage (P&I)
- −$1,740
- Tax est. 1.5%
- −$415 /mo · $4,976/yr
- Insurance
- −$138
- HOA
- −$0
- Vacancy / Maint / Mgmt
- −$361
- Net cashflow
- $-936
Break-even live
UW: 25.0% down · 7.5% · 30yr · 1.5% tax · 5.0% vac · 8.0% maint · 8.0% mgmt
Financing live
Cash to close
- Down payment
- $82,937
- Closing costs
- $9,952
- Reserves months
- —
- Total cash needed
- —
Loan-product check · same deal, 3 products live
Conventional
25% down · 7.5% · 30yr
- Down + closing
- —
- Monthly P&I
- —
- Monthly cashflow
- —
- DSCR
- —
- Eligible?
- —
Personal DTI + credit; lowest rate.
DSCR
20% down · 8.5% · 30yr
- Down + closing
- —
- Monthly P&I
- —
- Monthly cashflow
- —
- DSCR
- —
- Eligible?
- —
No personal income docs; deal must DSCR.
Hard money
10% down · 12.0% · 12mo
- Down + closing
- —
- Monthly P&I
- —
- Monthly cashflow
- —
- DSCR
- —
- Eligible?
- —
Short-term bridge; refi at stabilization.
Rent comps 7 comps
| Address | Beds | Baths | Sqft | Rent | $/sqft | DOM | Units | Dist |
|---|---|---|---|---|---|---|---|---|
| 110 Olive St Los Fresnos, TX | 3.0 | 2.5 | 1975 | $1,700 | $0.86 | 43d | 1 | 0.09mi |
| 127 Olive St Los Fresnos, TX | 3.0 | 2.5 | 1835 | $1,650 | $0.90 | 21d | 1 | 0.18mi |
| 129 Olive St Los Fresnos, TX | 2.0 | 2.5 | 1670 | $1,550 | $0.93 | 43d | 1 | 0.19mi |
| 121 Mimosa St Los Fresnos, TX | 3.0 | 2.5 | 1790 | $1,650 | $0.92 | 43d | 1 | 0.26mi |
| 121 Mimosa St Los Fresnos, TX | 3.0 | 2.5 | 1790 | $1,750 | $0.98 | 13d | 1 | 0.26mi |
| 123 Mimosa St Los Fresnos, TX | 3.0 | 2.5 | 1835 | $1,650 | $0.90 | 13d | 1 | 0.26mi |
| 518 Oriole Dr Los Fresnos, TX | 3.0 | 2.5 | 2206 | $2,900 | $1.31 | 43d | 1 | 0.52mi |
Listing history 17 events
-
2026-06-18days on market $272,000 Active 93 DOM
-
2026-06-17days on market $272,000 Active 92 DOM
-
2026-06-16days on market $272,000 Active 91 DOM
-
2026-06-15days on market $272,000 Active 90 DOM
-
2026-06-14days on market $272,000 Active 88 DOM
-
2026-06-13days on market $272,000 Active 87 DOM
-
2026-06-10days on market $272,000 Active 85 DOM
-
2026-06-09days on market $272,000 Active 84 DOM
-
2026-06-08days on market $272,000 Active 83 DOM
-
2026-06-07days on market $272,000 Active 82 DOM
-
2026-06-05days on market $272,000 Active 79 DOM
-
2026-06-03days on market $272,000 Active 78 DOM
-
2026-06-02days on market $272,000 Active 77 DOM
-
2026-06-01days on market $272,000 Active 76 DOM
-
2026-05-31days on market $272,000 Active 75 DOM
-
2026-05-30days on market $272,000 Active 74 DOM
-
2026-03-17$272,000 Active 329-char remark
Show marketing remark (329 chars)
Encino Homes is expanding in Los Fresnos with the development of Encino Crossing. Encino Crossing is an exclusive development consisting of 41 Single Family Homes and 55 Duplexes. Home availability at Encino Crossing. Two story 3 beds 2.5 baths 2 car garage 1,690 sq ft living space $272,000 (Price changes based on lot selected)
ⓘ Source: listings_history table (triggers on properties + properties_extension) + one-shot
backfill from property_details.listing_events for pre-trigger history.
Nearby sold comps map
Loading sold comps map…
Walkable amenities ~0.75 mi
Loading nearby amenities…
Taxation est. · year 1
- Rental income
- $20,609
- − Mortgage interest
- −$18,583
- − Property taxes
- −$4,976
- − Insurance
- −$1,659
- − Repairs & maintenance
- −$1,649
- − Management
- −$1,649
- − Depreciation
- −$9,651
- Taxable loss
- −$17,558
- Est. tax savings @ 24.0%
- +$4,214
- After-tax cash flow
- $-7,017/yr
For passive investors: Depreciation is non-cash, so a rental often shows a tax loss while cash-flowing — sheltering income. Rental losses are passive: they offset passive income freely, and up to $25,000/yr can offset ordinary (W-2) income if you actively participate and your MAGI is under $100k (phasing out to $0 by $150k); unused losses carry forward. On sale, claimed depreciation is recaptured at up to 25%, and gains may owe capital-gains tax (a 1031 exchange can defer both). Figures are a year-1 estimate at your 24.0% rate — not tax advice; consult a CPA.
Schools (NCES district)
- District
- Los Fresnos CISD
- NCES district ID
- 4828290
- Math proficiency
- 34% ▼ -30.00%
- Reading proficiency
- 44% ▼ -10.00%
- Median HH income
- $42,586
- Composite
- 32.92/100
- National rank
- #5601
- State rank
- #444 of 826 in TX
Livability — Los Fresnos
- Score
- 71/100
- State rank
- #327
- US rank
- #7193
Category grades
Schools grade is shown separately in the Schools card above.
Census & demographics
- Census place
- Los Fresnos, TX
- Population (ZIP)
- 24,927
Population outlook (Cameron County) Hauer SSP2
- Today (2025)
- 441,603 people
- By 2030
- 448,113 · +1.5%
- By 2040
- 456,385 · +3.3%
- By 2050
- 456,294 · +3.3%
- By 2075
- 423,851 · -4.0%
- By 2100
- 342,787 · -22.4%
Race, ethnicity, and origin ACS 2023
- Neighborhood character
- Predominantly Hispanic (88%)
- Race & ethnicity
- Hispanic / Latino 88% Two or more races 45% White 10% Black 1%
- Hispanic origin (detail)
- Mexican 84%
- Foreign-born
- 22% · Canada
- Languages at home
- 33% English-only · Spanish 67%
Political lean MEDSL · Cameron
- 2024 margin
- Lean R (+5.8) · D 46.7% · R 52.5%
- 2008→2024 swing
- -34.6pp toward R · 2008: 28.8pp · 2024: -5.8pp
- All cycles
- 2024: R+5.8 2020: D+13.2 2016: D+32.5 2012: D+32.4 2008: D+28.8
Not yet ingested
- Civics
- —
Market trends
- HPI YoY
- ▲ 5.78%
- Current HPI
- 218.1236
- Rent YoY
- —
- Metro
- —
- State GDP YoY
- ▲ 3.95%
- F500 in state
- 110
Industry mix (Fortune 500 HQ in TX)
| Industry | F500 HQs | Revenue |
|---|---|---|
| Energy | 16 | $1,198B |
|
||
| Technology | 5 | $198B |
|
||
| Engineering / Construction | 4 | $72B |
|
||
| Energy Services | 3 | $60B |
|
||
| Utilities | 3 | $41B |
|
||
| Healthcare | 2 | $330B |
|
||
Price history
1 event — show timeline
- 2026-03-17 Listed $272,000 Zillow
Cash-flow waterfall
monthlySold comps — $/sqft
last 12 mo · ≤1 miLoading sold comps…