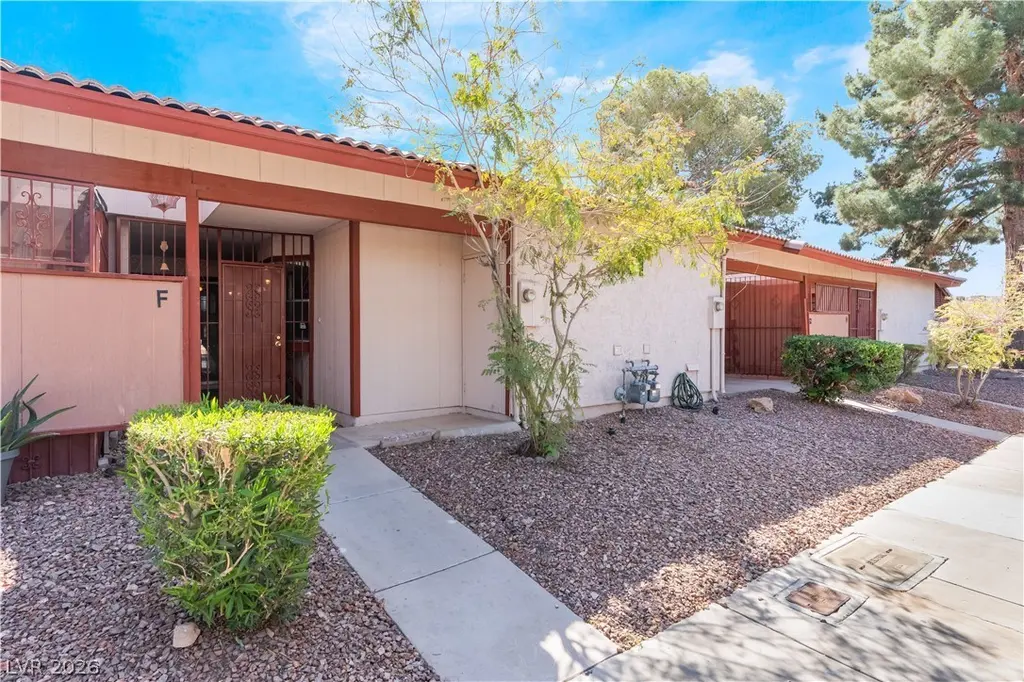
441 N Lamb Blvd Unit F · Las Vegas, NV
Flood risk 1/10 · Minimal
- FEMA flood zone
- X (unshaded)
- Chance of flooding over 30 yrs
- 0.0%
- Est. flood insurance / yr
- $507 – $1,088
Fire risk 1/10 · Minimal
- Est. fire insurance / yr
- $490 – $910
Heat risk 8/10 · Major
- Hot days now (above 108°F)
- 7 days/yr
- Hot days in 30 yrs
- 16 days/yr
Wind risk 1/10 · Minimal
- Chance of severe wind over 30 yrs
- —
Air-quality risk 4/10 · Minor
- Unhealthy air days now
- 4 days/yr
- Unhealthy air days in 30 yrs
- 5 days/yr
Risk factors via First Street. Map © Google.
Why this score? — see what drove the D grade
The composite is a weighted blend of 9 inputs, each scored 0–100. Each bar is that input's sub-score; the figure is the points it added to the 100-point composite (weight × sub-score).
- Cash flow +13.1/30.0
- ARV discount +7.5/15.0
- 1% rule +4.5/10.0
- Livability +4.0/5.0
- DSCR +3.9/10.0
- Rent growth +2.9/5.0
- Schools +2.6/10.0
- Condition / age +2.5/5.0
- Appreciation +0.0/10.0
$125,000
🖨 Deal sheet 📄 Offer letter ✓ Due diligence
Listing remarks MLS
Easy living meets functional design in this Single Story 1-Bed, 1-Bath Las Vegas Townhome. The open-concept layout features tile flooring throughout for low-maintenance appeal. The updated kitchen is equipped with granite countertops, pristine cabinetry, and stainless-steel sink, microwave, and dishwasher. Enjoy seamless indoor-outdoor living with direct access to a private, gated covered patio through the sliding glass doors in the expansive living room. A spacious primary suite is complete with a versatile bay window and a modern tiled Shower Enclosure. Ideally situated near the unit’s carport and community amenities right around the corner, including a pool, benches, and a court. Just moments away from everyday necessities, shopping, dining, and transportation. With a Practical Layout and a Convenient Location, This Home Offers a Perfect Blend of Comfort and Accessibility. Schedule a Showing Today!
Key facts
- Tile flooring
- Updated kitchen
- Granite countertops
Tags
Neighborhood map
What this means for you Summary
Snapshot
- This is a 1-bed/1.0-bath townhouse listed at $125k.
Deal economics
- At list price, monthly cash flow is $-4 ($-53/yr) — negative.
- To cash-flow at today's rent, offer at most $124k (0.6% below list).
- To meet the 1% rule (rent ≥ 1% of price), the offer needs to be $118k (5.3% below list).
- Recommended offer: $118k (5.3% below list) — sets the bar for 1% rule.
Location & tenants
- Location reads 80/100 on livability (#2 in NV, #1,723 nationally) — a professional / high-income tenant draw. Strengths: amenities A+, commute A+, housing A+; Watch: crime F.
- Clark County School District (urban): math 21% / reading 39% proficiency, ranked #11 of 17 in NV (top 65%) — families likely to look elsewhere, expect single-tenant / working-renter base with shorter leases.
- Market conditions: Rents rising (+1.8%/yr); 260 active listings in the ZIP; 24 comparable units currently listed for rent nearby; rentals at typical pace (median 24d on market — plan ~3-4 weeks tenant-placement turnaround); 42% of comp listings sitting > 30 days — soft ceiling on asking rent; 14,754 units permitted in Clark County in 2024 (2,301 in 5+ unit buildings).
Forward outlook
- Local home prices are declining (-3.0%/yr); year-one equity from $864 of loan paydown is wiped out by about $4k of value loss. Plan a longer hold.
- Clark County population projected at +36% by 2050 — long-run rental-demand tailwind backs the buy-and-hold thesis.
Negotiation context
- It's been on market 56 days — a 3% lower offer ($121k) is reasonable based on typical stale-listing flexibility.
- Current owner paid $44k; list at $125k implies a 184% gain — meaningful room to come down on a strong offer.
Risks & watch-outs
- Climate carrying-cost: extreme-heat days projected 7→16/yr by 2055 (HVAC capex compounding) — expect insurance premiums to compound above CPI over the hold.
Questions for the listing agent
- What do current leases actually rent for vs. the listed asking? Can we see a recent rent roll and the last 12 months of T-12 income?
- It's been on market 56 days. Have you received any prior offers? Is the seller open to a 5% concession, seller financing, or rate buy-down credit?
- What does the HOA fee cover, when was the last increase, and are there any pending special assessments or reserve-fund shortfalls?
- Is there a deadline driving the sale (1031 exchange, divorce, estate, relocation)? That informs how much negotiation room exists.
- Crime grade is F in this area — have there been break-ins, vandalism, or insurance claims at this property in the last 3 years? What carrier currently insures it and at what premium?
- The area grade is low — what's the realistic commute time and amenity access for the typical tenant pool here? Any planned neighborhood developments (good or bad) we should know about?
- What's the average days-on-market for RENTAL listings here right now (not sales)? A rising rental-DOM trend means longer vacancies and softer asking-rent achievability than the comps imply.
- What's the recent tenant-quality profile in this submarket — average credit score on applications, eviction rate, late-payment / NSF rate, and stable-employment percentage? A property-management company in the area should have these aggregated.
- How much new for-sale + rental construction is in the pipeline within 1–3 miles? Heavy new supply typically softens prices + rents 12–24 months out; constrained supply supports both.
Investment metrics
- 1% rule
- 0.95% ✗
- Cap rate
- 6.25%
- Cash-on-cash
- -0.15%
- DSCR
- 0.99
- GRM
- 8.8
CMA / ARV
No comps found within radius.
Projected returns pro-forma
-3.0% appreciation · 1.78% rent growth · sell at horizon
- IRR
- -18.0%
- Equity multiple
- 0.37×
- Total profit
- $-21,909
- Equity at exit
- $18,638
- IRR
- -12.9%
- Equity multiple
- 0.29×
- Total profit
- $-24,929
- Equity at exit
- $10,808
Cash invested: $35,000 (down + closing). Projections, not guarantees.
Landlord ↔ Tenant lean methodology
- Overall (STATE)
- 71 Landlord-Friendly
- State Nevada
- 71 Landlord-Friendly · R+1
- County
- — inherits STATE
- City
- — inherits STATE
ZIP-level market 89110
- Rents YoY
- 1.8%
- Active inventory
- 260
- Price-to-rent
- 8.8×
Monthly cashflow live
- Estimated rent
- $1,184 high interval (Pro) →
- Mortgage (P&I)
- −$656
- Tax from tax record
- −$26 /mo · $315/yr
- Insurance
- −$52
- HOA
- −$206
- Vacancy / Maint / Mgmt
- −$249
- Net cashflow
- $-4
Break-even live
UW: 25.0% down · 7.5% · 30yr · 1.5% tax · 5.0% vac · 8.0% maint · 8.0% mgmt
Financing live
Cash to close
- Down payment
- $31,250
- Closing costs
- $3,750
- Reserves months
- —
- Total cash needed
- —
Loan-product check · same deal, 3 products live
Conventional
25% down · 7.5% · 30yr
- Down + closing
- —
- Monthly P&I
- —
- Monthly cashflow
- —
- DSCR
- —
- Eligible?
- —
Personal DTI + credit; lowest rate.
DSCR
20% down · 8.5% · 30yr
- Down + closing
- —
- Monthly P&I
- —
- Monthly cashflow
- —
- DSCR
- —
- Eligible?
- —
No personal income docs; deal must DSCR.
Hard money
10% down · 12.0% · 12mo
- Down + closing
- —
- Monthly P&I
- —
- Monthly cashflow
- —
- DSCR
- —
- Eligible?
- —
Short-term bridge; refi at stabilization.
Rent comps 24 comps
| Address | Beds | Baths | Sqft | Rent | $/sqft | DOM | Units | Dist |
|---|---|---|---|---|---|---|---|---|
| 425 N Lamb Blvd Las Vegas, NV | 1.0 | 1.0 | 599 | $1,500 | $2.50 | 43d | 1 | 0.03mi |
| 429 N Lamb Blvd Las Vegas, NV | 1.0 | 1.0 | 599 | $1,500 | $2.50 | 43d | 1 | 0.05mi |
| 457 N Lamb Blvd Unit B Las Vegas, NV | 1.0 | 1.0 | 599 | $1,000 | $1.67 | 20d | 1 | 0.06mi |
| 405 N Lamb Blvd Las Vegas, NV | 1.0 | 1.0 | 599 | $1,000 | $1.67 | 43d | 1 | 0.11mi |
| 4220 Stewart Ave Las Vegas, NV | 1.0 | 1.0 | 550 | $940 | $1.71 | 43d | 1 | 0.17mi |
| 4521 E Bonanza Rd Las Vegas, NV | 1.0–2.0 | 1.0–2.0 | 897 | $1,144 | $1.27 | 1d | 14 | 0.45mi |
| 4000 E Bonanza Rd Las Vegas, NV | 1.0–2.0 | 1.0–2.0 | 850 | $1,333 | $1.57 | 3d | 7 | 0.51mi |
| 628 Triest Ct Apt D Las Vegas, NV | 2.0 | 1.0 | 731 | $950 | $1.30 | 7d | 1 | 0.52mi |
| 4700 E Charleston Blvd Las Vegas, NV | 1.0–3.0 | 1.0–2.0 | 935 | $950 | $1.02 | 23d | 15 | 0.82mi |
| 3700 E Bonanza Rd Las Vegas, NV | 1.0–2.0 | 1.0–2.0 | 850 | $925 | $1.09 | 1d | 8 | 0.94mi |
| 917 Bridgewater St Las Vegas, NV | 2.0 | 1.0 | 749 | $1,050 | $1.40 | 43d | 1 | 0.95mi |
| 451 N Nellis Blvd Las Vegas, NV | 1.0–3.0 | 1.0–2.0 | 943 | $1,201 | $1.27 | 19d | 13 | 1.00mi |
| 1492 N Lamb Blvd Las Vegas, NV | 1.0–2.0 | 1.0 | 739 | $1,369 | $1.85 | 1d | 9 | 1.28mi |
| 1001 N Pecos Rd Las Vegas, NV | 1.0–3.0 | 1.0–2.0 | 875 | $975 | $1.11 | 3d | 7 | 1.35mi |
| 5250 Stewart Ave Las Vegas, NV | 1.0–3.0 | 1.0–2.0 | 928 | $1,020 | $1.10 | 1d | 51 | 1.36mi |
| 346 Sturgeon Ln Las Vegas, NV | 1.0–3.0 | 1.0–2.0 | 862 | $1,050 | $1.22 | 2d | 13 | 1.37mi |
| 3979 E Owens Ave Unit 115 Las Vegas, NV | 1.0 | 1.0 | 600 | $1,055 | $1.76 | 17d | 1 | 1.42mi |
| 1175 S Mojave Rd Unit 3 Las Vegas, NV | 1.0 | 1.0 | 385 | $995 | $2.58 | 23d | 1 | 1.44mi |
| 2908 E Poplar Ave Unit 3 Las Vegas, NV | 2.0 | 2.0 | 750 | $1,100 | $1.47 | 43d | 1 | 1.45mi |
| 3980 E Owens Ave Unit 105 Las Vegas, NV | 1.0 | 1.0 | 620 | $1,200 | $1.94 | 43d | 1 | 1.46mi |
| 3980 E Owens Ave Unit 109 Las Vegas, NV | 1.0 | 1.0 | 620 | $1,200 | $1.94 | 43d | 1 | 1.46mi |
| 3980 E Owens Ave Unit 211 Las Vegas, NV | 1.0 | 1.0 | 620 | $1,200 | $1.94 | 43d | 1 | 1.46mi |
| 118 S Mojave Rd Unit 6 Las Vegas, NV | 1.0 | 1.0 | 429 | $895 | $2.09 | 23d | 1 | 1.46mi |
| 2900 Marlin Ave Unit B Las Vegas, NV | 2.0 | 1.0 | 750 | $1,175 | $1.57 | 43d | 1 | 1.49mi |
HOA detail
- Monthly dues
- $206 · $2,472/yr
- Likely covers
- gaspoolsecurity
Listing history 17 events
-
2026-06-18days on market $125,000 Active 56 DOM
-
2026-06-17days on market $125,000 Active 55 DOM
-
2026-06-16days on market $125,000 Active 54 DOM
-
2026-06-15days on market $125,000 Active 53 DOM
-
2026-06-13days on market $125,000 Active 51 DOM
-
2026-06-09days on market $125,000 Active 47 DOM
-
2026-06-08days on market $125,000 Active 46 DOM
-
2026-06-07days on market $125,000 Active 45 DOM
-
2026-06-03days on market $125,000 Active 41 DOM
-
2026-06-02days on market $125,000 Active 40 DOM
-
2026-06-01days on market $125,000 Active 39 DOM
-
2026-05-31pricedays on market $125,000 Active 38 DOM
-
2026-04-23$130,000 Active 920-char remark
Show marketing remark (920 chars)
Easy living meets functional design in this Single Story 1-Bed, 1-Bath Las Vegas Townhome. The open-concept layout features tile flooring throughout for low-maintenance appeal. The updated kitchen is equipped with granite countertops, pristine cabinetry, and stainless-steel sink, microwave, and dishwasher. Enjoy seamless indoor-outdoor living with direct access to a private, gated covered patio through the sliding glass doors in the expansive living room. A spacious primary suite is complete with a versatile bay window and a modern tiled Shower Enclosure. Ideally situated near the unit’s carport and community amenities right around the corner, including a pool, benches, and a court. Just moments away from everyday necessities, shopping, dining, and transportation. With a Practical Layout and a Convenient Location, This Home Offers a Perfect Blend of Comfort and Accessibility. Schedule a Showing Today!
-
1991-08-08soldstatus $44,000
-
1991-08-08soldstatus $44,000
-
1985-10-02soldstatus $22,005
-
1984-08-29soldstatus $43,221
ⓘ Source: listings_history table (triggers on properties + properties_extension) + one-shot
backfill from property_details.listing_events for pre-trigger history.
Tax reassessment forecast NV · Resets to sale price
- Current annual tax
- $315 · $26/mo
- Projected year-2 tax
- $738 · $61/mo
- Expected delta
- +$422/yr (+$35/mo · 134.1%)
ⓘ Screening estimate from a state-policy table — verify with the county assessor before closing.
Climate risk First Street
- Flood 1/10 Low FEMA zone X (unshaded) · 0% chance over 30 yrs
- Wildfire 1/10 Low
- Heat 8/10 Severe 7 d/yr ≥108°F today · 16 d/yr by 30 yrs out
- Wind 1/10 Low
- Air quality 4/10 Moderate 4 unhealthy d/yr today · 5 by 30 yrs out
Nearby sold comps map
Loading sold comps map…
Walkable amenities ~0.75 mi
Loading nearby amenities…
Taxation est. · year 1
- Rental income
- $14,209
- − Mortgage interest
- −$7,002
- − Property taxes
- −$315
- − Insurance
- −$625
- − Repairs & maintenance
- −$1,137
- − Management
- −$1,137
- − HOA
- −$2,472
- − Depreciation
- −$3,636
- Taxable loss
- −$2,115
- Est. tax savings @ 24.0%
- +$508
- After-tax cash flow
- $454/yr
For passive investors: Depreciation is non-cash, so a rental often shows a tax loss while cash-flowing — sheltering income. Rental losses are passive: they offset passive income freely, and up to $25,000/yr can offset ordinary (W-2) income if you actively participate and your MAGI is under $100k (phasing out to $0 by $150k); unused losses carry forward. On sale, claimed depreciation is recaptured at up to 25%, and gains may owe capital-gains tax (a 1031 exchange can defer both). Figures are a year-1 estimate at your 24.0% rate — not tax advice; consult a CPA.
Schools (NCES district)
- District
- Clark County School District
- NCES district ID
- 3200060
- Math proficiency
- 21% ▼ -13.00%
- Reading proficiency
- 39% ▼ -8.00%
- Median HH income
- $53,611
- Composite
- 26.48/100
- National rank
- #7211
- State rank
- #11 of 17 in NV
Livability — Las Vegas
- Score
- 80/100
- State rank
- #2
- US rank
- #1723
Category grades
Schools grade is shown separately in the Schools card above.
Census & demographics
- Census place
- Las Vegas, NV
- County
- Clark County · 2,306,105 people
- City population
- 1,643,591
- Metro
- Las Vegas-Henderson-Paradise, NV
- Population (ZIP)
- 69,107
- Household income
- $61,001
- Rent vs Own
- Severe rent burden
- 3134.0
Population outlook (Clark County) Hauer SSP2
- Today (2025)
- 2,504,101 people
- By 2030
- 2,693,770 · +7.6%
- By 2040
- 3,061,208 · +22.2%
- By 2050
- 3,400,072 · +35.8%
- By 2075
- 4,139,522 · +65.3%
- By 2100
- 4,596,916 · +83.6%
Race, ethnicity, and origin ACS 2023
- Neighborhood character
- Diverse neighborhood (Simpson 0.55)
- Race & ethnicity
- Hispanic / Latino 63% White 20% Two or more races 18% Black 8% Asian 5% Native American 2%
- Hispanic origin (detail)
- Mexican 52% Cuban 3%
- Common ancestry
- Lithuanian 1% Italian 1% Romanian 1%
- Foreign-born
- 31% · Canada
- Languages at home
- 42% English-only · Spanish 53% Tagalog/Filipino 2% Other Asian/Pacific 1%
Political lean MEDSL · Clark
- 2024 margin
- Toss-up / Even · D 50.4% · R 47.8% · Other 1.7%
- 2008→2024 swing
- -16.5pp toward R · 2008: 19.1pp · 2024: 2.6pp
- All cycles
- 2024: D+2.6 2020: D+9.3 2016: D+10.7 2012: D+14.5 2008: D+19.1
Not yet ingested
- Civics
- —
Market trends
- HPI YoY
- ▼ -165.11%
- Current HPI
- 299.1815
- Rent YoY
- ▲ 1.78%
- Metro
- Las Vegas-Henderson-Paradise, NV
- State GDP YoY
- ▲ 3.08%
- F500 in state
- 6
Industry mix (Fortune 500 HQ in NV)
| Industry | F500 HQs | Revenue |
|---|---|---|
| Hotels / Casinos | 3 | $36B |
|
||
Price history
+200.8% since first listed5 events — show timeline
- 2026-04-23 Listed $130,000 GLVAR
- 1991-08-08 Sold (Public Records) $44,000 Public Records
- 1991-08-08 Sold (Public Records) $44,000 Public Records
- 1985-10-02 Sold (Public Records) $22,005 Public Records
- 1984-08-29 Sold (Public Records) $43,221 Public Records
Property tax history
-4.0%/yrLatest (2025): $315 · -2.6% YoY. Source: county tax records.
Cash-flow waterfall
monthlySold comps — $/sqft
last 12 mo · ≤1 miLoading sold comps…