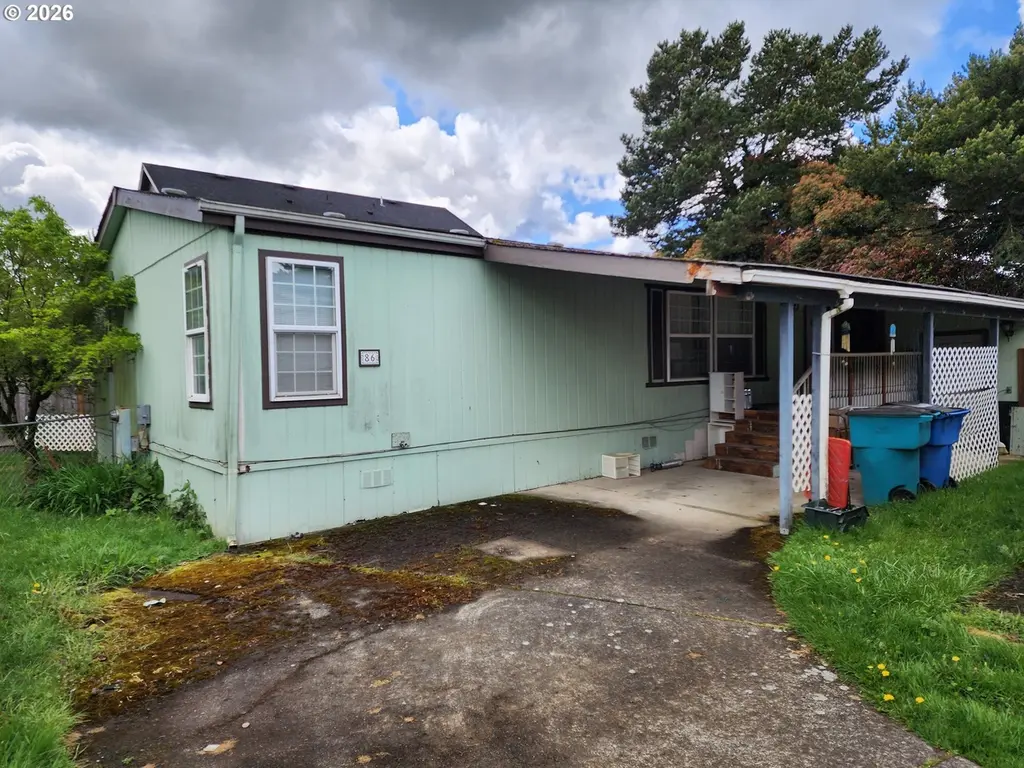
13217 NE 59th St #86 · Vancouver, WA
Flood risk No data
- FEMA flood zone
- —
- Chance of flooding over 30 yrs
- —
- Est. flood insurance / yr
- —
Fire risk No data
- Est. fire insurance / yr
- —
Heat risk No data
- Hot days now (above threshold)
- —
- Hot days in 30 yrs
- —
Wind risk No data
- Chance of severe wind over 30 yrs
- —
Air-quality risk No data
- Unhealthy air days now
- —
- Unhealthy air days in 30 yrs
- —
Risk factors via First Street. Map © Google.
Why this score? — see what drove the B+ grade
The composite is a weighted blend of 9 inputs, each scored 0–100. Each bar is that input's sub-score; the figure is the points it added to the 100-point composite (weight × sub-score).
- Cash flow +30.0/30.0
- ARV discount +15.0/15.0
- 1% rule +10.0/10.0
- DSCR +10.0/10.0
- Schools +4.3/10.0
- Livability +4.1/5.0
- Rent growth +2.7/5.0
- Condition / age +2.5/5.0
- Appreciation +0.0/10.0
$85,000
🖨 Deal sheet 📄 Offer letter ✓ Due diligence
Listing remarks MLS
Time to cancel the rental contract and get some separation with your own unattached home. Corner lot, fully fenced, carport, shed, deck, recent paint & hotwater heater, 2004. Reefer stays.
Key facts
- Bright kitchen
- Walk-in closet
- Private bath
Tags
Property features AI
Finance
- Other: Property type: Residential (manufactured home in park); Resale condition; Unit dimensions: 60 ft length x 27 ft width; Upper level area reported as 1,620
- HOA & community: Park name: SkyRidge II; Pet restrictions: buyer due diligence; Land lease in place (monthly lot rent; lease expires January 1, 2030)
Exterior
- Parking: Carport; Driveway parking (total 1 space)
- Security: No security features listed
- Utilities: Electric service for fuel and hot water; Public water; Public sewer; Cable or other internet available
- Home design: Manufactured home in a park (not attached); Single-story layout; Entry and living areas on main level; No significant view
- Construction: Built in 1995; Fleetwood manufacturer; Composition roof; Oriented strand board / panel / T-111 and wood composite siding; Foundation with block, skirting and other materials
- Exterior features: Fenced yard; Tool shed; Yard; Flag lot; Leased land; Level lot; Paved road access
Interior
- Kitchen: Dishwasher; Free-standing range; Range hood; Pantry
- Bedrooms: Primary bedroom on main level with vaulted ceiling; Second bedroom on main level with vaulted ceiling (15 x 13); Third bedroom on main level with vaulted ceiling (14 x 13)
- Bathrooms: Two full bathrooms, both on the main level
- Heating & cooling: Forced-air heating; Window cooling unit(s)
- Interior features: High ceilings; Vaulted ceilings; Laundry area; Washer and dryer included; Double pane windows with vinyl frames; Crawl space basement (dirt floor, unfinished)
- Laundry & utility: Washer and dryer; Electric hot water
Neighborhood map
What this means for you Summary
Snapshot
- This is a 3-bed/2.0-bath manufactured listed at $85k.
Deal economics
- At list price, monthly cash flow is $1k ($16k/yr) — positive.
- The deal already cash-flows at list — no discount required.
- Meets the 1% rule at list price ($2k rent vs $85k).
- Recommended offer: $82k (3.0% below list) — sets the bar for market timing.
- Cap rate 24.6% vs local median 2.7% in Vancouver — top-decile yield for the area; either an underpriced asset or a hidden risk that comps aren't pricing in. Stress-test before assuming the spread holds.
Location & tenants
- Location reads 82/100 on livability (#62 in WA, #1,133 nationally) — a professional / high-income tenant draw. Strengths: amenities A+, commute A+, housing A+; Watch: crime F, cost of living D-.
- Evergreen School District (Clark) (urban): math 41% / reading 51% proficiency, ranked #164 of 291 in WA (top 56%) — families likely to look elsewhere, expect single-tenant / working-renter base with shorter leases.
- Zoned schools: Burnt Bridge Creek Elementary Sch (377 students, 62% FRL); Covington Middle School (868 students, 73% FRL); Heritage High School (1,625 students, 68% FRL) — zoned schools average 67% FRL vs 39% district-wide (29 pts higher); higher-poverty schools than district average — tighter screening recommended.
- Market conditions: Rents flat; 461 active listings in the ZIP; 29 comparable units currently listed for rent nearby; rentals lingering (median 44d on market — plan ~5-8 weeks vacancy on turnover, expect pricing pressure); 52% of comp listings sitting > 30 days — soft ceiling on asking rent; solid renter incomes; 3,547 units permitted in Clark County in 2024 (1,361 in 5+ unit buildings).
Forward outlook
- Local home prices are declining (-3.0%/yr); year-one equity from $588 of loan paydown is wiped out by about $3k of value loss. Plan a longer hold.
- Clark County population projected at +29% by 2050 — long-run rental-demand tailwind backs the buy-and-hold thesis.
- At projected returns (-3.0% appreciation + 0.6% rent growth), your $24k cash investment doubles in ~2 years — after that, you're playing with house money.
Negotiation context
- It's been on market 49 days — a 3% lower offer ($82k) is reasonable based on typical stale-listing flexibility.
- 4 sale attempts since 21y ago with the ask held roughly flat each time — persistent listings suggest the price (not the market) is what's stuck; bring a comps-based counter.
- Current owner paid $54k; list at $85k implies a 57% gain — meaningful room to come down on a strong offer.
Questions for the listing agent
- It's been on market 49 days. Have you received any prior offers? Is the seller open to a 3% concession, seller financing, or rate buy-down credit?
- Is there a deadline driving the sale (1031 exchange, divorce, estate, relocation)? That informs how much negotiation room exists.
- Crime grade is F in this area — have there been break-ins, vandalism, or insurance claims at this property in the last 3 years? What carrier currently insures it and at what premium?
- What's the average days-on-market for RENTAL listings here right now (not sales)? A rising rental-DOM trend means longer vacancies and softer asking-rent achievability than the comps imply.
- What's the recent tenant-quality profile in this submarket — average credit score on applications, eviction rate, late-payment / NSF rate, and stable-employment percentage? A property-management company in the area should have these aggregated.
- How much new for-sale + rental construction is in the pipeline within 1–3 miles? Heavy new supply typically softens prices + rents 12–24 months out; constrained supply supports both.
Investment metrics
- 1% rule
- 2.70% ✓
- Cap rate
- 24.60%
- Cash-on-cash
- 65.38%
- DSCR
- 3.91
- GRM
- 3.1
CMA / ARV
- ARV (median comp)
- $157,816
- List price
- $85,000
- Delta
- -46.14%
- Verdict
- UNDERPRICED
- Comps
- 20 within 1.0 mi
Show comp detail 12 sales within ~0.75 mi
| Address | Dist | Beds/Ba | Sqft | Sold | Price | $/sf | Match |
|---|---|---|---|---|---|---|---|
| 13217 NE 59th St #126 | 0.03mi | 2/2.0 (-1) | 1,568 (-3%) | 4mo | $140,000 | $89 | 85 |
| 5101 NE 121st Ave | 0.53mi | 3/2.0 | 1,617 (-0%) | 2mo | $185,000 | $114 | 73 |
| 5101 NE 121st Ave #9 | 0.53mi | 3/2.0 | 1,635 (+1%) | 2mo | $223,000 | $136 | 72 |
| 13217 NE 59th St #81 | 0.00mi | 3/2.0 | 1,400 (-14%) | 9mo | $140,000 | $100 | 70 |
| 5101 NE 121st Ave #154 | 0.41mi | 2/2.0 (-1) | 1,566 (-3%) | 1mo | $170,000 | $109 | 70 |
| 5101 NE 121st Ave #12 | 0.53mi | 3/2.0 | 1,501 (-7%) | 1mo | $146,000 | $97 | 62 |
| 5101 NE 121st Ave #1 | 0.53mi | 3/2.0 | 1,512 (-7%) | 4mo | $230,000 | $152 | 61 |
| 5404 NE 121st Ave #73 | 0.66mi | 3/2.0 | 1,536 (-5%) | 1mo | $75,000 | $49 | 59 |
| 5101 NE 121st Ave #118 | 0.53mi | 3/2.0 | 1,432 (-12%) | 2mo | $220,000 | $154 | 54 |
| 5404 NE 121st Ave #69 | 0.66mi | 3/2.0 | 1,436 (-11%) | 2mo | $75,000 | $52 | 49 |
| 5404 NE 121st Ave #15 | 0.66mi | 3/2.0 | 1,433 (-12%) | 9mo | $155,000 | $108 | 43 |
| 5404 NE 121st Ave #44 | 0.66mi | 2/2.0 (-1) | 1,431 (-12%) | 4mo | $140,000 | $98 | 41 |
Match score weights: distance 35% · size 25% · config 20% · recency 20%. Top-matched comps best support the ARV.
Projected returns pro-forma
-3.0% appreciation · 0.63% rent growth · sell at horizon
- IRR
- 61.9%
- Equity multiple
- 3.67×
- Total profit
- $63,463
- Equity at exit
- $12,674
- IRR
- 65.7%
- Equity multiple
- 6.91×
- Total profit
- $140,667
- Equity at exit
- $7,349
Cash invested: $23,800 (down + closing). Projections, not guarantees.
Landlord ↔ Tenant lean methodology
- Overall (STATE)
- 28 Tenant-Leaning
- State Washington
- 28 Tenant-Leaning · D+8
- County
- — inherits STATE
- City
- — inherits STATE
ZIP-level market 98682
- Rents YoY
- 0.6%
- Active inventory
- 461
- Price-to-rent
- 3.1×
Monthly cashflow live
- Estimated rent
- $2,293 high interval (Pro) →
- Mortgage (P&I)
- −$446
- Tax from tax record
- −$33 /mo · $400/yr
- Insurance
- −$35
- HOA
- −$0
- Vacancy / Maint / Mgmt
- −$481
- Net cashflow
- $1,297
Break-even live
UW: 25.0% down · 7.5% · 30yr · 1.5% tax · 5.0% vac · 8.0% maint · 8.0% mgmt
Financing live
Cash to close
- Down payment
- $21,250
- Closing costs
- $2,550
- Reserves months
- —
- Total cash needed
- —
Loan-product check · same deal, 3 products live
Conventional
25% down · 7.5% · 30yr
- Down + closing
- —
- Monthly P&I
- —
- Monthly cashflow
- —
- DSCR
- —
- Eligible?
- —
Personal DTI + credit; lowest rate.
DSCR
20% down · 8.5% · 30yr
- Down + closing
- —
- Monthly P&I
- —
- Monthly cashflow
- —
- DSCR
- —
- Eligible?
- —
No personal income docs; deal must DSCR.
Hard money
10% down · 12.0% · 12mo
- Down + closing
- —
- Monthly P&I
- —
- Monthly cashflow
- —
- DSCR
- —
- Eligible?
- —
Short-term bridge; refi at stabilization.
Rent comps 29 comps
| Address | Beds | Baths | Sqft | Rent | $/sqft | DOM | Units | Dist |
|---|---|---|---|---|---|---|---|---|
| 5719 NE 135th Ave Vancouver, WA | 3.0 | 2.0 | 1260 | $1,995 | $1.58 | 43d | 1 | 0.15mi |
| 13815 NE 63rd St Vancouver, WA | 3.0 | 2.5 | 1601 | $2,395 | $1.50 | 23d | 1 | 0.44mi |
| 12600 NE 49th St Unit F16 Vancouver, WA | 2.0 | 2.0 | 1170 | $1,695 | $1.45 | 23d | 1 | 0.55mi |
| 6509 NE 139th Ct Vancouver, WA | 3.0 | 2.0 | 1525 | $2,529 | $1.66 | 43d | 1 | 0.59mi |
| 13806 NE 47th St Vancouver, WA | 3.0 | 2.0 | 1185 | $2,779 | $2.35 | 20d | 1 | 0.62mi |
| 4825 NE 124th Ct Vancouver, WA | 3.0 | 2.5 | 1586 | $2,295 | $1.45 | 43d | 1 | 0.64mi |
| 6715 NE 139th Pl Vancouver, WA | 3.0 | 2.5 | 1423 | $2,400 | $1.69 | 4d | 1 | 0.64mi |
| 6719 NE 139th Pl Vancouver, WA | 3.0 | 2.5 | 1492 | $2,570 | $1.72 | 43d | 1 | 0.65mi |
| 4303 NE 136th Ave Vancouver, WA | 3.0 | 2.5 | 1736 | $2,500 | $1.44 | 43d | 1 | 0.77mi |
| 11716 NE 49th St Vancouver, WA | 1.0–3.0 | 1.0–2.5 | 1090 | $2,250 | $2.06 | 7d | 15 | 0.81mi |
| 7415 NE 136th Ave Vancouver, WA | 3.0 | 2.5 | 1674 | $2,495 | $1.49 | 44d | 1 | 0.93mi |
| 11328 NE 51st Cir Vancouver, WA | 2.0–4.0 | 1.0–2.0 | 1086 | $1,862 | $1.71 | 7d | 8 | 0.94mi |
| 11603 NE 71st St Vancouver, WA | 1.0–3.0 | 1.0–2.0 | 991 | $2,563 | $2.59 | 1d | 55 | 1.02mi |
| 11205 NE 49th St Unit 11209B Vancouver, WA | 2.0 | 1.0 | 1104 | $1,675 | $1.52 | 12d | 1 | 1.08mi |
| 3605 NE 141st Ave Vancouver, WA | 3.0 | 2.0 | 1126 | $2,500 | $2.22 | 2d | 1 | 1.16mi |
| 6900 NE 154th Ave Vancouver, WA | 1.0–3.0 | 1.0–2.0 | 921 | $2,450 | $2.66 | 1d | 13 | 1.21mi |
| 15413 NE 47th Cir Vancouver, WA | 3.0 | 2.0 | 1362 | $2,569 | $1.89 | 43d | 1 | 1.26mi |
| 7815 NE 117th Ave Unit 7815-2 Vancouver, WA | 3.0 | 1.5 | 1200 | $1,845 | $1.54 | 43d | 1 | 1.31mi |
| 12317 NE 33rd St Vancouver, WA | 4.0 | 3.0 | 1700 | $2,739 | $1.61 | 43d | 1 | 1.32mi |
| 6117 NE 105th Ave Vancouver, WA | 3.0 | 2.5 | 1521 | $2,249 | $1.48 | 21d | 1 | 1.37mi |
| 8313 NE 134th Pl Vancouver, WA | 3.0 | 3.0 | 1520 | $2,650 | $1.74 | 43d | 1 | 1.39mi |
| 4202 NE Morrow Rd #201 Vancouver, WA | 3.0 | 2.0 | 1155 | $2,345 | $2.03 | 43d | 1 | 1.41mi |
| 4202 NE Morrow Rd Vancouver, WA | 3.0 | 2.0 | 1155 | $2,395 | $2.07 | 43d | 1 | 1.41mi |
| 4231 NE 157th Ct Vancouver, WA | 3.0 | 2.5 | 2042 | $2,995 | $1.47 | 43d | 1 | 1.44mi |
| 6001 NE 102nd Ave Vancouver, WA | 2.0–3.0 | 2.0 | 1125 | $1,850 | $1.64 | 1d | 6 | 1.45mi |
| 10300 NE 61st Cir Unit 10404 Vancouver, WA | 3.0 | 2.5 | 1653 | $2,495 | $1.51 | 7d | 1 | 1.46mi |
| 10300 NE 61st Cir Unit 10315 Vancouver, WA | 3.0 | 2.5 | 1486 | $2,495 | $1.68 | 23d | 1 | 1.46mi |
| 11703 NE 32nd St Vancouver, WA | 2.0 | 2.0 | 1158 | $2,095 | $1.81 | 43d | 1 | 1.48mi |
| 3109 NE 118th Ave Vancouver, WA | 3.0 | 2.5 | 1833 | $2,595 | $1.42 | 43d | 1 | 1.48mi |
Listing history 21 events
-
2026-06-18days on market $85,000 Active 49 DOM
-
2026-06-17days on market $85,000 Active 48 DOM
-
2026-06-16days on market $85,000 Active 47 DOM
-
2026-06-15days on market $85,000 Active 46 DOM
-
2026-06-13days on market $85,000 Active 44 DOM
-
2026-06-13days on market $85,000 Active 43 DOM
-
2026-06-09days on market $85,000 Active 40 DOM
-
2026-06-08days on market $85,000 Active 39 DOM
-
2026-06-07days on market $85,000 Active 38 DOM
-
2026-06-03days on market $85,000 Active 34 DOM
-
2026-06-02days on market $85,000 Active 33 DOM
-
2026-06-01days on market $85,000 Active 32 DOM
-
2026-05-31days on market $85,000 Active 31 DOM
-
2026-05-10status Active 652-char remark
-
2026-05-05status Pending 652-char remark
-
2026-04-26$85,000 Active 652-char remark
-
2006-08-11soldstatus $54,000 194-char remark
Show marketing remark (194 chars)
Time to cancel the rental contract and get some separation with your own unattached home. Corner lot, fully fenced, carport, shed, deck, recent paint & hotwater heater, 2004. Reefer stays.
-
2006-08-11soldstatus $54,000
Show marketing remark (194 chars)
Time to cancel the rental contract and get some separation with your own unattached home. Corner lot, fully fenced, carport, shed, deck, recent paint & hotwater heater, 2004. Reefer stays.
-
2006-07-17historical 194-char remark
Show marketing remark (194 chars)
Time to cancel the rental contract and get some separation with your own unattached home. Corner lot, fully fenced, carport, shed, deck, recent paint & hotwater heater, 2004. Reefer stays.
-
2005-07-27$54,000 194-char remark
Show marketing remark (194 chars)
Time to cancel the rental contract and get some separation with your own unattached home. Corner lot, fully fenced, carport, shed, deck, recent paint & hotwater heater, 2004. Reefer stays.
-
2005-07-27$54,000
Show marketing remark (194 chars)
Time to cancel the rental contract and get some separation with your own unattached home. Corner lot, fully fenced, carport, shed, deck, recent paint & hotwater heater, 2004. Reefer stays.
ⓘ Source: listings_history table (triggers on properties + properties_extension) + one-shot
backfill from property_details.listing_events for pre-trigger history.
Tax reassessment forecast WA · Resets to sale price
- Current annual tax
- $400 · $33/mo
- Projected year-2 tax
- $833 · $69/mo
- Expected delta
- +$433/yr (+$36/mo · 108.4%)
ⓘ Screening estimate from a state-policy table — verify with the county assessor before closing.
Nearby sold comps map
Loading sold comps map…
Walkable amenities ~0.75 mi
Loading nearby amenities…
Taxation est. · year 1
- Rental income
- $27,512
- − Mortgage interest
- −$4,761
- − Property taxes
- −$400
- − Insurance
- −$425
- − Repairs & maintenance
- −$2,201
- − Management
- −$2,201
- − Depreciation
- −$2,473
- Taxable income
- $15,051
- Est. tax owed @ 24.0%
- −$3,612
- After-tax cash flow
- $11,948/yr
For passive investors: Depreciation is non-cash, so a rental often shows a tax loss while cash-flowing — sheltering income. Rental losses are passive: they offset passive income freely, and up to $25,000/yr can offset ordinary (W-2) income if you actively participate and your MAGI is under $100k (phasing out to $0 by $150k); unused losses carry forward. On sale, claimed depreciation is recaptured at up to 25%, and gains may owe capital-gains tax (a 1031 exchange can defer both). Figures are a year-1 estimate at your 24.0% rate — not tax advice; consult a CPA.
Schools (NCES district)
- District
- Evergreen School District (Clark)
- NCES district ID
- 5302700
- Math proficiency
- 41% ▼ -3.00%
- Reading proficiency
- 51% ▼ -3.00%
- Median HH income
- $59,418
- Composite
- 42.53/100
- National rank
- #6859
- State rank
- #164 of 291 in WA
Livability — Vancouver
- Score
- 82/100
- State rank
- #62
- US rank
- #1133
Category grades
Schools grade is shown separately in the Schools card above.
Census & demographics
- Census place
- Vancouver, WA
- County
- Clark County · 513,189 people
- City population
- 360,195
- Metro
- Portland-Vancouver-Hillsboro, OR-WA
- Population (ZIP)
- 68,305
- Household income
- $99,918
- Rent vs Own
- Severe rent burden
- 1618.0
Population outlook (Clark County) Hauer SSP2
- Today (2025)
- 529,610 people
- By 2030
- 563,242 · +6.4%
- By 2040
- 625,905 · +18.2%
- By 2050
- 681,558 · +28.7%
- By 2075
- 805,967 · +52.2%
- By 2100
- 877,450 · +65.7%
Race, ethnicity, and origin ACS 2023
- Neighborhood character
- Predominantly White (69%)
- Race & ethnicity
- White 69% Hispanic / Latino 15% Two or more races 13% Asian 6% Black 2% Pacific Islander 1%
- Hispanic origin (detail)
- Mexican 12%
- Common ancestry
- Portuguese 3% Subsaharan African 3% Scotch-Irish 2%
- Foreign-born
- 13% · Canada, Vietnam, South Korea
- Languages at home
- 79% English-only · Spanish 8% Russian/Polish/Slavic 6% Other Asian/Pacific 2%
Political lean MEDSL · Clark
- 2024 margin
- Lean D (+7.0) · D 52.1% · R 45.1% · Other 2.8%
- 2008→2024 swing
- +0.9pp no change · 2008: 6.1pp · 2024: 7.0pp
- All cycles
- 2024: D+7.0 2020: D+5.1 2016: D+0.1 2012: D+0.1 2008: D+6.1
Not yet ingested
- Civics
- —
Market trends
- HPI YoY
- ▼ -303.95%
- Current HPI
- 307.0529
- Rent YoY
- ▲ 0.63%
- Metro
- Portland-Vancouver-Hillsboro, OR-WA
- State GDP YoY
- ▲ 4.65%
- F500 in state
- 22
Industry mix (Fortune 500 HQ in WA)
| Industry | F500 HQs | Revenue |
|---|---|---|
| Retail | 2 | $269B |
|
||
| Technology / Retail | 1 | $638B |
|
||
| Technology | 1 | $245B |
|
||
| Telecommunications | 1 | $38B |
|
||
| Food / Beverage | 1 | $36B |
|
||
| Automotive / Trucks | 1 | $34B |
|
||
Price history
+57.4% since first listed8 events — show timeline
- 2026-05-10 Relisted — RMLS
- 2026-05-05 Pending — RMLS
- 2026-04-26 Listed $85,000 RMLS
- 2006-08-11 Sold (MLS) $54,000 NWMLS as Distributed by MLS Grid
- 2006-08-11 Sold (MLS) $54,000 RMLS
- 2006-07-17 Delisted — RMLS
- 2005-07-27 Listed $54,000 NWMLS as Distributed by MLS Grid
- 2005-07-27 Listed $54,000 RMLS
Property tax history
-0.8%/yrLatest (2026): $400 · +24.6% YoY. Source: county tax records.
Cash-flow waterfall
monthlySold comps — $/sqft
last 12 mo · ≤1 miLoading sold comps…