2139 Groton Rd · Pocomoke City, MD
Flood risk 1/10 · Minimal
- FEMA flood zone
- X (unshaded)
- Chance of flooding over 30 yrs
- 0.0%
- Est. flood insurance / yr
- $507 – $1,088
Fire risk 3/10 · Minor
- Est. fire insurance / yr
- $755 – $1,403
Heat risk 8/10 · Major
- Hot days now (above 102°F)
- 7 days/yr
- Hot days in 30 yrs
- 18 days/yr
Wind risk 8/10 · Major
- Chance of severe wind over 30 yrs
- 80.0%
Air-quality risk 2/10 · Minimal
- Unhealthy air days now
- 0 days/yr
- Unhealthy air days in 30 yrs
- 1 days/yr
Risk factors via First Street. Map © Google.
Why this score? — see what drove the B- grade
The composite is a weighted blend of 9 inputs, each scored 0–100. Each bar is that input's sub-score; the figure is the points it added to the 100-point composite (weight × sub-score).
- Cash flow +30.0/30.0
- 1% rule +10.0/10.0
- DSCR +10.0/10.0
- ARV discount +7.5/15.0
- Livability +3.6/5.0
- Schools +3.3/10.0
- Rent growth +2.5/5.0
- Condition / age +2.5/5.0
- Appreciation +0.0/10.0
$80,000
🖨 Deal sheet 📄 Offer letter ✓ Due diligence
Listing remarks
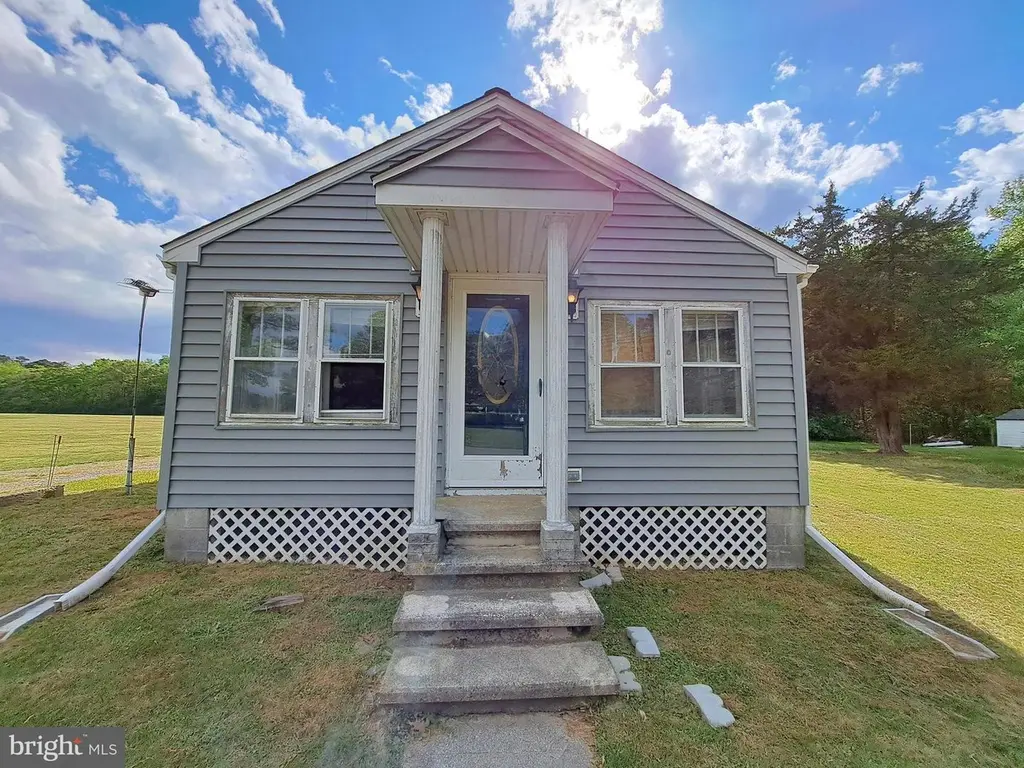
Discover this Cape Cod-style home nestled in the desirable Jenkins Orchard neighborhood. Built in 1953, this detached home offers 1,494 sq. ft. of finished living space, offering a blend of classic character and modern potential. With two spacious bedrooms and two full bathrooms, this property is set for both living and investment opportunities. Venture inside to find a spacious living room that leads to the dining area. The entry-level bedroom provides convenience, while the jetted tub in the upper-level bathroom provides relaxation, enhancing the home's appeal for potential renters or future buyers. The exterior features a private, level lot with a front yard and a rear yard, offering ple
Key facts
- Convenient shed
- Private level lot
- Jetted tub
Tags
Property features AI
Exterior
- Parking: Off-street parking
- Utilities: Water source: Well; Sewer: Septic; Hot water: Natural gas and other
- Home design: Detached structure; Above-grade finished living area reported (assessor)
- Construction: Frame construction with vinyl and aluminum siding; Crawl space foundation
- Exterior features: Front yard and rear yard; Level, private lot; Multiple balconies; Deck(s); Shed; Not in a federal flood zone
Interior
- Kitchen: Kitchen with table space
- Bedrooms: One bedroom on the main level; One bedroom on the first upper level
- Flooring: Wood floors
- Bathrooms: Two full bathrooms (one on main level, one on first upper level)
- Heating & cooling: Heating: Other (fuel type listed as Other); Hot water: Natural gas and other
- Interior features: Jetted tub in bath; Dining area; Entry-level bedroom; Kitchen with table space; Wood floors; Drywall walls and ceilings
Neighborhood map
What this means for you Summary
Snapshot
- This is a 2-bed/1.0-bath single-family listed at $80k.
Deal economics
- At list price, monthly cash flow is $901 ($11k/yr) — positive.
- The deal already cash-flows at list — no discount required.
- Meets the 1% rule at list price ($2k rent vs $80k).
- Cap rate 19.8% vs local median 5.6% in Pocomoke City — top-decile yield for the area; either an underpriced asset or a hidden risk that comps aren't pricing in. Stress-test before assuming the spread holds.
Location & tenants
- Location reads 71/100 on livability (#157 in MD) — a middle-class / working-renter tenant base. Strengths: cost of living A+, health & safety A+, housing A-; Watch: employment D+, crime F, amenities F.
- Worcester County Public Schools (town): math 30% / reading 44% proficiency, ranked #6 of 24 in MD (top 25%) — families likely to look elsewhere, expect single-tenant / working-renter base with shorter leases.
- Market conditions: 69 active listings in the ZIP; 8 comparable units currently listed for rent nearby; rentals leasing fast (median 14d on market — plan ~1-2 weeks tenant-placement turnaround); 354 units permitted in Worcester County in 2024 (6 in 5+ unit buildings).
Forward outlook
- Local home prices are declining (-3.0%/yr); year-one equity from $553 of loan paydown is wiped out by about $2k of value loss. Plan a longer hold.
- Worcester County population projected to shrink 4% by 2050 — rents likely to lag national; underwrite the cash flow, not the appreciation.
- At projected returns (-3.0% appreciation + 3.0% rent growth), your $22k cash investment doubles in ~3 years — after that, you're playing with house money.
Negotiation context
- Only 12 days on market — expect competitive offers; lowballing is unlikely to land.
Risks & watch-outs
- Watch-outs: built in 1953 — expect roof / HVAC / electrical / plumbing capex.
- Climate carrying-cost: severe wind risk, 80% chance of damaging wind over 30y; extreme-heat days projected 7→18/yr by 2055 (HVAC capex compounding) — expect insurance premiums to compound above CPI over the hold.
Questions for the listing agent
- Built in 1953 — when were the roof, HVAC, electrical panel, plumbing, and water heater last replaced?
- Is there a deadline driving the sale (1031 exchange, divorce, estate, relocation)? That informs how much negotiation room exists.
- Crime grade is F in this area — have there been break-ins, vandalism, or insurance claims at this property in the last 3 years? What carrier currently insures it and at what premium?
- What's the average days-on-market for RENTAL listings here right now (not sales)? A rising rental-DOM trend means longer vacancies and softer asking-rent achievability than the comps imply.
- What's the recent tenant-quality profile in this submarket — average credit score on applications, eviction rate, late-payment / NSF rate, and stable-employment percentage? A property-management company in the area should have these aggregated.
- How much new for-sale + rental construction is in the pipeline within 1–3 miles? Heavy new supply typically softens prices + rents 12–24 months out; constrained supply supports both.
Investment metrics
- 1% rule
- 2.27% ✓
- Cap rate
- 19.81%
- Cash-on-cash
- 48.28%
- DSCR
- 3.15
- GRM
- 3.7
CMA / ARV
- ARV (median comp)
- $212,149
- List price
- $80,000
- Delta
- -62.29%
- Verdict
- UNDERPRICED
- Comps
- 20 within 1.0 mi
Show comp detail 6 sales within ~0.75 mi
| Address | Dist | Beds/Ba | Sqft | Sold | Price | $/sf | Match |
|---|---|---|---|---|---|---|---|
| 2139 Groton Rd | 0.00mi | 2/2.0 | 1,494 (0%) | 1mo | $102,900 | $69 | 95 |
| 2240 Bypass Rd | 0.38mi | 3/2.0 (+1) | 1,632 (+9%) | 0mo | $330,000 | $202 | 58 |
| 201 Payne Ave | 0.69mi | 3/2.0 (+1) | 1,374 (-8%) | 15mo | $185,000 | $135 | 33 |
| 2329 Bypass Rd | 0.62mi | 3/2.0 (+1) | 1,288 (-14%) | 8mo | $210,000 | $163 | 33 |
| 9 Central Ave | 0.73mi | 3/1.0 (+1) | 1,320 (-12%) | 10mo | $212,000 | $161 | 33 |
| 2027 Bypass Rd | 0.48mi | 3/2.0 (+1) | 1,272 (-15%) | 20mo | $255,000 | $200 | 27 |
Match score weights: distance 35% · size 25% · config 20% · recency 20%. Top-matched comps best support the ARV.
Projected returns pro-forma
-3.0% appreciation · 3.0% rent growth · sell at horizon
- IRR
- 45.8%
- Equity multiple
- 2.98×
- Total profit
- $44,454
- Equity at exit
- $11,928
- IRR
- 51.6%
- Equity multiple
- 6.03×
- Total profit
- $112,692
- Equity at exit
- $6,917
Cash invested: $22,400 (down + closing). Projections, not guarantees.
Landlord ↔ Tenant lean methodology
- Overall (STATE)
- 27 Tenant-Leaning
- State Maryland
- 27 Tenant-Leaning · D+14
- County
- — inherits STATE
- City
- — inherits STATE
ZIP-level market 21851
- Home prices YoY
- -4.0%
- Active inventory
- 69
- Price-to-rent
- 3.7×
Monthly cashflow live
- Estimated rent
- $1,820 high interval (Pro) →
- Mortgage (P&I)
- −$420
- Tax from tax record
- −$83 /mo · $1,002/yr
- Insurance
- −$33
- HOA
- −$0
- Vacancy / Maint / Mgmt
- −$382
- Net cashflow
- $901
Break-even live
UW: 25.0% down · 7.5% · 30yr · 1.5% tax · 5.0% vac · 8.0% maint · 8.0% mgmt
Financing live
Cash to close
- Down payment
- $20,000
- Closing costs
- $2,400
- Reserves months
- —
- Total cash needed
- —
Loan-product check · same deal, 3 products live
Conventional
25% down · 7.5% · 30yr
- Down + closing
- —
- Monthly P&I
- —
- Monthly cashflow
- —
- DSCR
- —
- Eligible?
- —
Personal DTI + credit; lowest rate.
DSCR
20% down · 8.5% · 30yr
- Down + closing
- —
- Monthly P&I
- —
- Monthly cashflow
- —
- DSCR
- —
- Eligible?
- —
No personal income docs; deal must DSCR.
Hard money
10% down · 12.0% · 12mo
- Down + closing
- —
- Monthly P&I
- —
- Monthly cashflow
- —
- DSCR
- —
- Eligible?
- —
Short-term bridge; refi at stabilization.
Rent comps 8 comps
| Address | Beds | Baths | Sqft | Rent | $/sqft | DOM | Units | Dist |
|---|---|---|---|---|---|---|---|---|
| 1513 Princess Anne Ln Pocomoke City, MD | 3.0 | 2.0 | 1542 | $1,950 | $1.26 | 44d | 1 | 0.69mi |
| 202 Carsons Ct Pocomoke City, MD | 3.0 | 2.0 | 1472 | $1,695 | $1.15 | 13d | 1 | 0.84mi |
| 241 Morgans Ct Pocomoke City, MD | 3.0 | 2.5 | 1304 | $1,795 | $1.38 | 13d | 1 | 0.89mi |
| 242 Morgans Ct Pocomoke City, MD | 3.0 | 2.5 | 1304 | $1,795 | $1.38 | 13d | 1 | 0.90mi |
| 2005 S Old Mill Dr Pocomoke City, MD | 3.0 | 2.0 | 1373 | $1,895 | $1.38 | 13d | 1 | 1.30mi |
| 2007 S Old Mill Dr Pocomoke City, MD | 3.0 | 2.0 | 1302 | $1,895 | $1.46 | 13d | 1 | 1.31mi |
| 621 Cedar St Pocomoke City, MD | 3.0 | 2.5 | 1352 | $2,195 | $1.62 | 13d | 1 | 1.32mi |
| 417 Walnut St Unit 2 Pocomoke City, MD | 1.0 | 1.0 | 900 | $995 | $1.11 | 21d | 1 | 1.42mi |
Listing history 2 events
-
2026-05-11status Pending 1200-char remark
-
2026-04-29$80,000 Active 1200-char remark
ⓘ Source: listings_history table (triggers on properties + properties_extension) + one-shot
backfill from property_details.listing_events for pre-trigger history.
Tax reassessment forecast MD · Partial reset (capped growth)
- Current annual tax
- $1,002 · $83/mo
- Projected year-2 tax
- $1,002 · $83/mo
- Expected delta
- $0/yr ($0/mo · 0.0%)
ⓘ Screening estimate from a state-policy table — verify with the county assessor before closing.
Climate risk First Street
- Flood 1/10 Low FEMA zone X (unshaded) · 0% chance over 30 yrs
- Wildfire 3/10 Moderate
- Heat 8/10 Severe 7 d/yr ≥102°F today · 18 d/yr by 30 yrs out
- Wind 8/10 Severe 80% chance of damaging wind over 30 yrs
- Air quality 2/10 Low 0 unhealthy d/yr today · 1 by 30 yrs out
Nearby sold comps map
Loading sold comps map…
Walkable amenities ~0.75 mi
Loading nearby amenities…
Taxation est. · year 1
- Rental income
- $21,837
- − Mortgage interest
- −$4,481
- − Property taxes
- −$1,002
- − Insurance
- −$400
- − Repairs & maintenance
- −$1,747
- − Management
- −$1,747
- − Depreciation
- −$2,327
- Taxable income
- $10,132
- Est. tax owed @ 24.0%
- −$2,432
- After-tax cash flow
- $8,383/yr
For passive investors: Depreciation is non-cash, so a rental often shows a tax loss while cash-flowing — sheltering income. Rental losses are passive: they offset passive income freely, and up to $25,000/yr can offset ordinary (W-2) income if you actively participate and your MAGI is under $100k (phasing out to $0 by $150k); unused losses carry forward. On sale, claimed depreciation is recaptured at up to 25%, and gains may owe capital-gains tax (a 1031 exchange can defer both). Figures are a year-1 estimate at your 24.0% rate — not tax advice; consult a CPA.
Schools (NCES district)
- District
- Worcester County Public Schools
- NCES district ID
- 2400720
- Math proficiency
- 30% ▼ -25.00%
- Reading proficiency
- 44% ▼ -20.00%
- Median HH income
- $56,748
- Composite
- 32.6/100
- National rank
- #5672
- State rank
- #6 of 24 in MD
Livability — Pocomoke City
- Score
- 71/100
- State rank
- #157
- US rank
- #7066
Category grades
Schools grade is shown separately in the Schools card above.
Census & demographics
- Population (ZIP)
- 7,252
Population outlook (Worcester County) Hauer SSP2
- Today (2025)
- 51,363 people
- By 2030
- 51,191 · -0.3%
- By 2040
- 50,459 · -1.8%
- By 2050
- 49,451 · -3.7%
- By 2075
- 48,533 · -5.5%
- By 2100
- 44,223 · -13.9%
Race, ethnicity, and origin ACS 2023
- Neighborhood character
- Diverse neighborhood (Simpson 0.58)
- Race & ethnicity
- White 54% Black 37% Two or more races 5% Asian 2% Hispanic / Latino 2%
- Common ancestry
- Scandinavian 2% Romanian 2% Scotch-Irish 2%
- Foreign-born
- 5% · Canada, Dominican Republic, Mexico
- Languages at home
- 93% English-only · Other Asian/Pacific 1% Spanish 1% Vietnamese 1%
Political lean MEDSL · Worcester
- 2024 margin
- Strong R (+22.0) · D 38.0% · R 60.0% · Other 2.0%
- 2008→2024 swing
- -6.5pp toward R · 2008: -15.5pp · 2024: -22.0pp
- All cycles
- 2024: R+22.0 2020: R+19.0 2016: R+27.9 2012: R+18.3 2008: R+15.5
Not yet ingested
- Civics
- —
Market trends
- HPI YoY
- ▼ -10.03%
- Current HPI
- 243.2329
- Rent YoY
- —
- Metro
- —
- State GDP YoY
- ▲ 2.97%
- F500 in state
- 12
Industry mix (Fortune 500 HQ in MD)
| Industry | F500 HQs | Revenue |
|---|---|---|
| Aerospace / Defense | 1 | $71B |
|
||
| Utilities | 1 | $25B |
|
||
| Hotels | 1 | $24B |
|
||
| Consumer Goods | 1 | $7B |
|
||
| Real Estate | 1 | $6B |
|
||
| Chemicals | 1 | $2B |
|
||
Price history
+28.6% since first listed3 events — show timeline
- 2026-05-26 Sold (MLS) $102,900 BRIGHT MLS
- 2026-05-11 Pending — BRIGHT MLS
- 2026-04-29 Listed $80,000 BRIGHT MLS
Property tax history
+4.3%/yrLatest (2025): $1,002 · +0.7% YoY. Source: county tax records.
Cash-flow waterfall
monthlySold comps — $/sqft
last 12 mo · ≤1 miLoading sold comps…