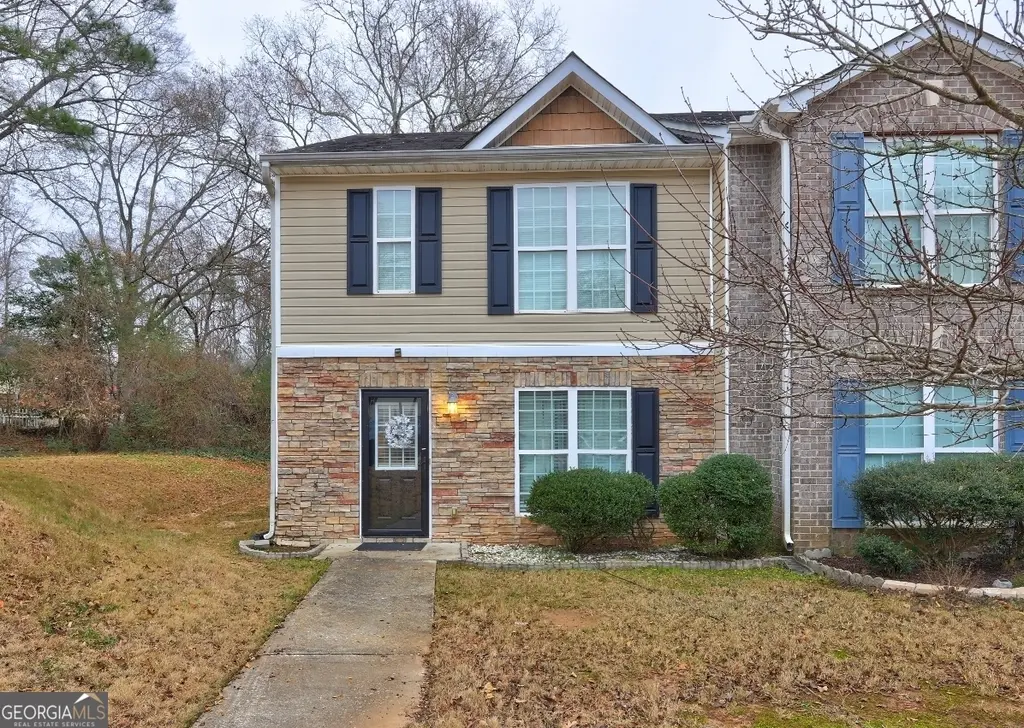
8424 Carlington Ln · Jonesboro, GA
Flood risk 1/10 · Minimal
- FEMA flood zone
- X (unshaded)
- Chance of flooding over 30 yrs
- 0.0%
- Est. flood insurance / yr
- $507 – $1,088
Fire risk 1/10 · Minimal
- Est. fire insurance / yr
- $963 – $1,789
Heat risk 6/10 · Moderate
- Hot days now (above 105°F)
- 7 days/yr
- Hot days in 30 yrs
- 18 days/yr
Wind risk 5/10 · Moderate
- Chance of severe wind over 30 yrs
- 26.0%
Air-quality risk 4/10 · Minor
- Unhealthy air days now
- 5 days/yr
- Unhealthy air days in 30 yrs
- 6 days/yr
Risk factors via First Street. Map © Google.
Why this score? — see what drove the D+ grade
The composite is a weighted blend of 9 inputs, each scored 0–100. Each bar is that input's sub-score; the figure is the points it added to the 100-point composite (weight × sub-score).
- Cash flow +15.7/30.0
- ARV discount +12.9/15.0
- DSCR +4.8/10.0
- 1% rule +4.3/10.0
- Livability +3.6/5.0
- Rent growth +3.0/5.0
- Condition / age +2.5/5.0
- Schools +1.3/10.0
- Appreciation +0.0/10.0
$185,000
🖨 Deal sheet 📄 Offer letter ✓ Due diligence
Listing remarks
This Is A Must See 3 Bedroom 2.5 Bath Corner Townhouse - Open Floor Plan - LVP Flooring - Huge Living Room - Eat-n-Kitchen with Breakfast Bar - Private Fenced Patio - Move In Ready - Call Agent Today For Private Showing!!
Key facts
- Open floor plan
- Huge living room
- Corner townhouse
Tags
Property features AI
Finance
- Financial info: Financing options include Cash, Conventional, FHA, and VA
- HOA & community: Has association; Association covers grounds maintenance
Exterior
- Parking: Open parking; Parking pad
- Utilities: Public water; Public sewer; Electricity available; Cable available; High speed internet available; Phone available
- Home design: Townhouse (residential); Two levels; House structure; Resale condition
- Construction: Built in 2007; Vinyl siding; Composition roof
- Exterior features: Patio; Back yard fencing; Privacy fencing; Level lot
Interior
- Kitchen: Breakfast area; Solid surface counters; Dishwasher; Microwave
- Bedrooms: 3 bedrooms
- Flooring: Carpet; Laminate
- Bathrooms: 2 full bathrooms and 1 half bathroom (total 3)
- Heating & cooling: Central heating; Central air conditioning
- Interior features: High ceilings; Walk-in closet(s); Family room
- Laundry & utility: Laundry closet
Neighborhood map
What this means for you Summary
Snapshot
- This is a 3-bed/2.0-bath townhouse listed at $185k.
Deal economics
- At list price, monthly cash flow is $80 ($962/yr) — positive.
- The deal already cash-flows at list — no discount required.
- To meet the 1% rule (rent ≥ 1% of price), the offer needs to be $172k (6.9% below list).
- Recommended offer: $172k (6.9% below list) — sets the bar for 1% rule.
- Cap rate 6.8% vs local median 5.0% in Jonesboro — top-decile yield for the area; either an underpriced asset or a hidden risk that comps aren't pricing in. Stress-test before assuming the spread holds.
Location & tenants
- Location reads 72/100 on livability (#63 in GA) — a middle-class / working-renter tenant base. Strengths: cost of living A+, housing A-; Watch: crime C-, employment D, commute F.
- Clayton County (suburban): math 11% / reading 20% proficiency, ranked #155 of 174 in GA (top 89%) — low school quality limits family demand, transient renter base, plan for 1-2y turnover; 78% free/reduced lunch — lower-income household profile, screen leases tightly.
- Zoned schools: Arnold Elementary School (math 17% / reading 17%, grade F, #936 of 1,228 statewide, top 79%, 439 students, 90% FRL); M. D. Roberts Middle School (math 22% / reading 37%, grade F, #249 of 470 statewide, top 55%, 852 students, 90% FRL); Jonesboro High School (math 12% / reading 17%, grade F, #315 of 424 statewide, top 76%, 1,535 students, 91% FRL).
- Market conditions: Rents rising (+2.1%/yr); 265 active listings in the ZIP; 20 comparable units currently listed for rent nearby; rentals at typical pace (median 24d on market — plan ~3-4 weeks tenant-placement turnaround); 865 units permitted in Clayton County in 2024 (448 in 5+ unit buildings).
- This rent runs 31% of the median local income ($67k/yr) — at the standard rent-burdened threshold; future hikes will face affordability resistance.
Forward outlook
- Local home prices are declining (-3.0%/yr); year-one equity from $1k of loan paydown is wiped out by about $6k of value loss. Plan a longer hold.
- Clayton County population projected at +29% by 2050 — long-run rental-demand tailwind backs the buy-and-hold thesis.
Negotiation context
- It's been on market 20 days — a 2% lower offer ($182k) is reasonable based on typical stale-listing flexibility.
- 9 sale attempts since 9y ago with the ask held roughly flat each time — persistent listings suggest the price (not the market) is what's stuck; bring a comps-based counter.
Risks & watch-outs
- Climate carrying-cost: moderate wind risk, 26% chance of damaging wind over 30y; extreme-heat days projected 7→18/yr by 2055 (HVAC capex compounding) — expect insurance premiums to compound above CPI over the hold.
Questions for the listing agent
- Is there a deadline driving the sale (1031 exchange, divorce, estate, relocation)? That informs how much negotiation room exists.
- Schools are F-rated, which usually means shorter tenancies and higher turnover. Who's the typical renter profile here, and what's been the actual vacancy rate?
- The area grade is low — what's the realistic commute time and amenity access for the typical tenant pool here? Any planned neighborhood developments (good or bad) we should know about?
- What's the average days-on-market for RENTAL listings here right now (not sales)? A rising rental-DOM trend means longer vacancies and softer asking-rent achievability than the comps imply.
- What's the recent tenant-quality profile in this submarket — average credit score on applications, eviction rate, late-payment / NSF rate, and stable-employment percentage? A property-management company in the area should have these aggregated.
- How much new for-sale + rental construction is in the pipeline within 1–3 miles? Heavy new supply typically softens prices + rents 12–24 months out; constrained supply supports both.
Investment metrics
- 1% rule
- 0.93% ✗
- Cap rate
- 6.81%
- Cash-on-cash
- 1.86%
- DSCR
- 1.08
- GRM
- 8.9
CMA / ARV
- ARV (median comp)
- $210,073
- List price
- $185,000
- Delta
- -11.94%
- Verdict
- UNDERPRICED
- Comps
- 20 within 1.0 mi
Show comp detail 12 sales within ~0.75 mi
| Address | Dist | Beds/Ba | Sqft | Sold | Price | $/sf | Match |
|---|---|---|---|---|---|---|---|
| 8424 Carlington Ln | 0.00mi | 3/2.5 | 1,486 (0%) | 0mo | $180,000 | $121 | 98 |
| 8391 Carlington Ln | 0.08mi | 3/2.5 | 1,516 (+2%) | 4mo | $188,000 | $124 | 88 |
| 8368 Carlington Ln | 0.12mi | 3/2.5 | 1,526 (+3%) | 3mo | $165,000 | $108 | 85 |
| 1503 Oconnor Dr | 0.09mi | 3/2.5 | 1,408 (-5%) | 2mo | $215,000 | $153 | 84 |
| 8475 Douglass Trl | 0.17mi | 3/2.5 | 1,408 (-5%) | 8mo | $210,000 | $149 | 75 |
| 8383 Carlington Ln | 0.09mi | 3/2.5 | 1,516 (+2%) | 20mo | $185,500 | $122 | 74 |
| 8409 Carlington Ln | 0.04mi | 3/2.5 | 1,592 (+7%) | 13mo | $209,000 | $131 | 73 |
| 8430 Douglas Trl | 0.11mi | 3/2.5 | 1,408 (-5%) | 16mo | $239,000 | $170 | 71 |
| 8398 Douglass Trl | 0.07mi | 3/3.0 | 1,398 (-6%) | 20mo | $249,000 | $178 | 66 |
| 8473 Douglas Trl | 0.17mi | 3/2.5 | 1,408 (-5%) | 24mo | $250,000 | $178 | 62 |
| 8354 Carlington Ln | 0.15mi | 3/2.5 | 1,592 (+7%) | 21mo | $220,000 | $138 | 61 |
| 8348 Carlington Ln | 0.16mi | 2/2.5 (-1) | 1,646 (+11%) | 17mo | $205,000 | $125 | 53 |
Match score weights: distance 35% · size 25% · config 20% · recency 20%. Top-matched comps best support the ARV.
Projected returns pro-forma
-3.0% appreciation · 2.15% rent growth · sell at horizon
- IRR
- -14.3%
- Equity multiple
- 0.49×
- Total profit
- $-26,307
- Equity at exit
- $27,584
- IRR
- -7.0%
- Equity multiple
- 0.57×
- Total profit
- $-22,117
- Equity at exit
- $15,995
Cash invested: $51,800 (down + closing). Projections, not guarantees.
Landlord ↔ Tenant lean methodology
- Overall (STATE)
- 90 Strongly Landlord-Friendly
- State Georgia
- 90 Strongly Landlord-Friendly · R+3
- County
- — inherits STATE
- City
- — inherits STATE
ZIP-level market 30236
- Rents YoY
- 2.1%
- Active inventory
- 265
- Price-to-rent
- 8.9×
Monthly cashflow live
- Estimated rent
- $1,723 high interval (Pro) →
- Mortgage (P&I)
- −$970
- Tax from tax record
- −$233 /mo · $2,802/yr
- Insurance
- −$77
- HOA
- −$0
- Vacancy / Maint / Mgmt
- −$362
- Net cashflow
- $80
Break-even live
UW: 25.0% down · 7.5% · 30yr · 1.5% tax · 5.0% vac · 8.0% maint · 8.0% mgmt
Financing live
Cash to close
- Down payment
- $46,250
- Closing costs
- $5,550
- Reserves months
- —
- Total cash needed
- —
Loan-product check · same deal, 3 products live
Conventional
25% down · 7.5% · 30yr
- Down + closing
- —
- Monthly P&I
- —
- Monthly cashflow
- —
- DSCR
- —
- Eligible?
- —
Personal DTI + credit; lowest rate.
DSCR
20% down · 8.5% · 30yr
- Down + closing
- —
- Monthly P&I
- —
- Monthly cashflow
- —
- DSCR
- —
- Eligible?
- —
No personal income docs; deal must DSCR.
Hard money
10% down · 12.0% · 12mo
- Down + closing
- —
- Monthly P&I
- —
- Monthly cashflow
- —
- DSCR
- —
- Eligible?
- —
Short-term bridge; refi at stabilization.
Rent comps 20 comps
| Address | Beds | Baths | Sqft | Rent | $/sqft | DOM | Units | Dist |
|---|---|---|---|---|---|---|---|---|
| 8422 Carlington Ln Jonesboro, GA | 3.0 | 2.5 | 1529 | $1,545 | $1.01 | 15d | 1 | 0.03mi |
| 8261 Sunnydale Ln Jonesboro, GA | 3.0 | 2.5 | 1572 | $1,995 | $1.27 | 4d | 1 | 0.21mi |
| 8392 San Jose Trl Jonesboro, GA | 3.0 | 3.0 | 1801 | $1,785 | $0.99 | 5d | 1 | 0.35mi |
| 218 Wallis St Jonesboro, GA | 3.0 | 2.0 | 1464 | $1,545 | $1.06 | 24d | 1 | 0.64mi |
| 232 N Lake Dr Jonesboro, GA | 3.0 | 1.5 | 1133 | $1,595 | $1.41 | 1d | 1 | 0.67mi |
| 8691 Twin Oaks Dr Jonesboro, GA | 3.0 | 2.0 | 1752 | $1,790 | $1.02 | 18d | 1 | 0.73mi |
| 112 Burkshire Ct Unit A Jonesboro, GA | 2.0 | 1.0 | 877 | $1,095 | $1.25 | 43d | 1 | 0.74mi |
| 109 North Ave Jonesboro, GA | 1.0–2.0 | 1.0 | 881 | $1,495 | $1.70 | 1d | 3 | 0.86mi |
| 8212 Lullwater Ct Jonesboro, GA | 3.0 | 2.5 | 1772 | $2,200 | $1.24 | 24d | 1 | 0.98mi |
| 8212 Lullwater Ct Jonesboro, GA | 4.0 | 2.5 | 1772 | $2,200 | $1.24 | 44d | 1 | 0.98mi |
| 7830 N McDonough St Jonesboro, GA | 2.0 | 1.0 | 1000 | $1,350 | $1.35 | 43d | 1 | 1.03mi |
| 7830 N McDonough St Unit A4 Jonesboro, GA | 2.0 | 1.0 | 1000 | $1,550 | $1.55 | 43d | 1 | 1.04mi |
| 249 Wayne Ave Jonesboro, GA | 3.0 | 1.0 | 1117 | $1,395 | $1.25 | 43d | 1 | 1.08mi |
| 8240 Blackfoot Trl Jonesboro, GA | 4.0 | 2.0 | 1764 | $1,956 | $1.11 | 4d | 1 | 1.15mi |
| 267 Wayne Ave Jonesboro, GA | 4.0 | 2.0 | 1012 | $2,300 | $2.27 | 43d | 1 | 1.16mi |
| 407 Fayetteville Rd Jonesboro, GA | 2.0 | 1.0 | 896 | $1,375 | $1.53 | 24d | 1 | 1.17mi |
| 7847 Sugarland Dr Jonesboro, GA | 3.0 | 2.0 | 1430 | $1,750 | $1.22 | 16d | 1 | 1.22mi |
| 976 5th Ave Jonesboro, GA | 3.0 | 2.0 | 1496 | $2,000 | $1.34 | 5d | 1 | 1.29mi |
| 777 Jeb Stuart Dr Jonesboro, GA | 3.0 | 2.0 | 1040 | $1,700 | $1.63 | 44d | 1 | 1.43mi |
| 790 Dixon Rd Jonesboro, GA | 2.0 | 1.0–1.5 | 900 | $1,274 | $1.42 | 5d | 5 | 1.48mi |
Listing history 30 events
-
2026-05-14status Under Contract 221-char remark
-
2026-04-22$185,000 New 221-char remark
-
2025-04-30historical
-
2025-03-28price $210,000
-
2025-03-24price $190,000
-
2025-02-07price $200,000
-
2025-01-07$210,000 New
-
2024-12-19historical
-
2024-11-29$202,500 New
-
2024-11-10historical
-
2024-10-30price $202,500
-
2024-10-10$210,000 New
-
2024-08-31historical
-
2024-07-19$205,000 New
-
2024-07-18historical
-
2024-07-17price $205,500
-
2024-06-18$215,500 New
-
2024-02-29historical
-
2024-01-31price $235,500
-
2023-12-19price $215,500
-
2023-11-28price $239,500
-
2023-11-15$249,500 New
-
2020-10-14soldstatus $120,000
-
2017-12-27soldstatus $73,000
-
2017-12-22soldstatus $73,000 Sold
-
2017-12-22soldstatus $73,000 Sold
-
2017-11-14status Under Contract
-
2017-11-14status Pending
-
2017-11-08$70,000 New
-
2017-11-08$70,000 Active
ⓘ Source: listings_history table (triggers on properties + properties_extension) + one-shot
backfill from property_details.listing_events for pre-trigger history.
Tax reassessment forecast GA · Resets to sale price
- Current annual tax
- $2,802 · $233/mo
- Projected year-2 tax
- $2,802 · $233/mo
- Expected delta
- $0/yr ($0/mo · 0.0%)
ⓘ Screening estimate from a state-policy table — verify with the county assessor before closing.
Climate risk First Street
- Flood 1/10 Low FEMA zone X (unshaded) · 0% chance over 30 yrs
- Wildfire 1/10 Low
- Heat 6/10 Major 7 d/yr ≥105°F today · 18 d/yr by 30 yrs out
- Wind 5/10 Major 26% chance of damaging wind over 30 yrs
- Air quality 4/10 Moderate 5 unhealthy d/yr today · 6 by 30 yrs out
Nearby sold comps map
Loading sold comps map…
Walkable amenities ~0.75 mi
Loading nearby amenities…
Taxation est. · year 1
- Rental income
- $20,671
- − Mortgage interest
- −$10,363
- − Property taxes
- −$2,802
- − Insurance
- −$925
- − Repairs & maintenance
- −$1,654
- − Management
- −$1,654
- − Depreciation
- −$5,382
- Taxable loss
- −$2,107
- Est. tax savings @ 24.0%
- +$506
- After-tax cash flow
- $1,468/yr
For passive investors: Depreciation is non-cash, so a rental often shows a tax loss while cash-flowing — sheltering income. Rental losses are passive: they offset passive income freely, and up to $25,000/yr can offset ordinary (W-2) income if you actively participate and your MAGI is under $100k (phasing out to $0 by $150k); unused losses carry forward. On sale, claimed depreciation is recaptured at up to 25%, and gains may owe capital-gains tax (a 1031 exchange can defer both). Figures are a year-1 estimate at your 24.0% rate — not tax advice; consult a CPA.
Schools (NCES district)
- District
- Clayton County
- NCES district ID
- 1301230
- Math proficiency
- 11% ▼ -13.00%
- Reading proficiency
- 20% ▼ -9.00%
- Median HH income
- $42,266
- Composite
- 13.41/100
- National rank
- #9527
- State rank
- #155 of 174 in GA
Livability — Jonesboro
- Score
- 72/100
- State rank
- #63
- US rank
- #6030
Category grades
Schools grade is shown separately in the Schools card above.
Census & demographics
- County
- Clayton County · 230,153 people
- City population
- 93,280
- Metro
- Atlanta-Sandy Springs-Alpharetta, GA
- Population (ZIP)
- 50,089
- Household income
- $66,973
- Rent vs Own
- Severe rent burden
- 2024.0
Population outlook (Clayton County) Hauer SSP2
- Today (2025)
- 310,777 people
- By 2030
- 329,762 · +6.1%
- By 2040
- 368,052 · +18.4%
- By 2050
- 401,196 · +29.1%
- By 2075
- 472,488 · +52.0%
- By 2100
- 500,446 · +61.0%
Race, ethnicity, and origin ACS 2023
- Neighborhood character
- Diverse neighborhood (Simpson 0.56)
- Race & ethnicity
- Black 64% White 14% Hispanic / Latino 11% Two or more races 8% Asian 5%
- Hispanic origin (detail)
- Mexican 6% Puerto Rican 1%
- Common ancestry
- Slovak 1% Italian 1% Hispanic 1%
- Foreign-born
- 13% · Canada, Vietnam, China
- Languages at home
- 81% English-only · Spanish 10% Vietnamese 3% French/Haitian/Cajun 2%
Political lean MEDSL · Clayton
- 2024 margin
- Solid D (+69.2) · D 84.3% · R 15.1%
- 2008→2024 swing
- +2.8pp toward D · 2008: 66.4pp · 2024: 69.2pp
- All cycles
- 2024: D+69.2 2020: D+70.9 2016: D+71.9 2012: D+70.1 2008: D+66.4
Not yet ingested
- Civics
- —
Market trends
- HPI YoY
- ▼ -137.02%
- Current HPI
- 204.1778
- Rent YoY
- ▲ 2.15%
- Metro
- Atlanta-Sandy Springs-Alpharetta, GA
- State GDP YoY
- ▲ 2.66%
- F500 in state
- 28
Industry mix (Fortune 500 HQ in GA)
| Industry | F500 HQs | Revenue |
|---|---|---|
| Paper / Packaging | 2 | $29B |
|
||
| Retail | 1 | $160B |
|
||
| Transportation / Logistics | 1 | $91B |
|
||
| Airlines | 1 | $62B |
|
||
| Consumer Goods | 1 | $47B |
|
||
| Utilities | 1 | $25B |
|
||
Price history
+157.1% since first listed31 events — show timeline
- 2026-06-05 Sold (MLS) $180,000 GAMLS
- 2026-05-14 Pending — GAMLS
- 2026-04-22 Listed $185,000 GAMLS
- 2025-04-30 Listing Removed — GAMLS
- 2025-03-28 Price Changed $210,000 GAMLS
- 2025-03-24 Price Changed $190,000 GAMLS
- 2025-02-07 Price Changed $200,000 GAMLS
- 2025-01-07 Listed $210,000 GAMLS
- 2024-12-19 Listing Removed — GAMLS
- 2024-11-29 Listed $202,500 GAMLS
- 2024-11-10 Listing Removed — GAMLS
- 2024-10-30 Price Changed $202,500 GAMLS
- 2024-10-10 Listed $210,000 GAMLS
- 2024-08-31 Listing Removed — GAMLS
- 2024-07-19 Listed $205,000 GAMLS
- 2024-07-18 Listing Removed — GAMLS
- 2024-07-17 Price Changed $205,500 GAMLS
- 2024-06-18 Listed $215,500 GAMLS
- 2024-02-29 Listing Removed — GAMLS
- 2024-01-31 Price Changed $235,500 GAMLS
- 2023-12-19 Price Changed $215,500 GAMLS
- 2023-11-28 Price Changed $239,500 GAMLS
- 2023-11-15 Listed $249,500 GAMLS
- 2020-10-14 Sold (Public Records) $120,000 Public Records
- 2017-12-27 Sold (Public Records) $73,000 Public Records
- 2017-12-22 Sold (MLS) $73,000 GAMLS
- 2017-12-22 Sold (MLS) $73,000 FMLS
- 2017-11-14 Pending — GAMLS
- 2017-11-14 Pending — FMLS
- 2017-11-08 Listed $70,000 GAMLS
- 2017-11-08 Listed $70,000 FMLS
Property tax history
+8.3%/yrLatest (2025): $2,802 · -6.8% YoY. Source: county tax records.
Cash-flow waterfall
monthlySold comps — $/sqft
last 12 mo · ≤1 miLoading sold comps…