 🏗️ New Construction
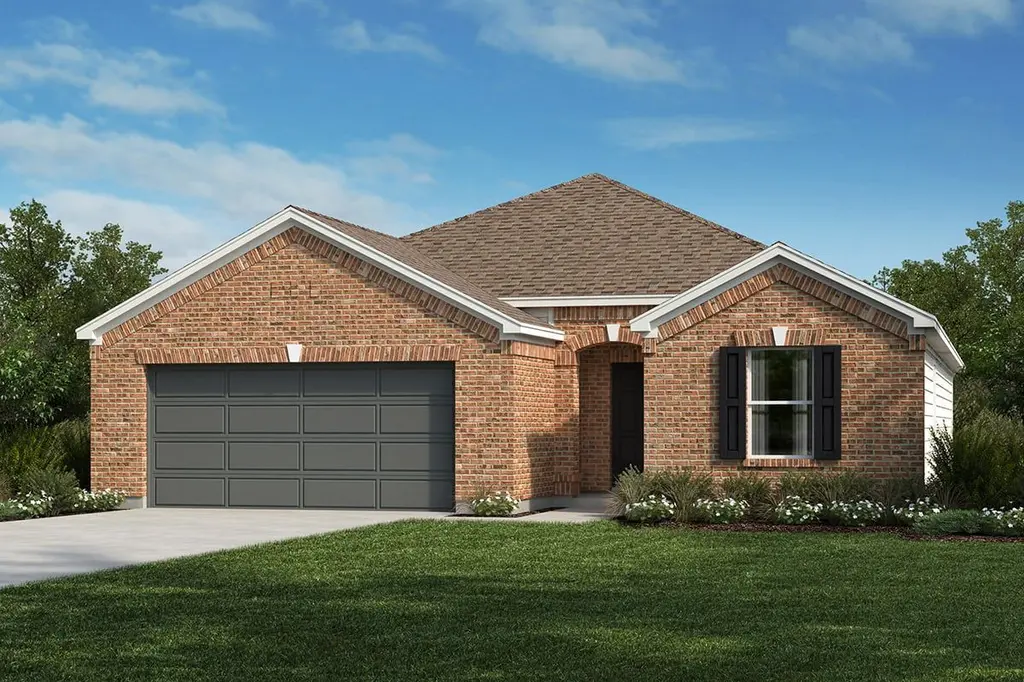
Plan 1792 Plan · Houston, TX
Flood risk 6/10 · Moderate
- FEMA flood zone
- X (unshaded)
- Chance of flooding over 30 yrs
- 0.71%
- Est. flood insurance / yr
- $507 – $1,088
Fire risk 4/10 · Minor
- Est. fire insurance / yr
- $1,222 – $2,270
Heat risk 9/10 · Severe
- Hot days now (above 111°F)
- 7 days/yr
- Hot days in 30 yrs
- 23 days/yr
Wind risk 9/10 · Severe
- Chance of severe wind over 30 yrs
- 99.0%
Air-quality risk 2/10 · Minimal
- Unhealthy air days now
- 1 days/yr
- Unhealthy air days in 30 yrs
- 1 days/yr
Risk factors via First Street. Map © Google.
Why this score? — see what drove the D- grade
The composite is a weighted blend of 9 inputs, each scored 0–100. Each bar is that input's sub-score; the figure is the points it added to the 100-point composite (weight × sub-score).
- Cash flow +8.5/30.0
- ARV discount +7.5/15.0
- Schools +4.6/10.0
- Condition / age +3.8/5.0
- Livability +3.7/5.0
- 1% rule +2.6/10.0
- DSCR +2.3/10.0
- Rent growth +2.1/5.0
- Appreciation +0.0/10.0
$306,995
🖨 Deal sheet (PDF) 📄 Offer letter ✓ Due diligence
Listing remarks MLS
* Walk-in kitchen pantry * Open floor plan * Front porch * Extra storage space * 6-panel interior doors * Stainless steel appliances * Granite kitchen countertops * Gas range * Smart thermostat * Low-E windows * WaterSense® labeled faucets * ENERGY STAR® certified home * Close to family friendly parks * Commuter-friendly location * Near local schools * Playground * Pavilion * Splash pad
Key facts
- Extra storage space
- Open floor plan
- Front porch
Tags
Neighborhood map
What this means for you Summary
Snapshot
- This is a 3-bed/2.0-bath single-family listed at $307k. Condition is rated good.
Deal economics
- At list price, monthly cash flow is $-294 ($-4k/yr) — negative.
- To cash-flow at today's rent, offer at most $296k (3.6% below list).
- To meet the 1% rule (rent ≥ 1% of price), the offer needs to be $259k (15.7% below list).
- Recommended offer: $259k (15.7% below list) — sets the bar for 1% rule.
- Cap rate 5.2% vs local median 3.2% in Houston — top-decile yield for the area; either an underpriced asset or a hidden risk that comps aren't pricing in. Stress-test before assuming the spread holds.
Location & tenants
- Location reads 74/100 on livability (#184 in TX, #4,771 nationally) — a middle-class / working-renter tenant base. Strengths: amenities A+, cost of living A+, housing A+; Watch: crime F.
- Lamar CISD (suburban): math 50% / reading 53% proficiency, ranked #116 of 826 in TX (top 14%) — acceptable for families but not a draw, mixed tenant base, ~2y average lease.
- Zoned schools: Joe Hubenak El (math 57% / reading 61%, grade B-, #455 of 4,322 statewide, top 11%, 1,214 students, 37% FRL); Briscoe J H (math 59% / reading 60%, grade B, #166 of 1,662 statewide, top 11%, 1,914 students, 38% FRL); Foster H S (math 64% / reading 74%, grade B, #141 of 1,632 statewide, top 9%, 2,388 students, 34% FRL).
- Market conditions: Rents soft (-1.6%/yr); 1238 active listings in the ZIP; 3 comparable units currently listed for rent nearby; rentals lingering (median 46d on market — plan ~5-8 weeks vacancy on turnover, expect pricing pressure); 100% of comp listings sitting > 30 days — soft ceiling on asking rent; high-income renter base; 12,093 units permitted in Fort Bend County in 2024 (815 in 5+ unit buildings).
Forward outlook
- Local home prices are declining (-3.0%/yr); year-one equity from $2k of loan paydown is wiped out by about $10k of value loss. Plan a longer hold.
- Fort Bend County population projected at +75% by 2050 — long-run rental-demand tailwind backs the buy-and-hold thesis.
Negotiation context
- It's been on market 142 days — a 12% lower offer ($270k) is reasonable based on typical stale-listing flexibility.
Risks & watch-outs
- Climate carrying-cost: major flood risk; severe wind risk, 99% chance of damaging wind over 30y; extreme-heat days projected 7→23/yr by 2055 (HVAC capex compounding) — expect insurance premiums to compound above CPI over the hold.
Questions for the listing agent
- What do current leases actually rent for vs. the listed asking? Can we see a recent rent roll and the last 12 months of T-12 income?
- It's been on market 142 days. Have you received any prior offers? Is the seller open to a 16% concession, seller financing, or rate buy-down credit?
- Why hasn't it sold? Are there any deal-killer items the seller is aware of (foundation, flood, title, zoning, code violations)?
- Is there a deadline driving the sale (1031 exchange, divorce, estate, relocation)? That informs how much negotiation room exists.
- Schools are D-rated, which usually means shorter tenancies and higher turnover. Who's the typical renter profile here, and what's been the actual vacancy rate?
- Crime grade is F in this area — have there been break-ins, vandalism, or insurance claims at this property in the last 3 years? What carrier currently insures it and at what premium?
- The area grade is low — what's the realistic commute time and amenity access for the typical tenant pool here? Any planned neighborhood developments (good or bad) we should know about?
- What's the average days-on-market for RENTAL listings here right now (not sales)? A rising rental-DOM trend means longer vacancies and softer asking-rent achievability than the comps imply.
- What's the recent tenant-quality profile in this submarket — average credit score on applications, eviction rate, late-payment / NSF rate, and stable-employment percentage? A property-management company in the area should have these aggregated.
- How much new for-sale + rental construction is in the pipeline within 1–3 miles? Heavy new supply typically softens prices + rents 12–24 months out; constrained supply supports both.
Investment metrics
- 1% rule
- 0.76% ✗
- Cap rate
- 5.25%
- Cash-on-cash
- -3.73%
- DSCR
- 0.83
- GRM
- 10.9
CMA / ARV
- ARV (median comp)
- $338,597
- List price
- $306,995
- Delta
- -9.33%
- Verdict
- FAIR
- Comps
- 20 within 1.0 mi
Show comp detail 12 sales within ~0.75 mi
| Address | Dist | Beds/Ba | Sqft | Sold | Price | $/sf | Match |
|---|---|---|---|---|---|---|---|
| 25319 Western Sage Ln | 0.08mi | 3/2.0 | 1,652 (-8%) | 9mo | $299,000 | $181 | 75 |
| 25127 Farmdale Ln | 0.19mi | 4/2.0 (+1) | 1,904 (+6%) | 10mo | $350,000 | $184 | 68 |
| 10410 Skyward Estate Trl | 0.66mi | 3/2.0 | 1,743 (-3%) | 23mo | $390,900 | $224 | 46 |
| 26003 Horizon Star Ln | 0.73mi | 3/2.0 | 1,721 (-4%) | 17mo | $349,990 | $203 | 45 |
| 25922 Hawking Vista Rd | 0.73mi | 3/2.0 | 1,743 (-3%) | 23mo | $353,900 | $203 | 42 |
| 10502 Skyward Estate Trl | 0.67mi | 4/2.0 (+1) | 1,721 (-4%) | 20mo | $349,990 | $203 | 41 |
| 26007 Hawking Vista Rd | 0.75mi | 3/2.0 | 1,700 (-5%) | 19mo | $340,000 | $200 | 41 |
| 25910 Hawking Vista Rd | 0.70mi | 3/2.0 | 1,700 (-5%) | 22mo | $389,408 | $229 | 40 |
| 25930 Dawning Torch Trce | 0.75mi | 4/2.0 (+1) | 1,721 (-4%) | 18mo | $367,990 | $214 | 39 |
| 11010 Heartland Grove Dr | 0.75mi | 4/2.0 (+1) | 2,014 (+12%) | 3mo | $275,000 | $137 | 37 |
| 25902 Hawking Vista Rd | 0.69mi | 3/2.0 | 1,927 (+8%) | 22mo | $416,746 | $216 | 37 |
| 26023 Steele Flower Dr | 0.73mi | 4/3.0 (+1) | 1,918 (+7%) | 22mo | $348,000 | $181 | 26 |
Match score weights: distance 35% · size 25% · config 20% · recency 20%. Top-matched comps best support the ARV.
Projected returns pro-forma
-3.0% appreciation · 0.0% rent growth · sell at horizon
- IRR
- -25.9%
- Equity multiple
- 0.14×
- Total profit
- $-81,167
- Equity at exit
- $50,486
- IRR
- -36.5%
- Equity multiple
- -0.31×
- Total profit
- $-123,989
- Equity at exit
- $29,276
Cash invested: $94,807 (down + closing). Projections, not guarantees.
Landlord ↔ Tenant lean methodology
- Overall (STATE)
- 87 Strongly Landlord-Friendly
- State Texas
- 87 Strongly Landlord-Friendly · R+5
- County
- — inherits STATE
- City
- — inherits STATE
ZIP-level market 77406
- Home prices YoY
- -26.2%
- Rents YoY
- -1.6%
- Active inventory
- 1238
- Price-to-rent
- 9.9×
Monthly cashflow live
- Estimated rent
- $2,589 medium interval (Pro) →
- Mortgage (P&I)
- −$1,776
- Tax est. 1.5%
- −$423 /mo · $5,079/yr
- Insurance
- −$141
- HOA
- −$0
- Vacancy / Maint / Mgmt
- −$544
- Net cashflow
- $-294
Break-even live
Sensitivity live
| Price | -10% $-60 | -5% $-177 | +0% $-294 | +5% $-411 | +10% $-528 |
|---|---|---|---|---|---|
| Rent | -10% $-499 | -5% $-397 | +0% $-294 | +5% $-192 | +10% $-90 |
| Rate | -1.0pp $-124 | -0.5pp $-208 | base $-294 | +0.5pp $-382 | +1.0pp $-471 |
UW: 25.0% down · 7.5% · 30yr · 1.5% tax · 5.0% vac · 8.0% maint · 8.0% mgmt
Financing live
Cash to close
- Down payment
- $84,649
- Closing costs
- $10,158
- Reserves months
- —
- Total cash needed
- —
Loan-product check · same deal, 3 products live
Conventional
25% down · 7.5% · 30yr
- Down + closing
- —
- Monthly P&I
- —
- Monthly cashflow
- —
- DSCR
- —
- Eligible?
- —
Personal DTI + credit; lowest rate.
DSCR
20% down · 8.5% · 30yr
- Down + closing
- —
- Monthly P&I
- —
- Monthly cashflow
- —
- DSCR
- —
- Eligible?
- —
No personal income docs; deal must DSCR.
Hard money
10% down · 12.0% · 12mo
- Down + closing
- —
- Monthly P&I
- —
- Monthly cashflow
- —
- DSCR
- —
- Eligible?
- —
Short-term bridge; refi at stabilization.
Rent comps 3 comps
| Address | Beds | Baths | Sqft | Rent | $/sqft | DOM | Units | Dist |
|---|---|---|---|---|---|---|---|---|
| 10503 Shinning Dawn Way Richmond, TX | 4.0 | 3.5 | 2523 | $3,399 | $1.35 | 45d | 1 | 0.81mi |
| 25810 Palmdale Estate Dr Richmond, TX | 4.0 | 2.0 | 2008 | $2,350 | $1.17 | 45d | 1 | 0.89mi |
| 11602 Darby Chase Trl Richmond, TX | 4.0 | 2.0 | 1910 | $2,550 | $1.34 | 45d | 1 | 1.41mi |
Listing history 19 events
-
2026-06-21days on market $306,995 Active 142 DOM
-
2026-06-18days on market $306,995 Active 139 DOM
-
2026-06-17days on market $306,995 Active 138 DOM
-
2026-06-16days on market $306,995 Active 137 DOM
-
2026-06-15days on market $306,995 Active 136 DOM
-
2026-06-13days on market $306,995 Active 134 DOM
-
2026-06-10days on market $306,995 Active 130 DOM
-
2026-06-08days on market $306,995 Active 129 DOM
-
2026-06-07days on market $306,995 Active 128 DOM
-
2026-06-04days on market $306,995 Active 125 DOM
-
2026-06-03days on market $306,995 Active 124 DOM
-
2026-06-02days on market $306,995 Active 123 DOM
-
2026-06-01days on market $306,995 Active 122 DOM
-
2026-05-31pricedays on market $306,995 Active 121 DOM
-
2026-05-15price $304,995 432-char remark
Show marketing remark (432 chars)
* Walk-in kitchen pantry * Open floor plan * Front porch * Extra storage space * 6-panel interior doors * Stainless steel appliances * Granite kitchen countertops * Gas range * Smart thermostat * Low-E windows * WaterSense® labeled faucets * ENERGY STAR® certified home * Close to family friendly parks * Commuter-friendly location * Near local schools * Playground * Pavilion * Splash pad
-
2026-04-15price $301,995 432-char remark
Show marketing remark (432 chars)
* Walk-in kitchen pantry * Open floor plan * Front porch * Extra storage space * 6-panel interior doors * Stainless steel appliances * Granite kitchen countertops * Gas range * Smart thermostat * Low-E windows * WaterSense® labeled faucets * ENERGY STAR® certified home * Close to family friendly parks * Commuter-friendly location * Near local schools * Playground * Pavilion * Splash pad
-
2026-04-07price $316,995 432-char remark
Show marketing remark (432 chars)
* Walk-in kitchen pantry * Open floor plan * Front porch * Extra storage space * 6-panel interior doors * Stainless steel appliances * Granite kitchen countertops * Gas range * Smart thermostat * Low-E windows * WaterSense® labeled faucets * ENERGY STAR® certified home * Close to family friendly parks * Commuter-friendly location * Near local schools * Playground * Pavilion * Splash pad
-
2026-03-24price $326,995 432-char remark
Show marketing remark (432 chars)
* Walk-in kitchen pantry * Open floor plan * Front porch * Extra storage space * 6-panel interior doors * Stainless steel appliances * Granite kitchen countertops * Gas range * Smart thermostat * Low-E windows * WaterSense® labeled faucets * ENERGY STAR® certified home * Close to family friendly parks * Commuter-friendly location * Near local schools * Playground * Pavilion * Splash pad
-
2026-01-31$336,995 Active 432-char remark
Show marketing remark (432 chars)
* Walk-in kitchen pantry * Open floor plan * Front porch * Extra storage space * 6-panel interior doors * Stainless steel appliances * Granite kitchen countertops * Gas range * Smart thermostat * Low-E windows * WaterSense® labeled faucets * ENERGY STAR® certified home * Close to family friendly parks * Commuter-friendly location * Near local schools * Playground * Pavilion * Splash pad
ⓘ Source: listings_history table (triggers on properties + properties_extension) + one-shot
backfill from property_details.listing_events for pre-trigger history.
Climate risk First Street
- Flood 6/10 Major FEMA zone X (unshaded) · 71% chance over 30 yrs
- Wildfire 4/10 Moderate
- Heat 9/10 Extreme 7 d/yr ≥111°F today · 23 d/yr by 30 yrs out
- Wind 9/10 Extreme 99% chance of damaging wind over 30 yrs
- Air quality 2/10 Low 1 unhealthy d/yr today · 1 by 30 yrs out
Nearby sold comps map
Loading sold comps map…
Walkable amenities ~0.75 mi
Loading nearby amenities…
Taxation est. · year 1
- Rental income
- $31,072
- − Mortgage interest
- −$18,967
- − Property taxes
- −$5,079
- − Insurance
- −$1,693
- − Repairs & maintenance
- −$2,486
- − Management
- −$2,486
- − Depreciation
- −$9,850
- Taxable loss
- −$9,488
- Est. tax savings @ 24.0%
- +$2,277
- After-tax cash flow
- $-1,256/yr
For passive investors: Depreciation is non-cash, so a rental often shows a tax loss while cash-flowing — sheltering income. Rental losses are passive: they offset passive income freely, and up to $25,000/yr can offset ordinary (W-2) income if you actively participate and your MAGI is under $100k (phasing out to $0 by $150k); unused losses carry forward. On sale, claimed depreciation is recaptured at up to 25%, and gains may owe capital-gains tax (a 1031 exchange can defer both). Figures are a year-1 estimate at your 24.0% rate — not tax advice; consult a CPA.
Condition & rehab AI · 2 photos
This single-family home is in good condition with recent updates, offering a good balance of curb appeal and functionality.
Value-add opportunities
- Both Painting exterior — Enhances curb appeal and resale value
- Both Landscaping improvements — Enhances curb appeal and rental value
Renovation cost estimate screening
Value-add ROI direction
- Both Painting exterior — Enhances curb appeal and resale value ↑
- Both Landscaping improvements — Enhances curb appeal and rental value ↑
ⓘ Cost ranges are severity-bucket heuristics (US national rule-of-thumb). Get contractor quotes + a written scope before underwriting a rehab budget.
Schools (NCES district)
- District
- Lamar CISD
- NCES district ID
- 4826580
- Math proficiency
- 50% ▼ -12.00%
- Reading proficiency
- 53% ▼ -4.00%
- Median HH income
- $75,213
- Composite
- 46.43/100
- National rank
- #2452
- State rank
- #116 of 826 in TX
Livability — Houston
- Score
- 74/100
- State rank
- #184
- US rank
- #4771
Category grades
Schools grade is shown separately in the Schools card above.
Census & demographics
- County
- Fort Bend County · 836,777 people
- City population
- 3,226,434
- Metro
- Houston-The Woodlands-Sugar Land, TX
- Population (ZIP)
- 69,918
- Household income
- $141,869
- Rent vs Own
- Severe rent burden
- 575.0
Population outlook (Fort Bend County) Hauer SSP2
- Today (2025)
- 1,004,526 people
- By 2030
- 1,153,104 · +14.8%
- By 2040
- 1,453,718 · +44.7%
- By 2050
- 1,753,781 · +74.6%
- By 2075
- 2,455,772 · +144.5%
- By 2100
- 2,930,528 · +191.7%
Race, ethnicity, and origin ACS 2023
- Neighborhood character
- Highly diverse neighborhood (Simpson 0.72)
- Race & ethnicity
- White 43% Hispanic / Latino 26% Two or more races 15% Black 14% Asian 12%
- Hispanic origin (detail)
- Mexican 18% Puerto Rican 1%
- Common ancestry
- Lithuanian 2% Romanian 1% Iranian 1%
- Foreign-born
- 17% · Canada, Vietnam, China
- Languages at home
- 73% English-only · Spanish 14% Other Indo-European 3% Vietnamese 2%
Political lean MEDSL · Fort Bend
- 2024 margin
- Toss-up / Even · D 49.5% · R 47.9% · Other 2.6%
- 2008→2024 swing
- +4.0pp toward D · 2008: -2.4pp · 2024: 1.6pp
- All cycles
- 2024: D+1.6 2020: D+10.6 2016: D+6.6 2012: R+6.8 2008: R+2.4
Not yet ingested
- Civics
- —
Market trends
- HPI YoY
- ▼ -79.18%
- Current HPI
- 222.9525
- Rent YoY
- ▼ -1.61%
- Metro
- Houston-The Woodlands-Sugar Land, TX
- State GDP YoY
- ▲ 3.95%
- F500 in state
- 110
Industry mix (Fortune 500 HQ in TX)
| Industry | F500 HQs | Revenue |
|---|---|---|
| Energy | 16 | $1,198B |
|
||
| Technology | 5 | $198B |
|
||
| Engineering / Construction | 4 | $72B |
|
||
| Energy Services | 3 | $60B |
|
||
| Utilities | 3 | $41B |
|
||
| Healthcare | 2 | $330B |
|
||
Price history
-9.5% since first listed5 events — show timeline
- 2026-05-15 Price Changed $304,995 Zillow
- 2026-04-15 Price Changed $301,995 Zillow
- 2026-04-07 Price Changed $316,995 Zillow
- 2026-03-24 Price Changed $326,995 Zillow
- 2026-01-31 Listed $336,995 Zillow
Cash-flow waterfall
monthlySold comps — $/sqft
last 12 mo · ≤1 miLoading sold comps…