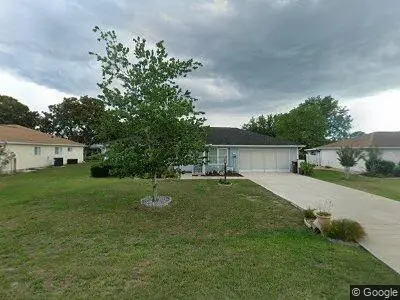
6164 SW 84th Ln · Liberty Triangle, FL
Flood risk 1/10 · Minimal
- FEMA flood zone
- X (unshaded)
- Chance of flooding over 30 yrs
- 0.0%
- Est. flood insurance / yr
- $507 – $1,088
Fire risk 4/10 · Minor
- Est. fire insurance / yr
- $947 – $1,759
Heat risk 8/10 · Major
- Hot days now (above 108°F)
- 7 days/yr
- Hot days in 30 yrs
- 22 days/yr
Wind risk 9/10 · Severe
- Chance of severe wind over 30 yrs
- 99.0%
Air-quality risk 2/10 · Minimal
- Unhealthy air days now
- 2 days/yr
- Unhealthy air days in 30 yrs
- 2 days/yr
Risk factors via First Street. Map © Google.
Why this score? — see what drove the C- grade
The composite is a weighted blend of 9 inputs, each scored 0–100. Each bar is that input's sub-score; the figure is the points it added to the 100-point composite (weight × sub-score).
- Cash flow +19.6/30.0
- ARV discount +10.1/15.0
- DSCR +6.2/10.0
- 1% rule +4.2/10.0
- Schools +3.6/10.0
- Livability +2.5/5.0
- Condition / age +2.5/5.0
- Rent growth +1.9/5.0
- Appreciation +0.0/10.0
$189,900
🖨 Deal sheet 📄 Offer letter ✓ Due diligence
Listing remarks
Being sold as-is and furnished. Realtors welcome. Cash buyers encouraged.
Key facts
- Built 1996
- Listed 7 days
Neighborhood map
What this means for you Summary
Snapshot
- This is a 2-bed/2.0-bath single-family listed at $190k.
Deal economics
- At list price, monthly cash flow is $220 ($3k/yr) — positive.
- The deal already cash-flows at list — no discount required.
- To meet the 1% rule (rent ≥ 1% of price), the offer needs to be $176k (7.6% below list).
- Recommended offer: $176k (7.6% below list) — sets the bar for 1% rule.
- Cap rate 7.7% vs local median 4.5% in Liberty Triangle — top-decile yield for the area; either an underpriced asset or a hidden risk that comps aren't pricing in. Stress-test before assuming the spread holds.
Location & tenants
- Location reads: area grade C — affects rentability + tenant quality, not the cash-flow math above.
- Marion (rural): math 42% / reading 43% proficiency, ranked #61 of 73 in FL (top 84%) — families likely to look elsewhere, expect single-tenant / working-renter base with shorter leases; 61% free/reduced lunch — lower-income household profile, screen leases tightly.
- Market conditions: Rents soft (-2.6%/yr); 852 active listings in the ZIP; 20 comparable units currently listed for rent nearby; rentals leasing fast (median 14d on market — plan ~1-2 weeks tenant-placement turnaround); 7,071 units permitted in Marion County in 2024 (534 in 5+ unit buildings).
- This rent runs 32% of the median local income ($66k/yr) — at the standard rent-burdened threshold; future hikes will face affordability resistance.
Forward outlook
- Local home prices are declining (-3.0%/yr); year-one equity from $1k of loan paydown is wiped out by about $6k of value loss. Plan a longer hold.
- Marion County population projected at +13% by 2050 — modest demand growth; plan on rents tracking national, not racing it.
Negotiation context
- Only 7 days on market — expect competitive offers; lowballing is unlikely to land.
- 3 sale attempts since 18y ago with the ask held roughly flat each time — persistent listings suggest the price (not the market) is what's stuck; bring a comps-based counter.
- Current owner paid $150k; 27% above their basis — modest negotiation headroom, anchor on the comps not their cost.
Risks & watch-outs
- Climate carrying-cost: severe wind risk, 99% chance of damaging wind over 30y; extreme-heat days projected 7→22/yr by 2055 (HVAC capex compounding) — expect insurance premiums to compound above CPI over the hold.
Questions for the listing agent
- Is there a deadline driving the sale (1031 exchange, divorce, estate, relocation)? That informs how much negotiation room exists.
- What's the average days-on-market for RENTAL listings here right now (not sales)? A rising rental-DOM trend means longer vacancies and softer asking-rent achievability than the comps imply.
- What's the recent tenant-quality profile in this submarket — average credit score on applications, eviction rate, late-payment / NSF rate, and stable-employment percentage? A property-management company in the area should have these aggregated.
- How much new for-sale + rental construction is in the pipeline within 1–3 miles? Heavy new supply typically softens prices + rents 12–24 months out; constrained supply supports both.
Investment metrics
- 1% rule
- 0.92% ✗
- Cap rate
- 7.68%
- Cash-on-cash
- 4.96%
- DSCR
- 1.22
- GRM
- 9.0
CMA / ARV
- ARV (on-the-fly)
- $201,640
- Comps found
- 6
Show comp detail 6 sales within ~0.75 mi
| Address | Dist | Beds/Ba | Sqft | Sold | Price | $/sf | Match |
|---|---|---|---|---|---|---|---|
| 8362 SW 62nd Ct | 0.28mi | 2/2.0 | 1,518 (+7%) | 20mo | $214,000 | $141 | 59 |
| 6640 SW 85th Pl | 0.46mi | 3/2.0 (+1) | 1,370 (-4%) | 11mo | $224,600 | $164 | 59 |
| 6549 SW 84th Place Rd | 0.38mi | 2/2.0 | 1,603 (+13%) | 4mo | $228,000 | $142 | 58 |
| 6460 SW 80th Pl | 0.53mi | 2/2.0 | 1,246 (-12%) | 15mo | $147,000 | $118 | 42 |
| 8691 SW 57th Court Rd | 0.42mi | 2/2.0 | 1,616 (+14%) | 18mo | $260,000 | $161 | 42 |
| 8508 SW 65th Court Rd | 0.40mi | 3/2.5 (+1) | 1,632 (+15%) | 23mo | $228,000 | $140 | 30 |
Match score weights: distance 35% · size 25% · config 20% · recency 20%. Top-matched comps best support the ARV.
Projected returns pro-forma
-3.0% appreciation · 0.0% rent growth · sell at horizon
- IRR
- -11.7%
- Equity multiple
- 0.59×
- Total profit
- $-21,981
- Equity at exit
- $28,315
- IRR
- -7.2%
- Equity multiple
- 0.60×
- Total profit
- $-21,251
- Equity at exit
- $16,419
Cash invested: $53,172 (down + closing). Projections, not guarantees.
Landlord ↔ Tenant lean methodology
- Overall (STATE)
- 87 Strongly Landlord-Friendly
- State Florida
- 87 Strongly Landlord-Friendly · R+3
- County
- — inherits STATE
- City
- — inherits STATE
ZIP-level market 34476
- Rents YoY
- -2.6%
- Active inventory
- 852
- Price-to-rent
- 9.0×
Monthly cashflow live
- Estimated rent
- $1,755 high interval (Pro) →
- Mortgage (P&I)
- −$996
- Tax from tax record
- −$92 /mo · $1,102/yr
- Insurance
- −$79
- HOA
- −$0
- Vacancy / Maint / Mgmt
- −$369
- Net cashflow
- $220
Break-even live
UW: 25.0% down · 7.5% · 30yr · 1.5% tax · 5.0% vac · 8.0% maint · 8.0% mgmt
Financing live
Cash to close
- Down payment
- $47,475
- Closing costs
- $5,697
- Reserves months
- —
- Total cash needed
- —
Loan-product check · same deal, 3 products live
Conventional
25% down · 7.5% · 30yr
- Down + closing
- —
- Monthly P&I
- —
- Monthly cashflow
- —
- DSCR
- —
- Eligible?
- —
Personal DTI + credit; lowest rate.
DSCR
20% down · 8.5% · 30yr
- Down + closing
- —
- Monthly P&I
- —
- Monthly cashflow
- —
- DSCR
- —
- Eligible?
- —
No personal income docs; deal must DSCR.
Hard money
10% down · 12.0% · 12mo
- Down + closing
- —
- Monthly P&I
- —
- Monthly cashflow
- —
- DSCR
- —
- Eligible?
- —
Short-term bridge; refi at stabilization.
Rent comps 20 comps
| Address | Beds | Baths | Sqft | Rent | $/sqft | DOM | Units | Dist |
|---|---|---|---|---|---|---|---|---|
| 6243 SW 90th St Ocala, FL | 2.0 | 2.0 | 1700 | $1,750 | $1.03 | 21d | 1 | 0.49mi |
| 6644 SW 84th St Ocala, FL | 3.0 | 2.0 | 1485 | $950 | $0.64 | 21d | 1 | 0.51mi |
| 6609 SW 81st Loop Ocala, FL | 3.0 | 2.5 | 1458 | $1,750 | $1.20 | 13d | 1 | 0.54mi |
| 6676 SW 81st Loop Ocala, FL | 3.0 | 2.5 | 1458 | $1,710 | $1.17 | 13d | 1 | 0.59mi |
| 6582 SW 81st Loop Ocala, FL | 3.0 | 2.5 | 1505 | $1,700 | $1.13 | 13d | 1 | 0.59mi |
| 6534 SW 82nd Loop Ocala, FL | 3.0 | 2.5 | 1450 | $1,900 | $1.31 | 13d | 1 | 0.61mi |
| 8250 SW 67th Ave Ocala, FL | 3.0 | 2.5 | 1505 | $1,635 | $1.09 | 21d | 1 | 0.65mi |
| 9198 SW 62nd Terrace Rd Ocala, FL | 3.0 | 2.0 | 1710 | $1,850 | $1.08 | 13d | 1 | 0.66mi |
| 7195 SW 92nd St Ocala, FL | 3.0 | 2.5 | 1220 | $1,750 | $1.43 | 21d | 1 | 0.80mi |
| 8780 SW 49th Cir Ocala, FL | 3.0 | 2.0 | 1672 | $1,900 | $1.14 | 21d | 1 | 0.96mi |
| 8710 SW 71st Ave Ocala, FL | 1.0–3.0 | 1.0–2.5 | 1312 | $1,975 | $1.51 | 13d | 27 | 0.98mi |
| 4828 SW 86th Ln Ocala, FL | 3.0 | 2.0 | 1672 | $1,950 | $1.17 | 21d | 1 | 1.22mi |
| 4939 SW 81st Loop Ocala, FL | 3.0 | 2.5 | 1828 | $1,750 | $0.96 | 13d | 1 | 1.24mi |
| 7051 SW 64th Ter Ocala, FL | 3.0 | 2.0 | 1755 | $1,775 | $1.01 | 13d | 1 | 1.25mi |
| 4915 SW 81st St Ocala, FL | 3.0 | 2.5 | 1707 | $1,795 | $1.05 | 13d | 1 | 1.28mi |
| 7177 SW 92nd St Ocala, FL | 3.0 | 2.5 | 1410 | $1,850 | $1.31 | 21d | 1 | 1.28mi |
| 6035 SW 98th Street Rd Ocala, FL | 2.0 | 2.0 | 1494 | $1,650 | $1.10 | 13d | 1 | 1.35mi |
| 8609 SW 46th Ter Ocala, FL | 3.0 | 2.0 | 1670 | $2,400 | $1.44 | 13d | 1 | 1.37mi |
| 4643 SW 84th Street Rd Ocala, FL | 3.0 | 2.0 | 1663 | $1,925 | $1.16 | 13d | 1 | 1.38mi |
| 9853 SW 59th Cir Ocala, FL | 2.0 | 1.0 | 935 | $1,500 | $1.60 | 13d | 1 | 1.48mi |
Listing history 6 events
-
2026-06-15days on market $189,900 Active 7 DOM
-
2026-06-14days on market $189,900 Active 5 DOM
-
2026-06-13days on market $189,900 Active 4 DOM
-
2026-06-10days on market $189,900 Active 2 DOM
-
2026-06-09remarks 73-char remark
-
2026-06-09$189,900 Active 1 DOM
ⓘ Source: listings_history table (triggers on properties + properties_extension) + one-shot
backfill from property_details.listing_events for pre-trigger history.
Tax reassessment forecast FL · Resets to sale price
- Current annual tax
- $1,102 · $92/mo
- Projected year-2 tax
- $1,576 · $131/mo
- Expected delta
- +$475/yr (+$40/mo · 43.1%)
ⓘ Screening estimate from a state-policy table — verify with the county assessor before closing.
Climate risk First Street
- Flood 1/10 Low FEMA zone X (unshaded) · 0% chance over 30 yrs
- Wildfire 4/10 Moderate
- Heat 8/10 Severe 7 d/yr ≥108°F today · 22 d/yr by 30 yrs out
- Wind 9/10 Extreme 99% chance of damaging wind over 30 yrs
- Air quality 2/10 Low 2 unhealthy d/yr today · 2 by 30 yrs out
Nearby sold comps map
Loading sold comps map…
Walkable amenities ~0.75 mi
Loading nearby amenities…
Taxation est. · year 1
- Rental income
- $21,061
- − Mortgage interest
- −$10,637
- − Property taxes
- −$1,102
- − Insurance
- −$950
- − Repairs & maintenance
- −$1,685
- − Management
- −$1,685
- − Depreciation
- −$5,524
- Taxable loss
- −$521
- Est. tax savings @ 24.0%
- +$125
- After-tax cash flow
- $2,762/yr
For passive investors: Depreciation is non-cash, so a rental often shows a tax loss while cash-flowing — sheltering income. Rental losses are passive: they offset passive income freely, and up to $25,000/yr can offset ordinary (W-2) income if you actively participate and your MAGI is under $100k (phasing out to $0 by $150k); unused losses carry forward. On sale, claimed depreciation is recaptured at up to 25%, and gains may owe capital-gains tax (a 1031 exchange can defer both). Figures are a year-1 estimate at your 24.0% rate — not tax advice; consult a CPA.
Schools (NCES district)
- District
- Marion
- NCES district ID
- 1201260
- Math proficiency
- 42% ▼ -7.00%
- Reading proficiency
- 43% ▼ -4.00%
- Median HH income
- $40,015
- Composite
- 35.61/100
- National rank
- #4890
- State rank
- #61 of 73 in FL
Livability — Liberty Triangle
No livability data for this city. (Only ~50 U.S. cities are tracked.)
Census & demographics
- Census place
- Liberty Triangle, FL
- County
- Marion County · 315,796 people
- City population
- 26,397
- Metro
- Ocala, FL
- Population (ZIP)
- 28,997
- Household income
- $65,860
- Rent vs Own
- Severe rent burden
- 204.0
Population outlook (Marion County) Hauer SSP2
- Today (2025)
- 365,905 people
- By 2030
- 376,768 · +3.0%
- By 2040
- 396,555 · +8.4%
- By 2050
- 412,723 · +12.8%
- By 2075
- 446,090 · +21.9%
- By 2100
- 436,193 · +19.2%
Race, ethnicity, and origin ACS 2023
- Neighborhood character
- Diverse neighborhood (Simpson 0.55)
- Race & ethnicity
- White 63% Hispanic / Latino 18% Black 13% Two or more races 10% Asian 1%
- Hispanic origin (detail)
- Mexican 3% Puerto Rican 8% Cuban 3%
- Common ancestry
- Romanian 3% Slovak 3% Lithuanian 3%
- Foreign-born
- 15% · Canada, Jamaica, Dominican Republic
- Languages at home
- 83% English-only · Spanish 14% Other Indo-European 1% German/W. Germanic 1%
Political lean MEDSL · Marion
- 2024 margin
- Solid R (+31.6) · D 33.8% · R 65.5%
- 2008→2024 swing
- -20.0pp toward R · 2008: -11.6pp · 2024: -31.6pp
- All cycles
- 2024: R+31.6 2020: R+25.9 2016: R+26.2 2012: R+16.2 2008: R+11.6
Not yet ingested
- Civics
- —
Market trends
- HPI YoY
- ▼ -105.22%
- Current HPI
- 189.0869
- Rent YoY
- ▼ -2.57%
- Metro
- Ocala, FL
- State GDP YoY
- ▲ 3.28%
- F500 in state
- 36
Industry mix (Fortune 500 HQ in FL)
| Industry | F500 HQs | Revenue |
|---|---|---|
| Industrial Technology | 2 | $29B |
|
||
| Insurance | 2 | $17B |
|
||
| Retail | 1 | $60B |
|
||
| Technology Distribution | 1 | $58B |
|
||
| Homebuilding | 1 | $35B |
|
||
| Technology Manufacturing | 1 | $35B |
|
||
Price history
+130.7% since first listed8 events — show timeline
- 2026-06-09 Listed $189,900 FSBO.com
- 2010-07-14 Listing Removed — Stellar MLS as Distributed by MLS Grid
- 2010-03-02 Listed $79,900 Stellar MLS as Distributed by MLS Grid
- 2009-02-11 Listing Removed — Stellar MLS as Distributed by MLS Grid
- 2008-09-29 Listed $125,000 Stellar MLS as Distributed by MLS Grid
- 2006-03-02 Sold (Public Records) $150,000 Public Records
- 2003-06-23 Sold (Public Records) $89,500 Public Records
- 1996-05-29 Sold (Public Records) $82,300 Public Records
Property tax history
+3.5%/yrLatest (2025): $1,102 · +26.7% YoY. Source: county tax records.
Cash-flow waterfall
monthlySold comps — $/sqft
last 12 mo · ≤1 miLoading sold comps…