25739 135th Ave SE #3 · Kent, WA
Flood risk 4/10 · Minor
- FEMA flood zone
- X (unshaded)
- Chance of flooding over 30 yrs
- 0.22%
- Est. flood insurance / yr
- $507 – $1,088
Fire risk 1/10 · Minimal
- Est. fire insurance / yr
- $604 – $1,122
Heat risk 3/10 · Minor
- Hot days now (above 87°F)
- 7 days/yr
- Hot days in 30 yrs
- 15 days/yr
Wind risk 1/10 · Minimal
- Chance of severe wind over 30 yrs
- —
Air-quality risk 8/10 · Major
- Unhealthy air days now
- 12 days/yr
- Unhealthy air days in 30 yrs
- 12 days/yr
Risk factors via First Street. Map © Google.
Why this score? — see what drove the B grade
The composite is a weighted blend of 9 inputs, each scored 0–100. Each bar is that input's sub-score; the figure is the points it added to the 100-point composite (weight × sub-score).
- Cash flow +30.0/30.0
- 1% rule +10.0/10.0
- DSCR +10.0/10.0
- ARV discount +7.5/15.0
- Schools +4.8/10.0
- Livability +4.0/5.0
- Condition / age +3.8/5.0
- Rent growth +2.5/5.0
- Appreciation +0.0/10.0
$60,000
🖨 Deal sheet 📄 Offer letter ✓ Due diligence
Listing remarks
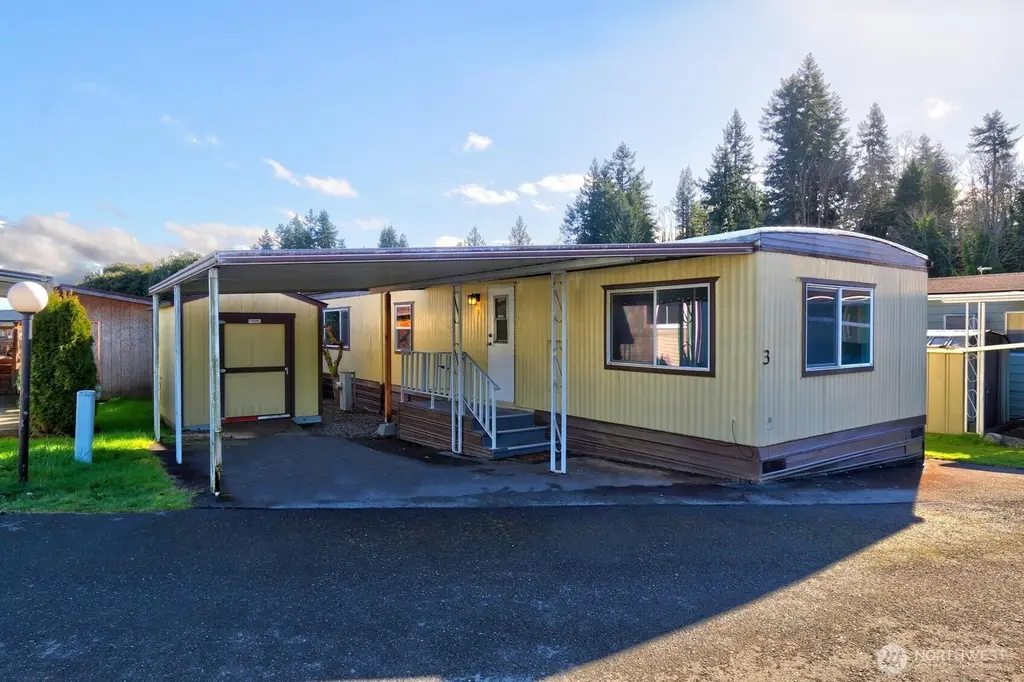
Lake views and peaceful 55+ living await at Lake Meridian Estates. This well-maintained 1973 home offers scenic views of Lake Meridian and Mt. Rainier from the kitchen and dining room space, creating a beautiful backdrop for your morning coffee or evening meal. The light-filled open-concept layout connects the spacious kitchen, dining area, and living room—perfect for easy everyday living and entertaining. Recent upgrades add comfort and value, including fresh interior paint, new furnace, roof refininishing, new washer, new lighting fixtures throughout, and new LVP flooring in the entry. Durable vinyl windows improve efficiency and brightness. The covered carport includes an 8x10 Tuff
Key facts
- Easy-care yard
- Recent upgrades
- Tuff shed
Tags
Neighborhood map
What this means for you Summary
Snapshot
- This is a 2-bed/1.0-bath manufactured listed at $60k. Condition is rated good.
Deal economics
- At list price, monthly cash flow is $1k ($16k/yr) — positive.
- The deal already cash-flows at list — no discount required.
- Meets the 1% rule at list price ($2k rent vs $60k).
- Recommended offer: $55k (9.0% below list) — sets the bar for market timing.
- Cap rate 33.0% vs local median 2.7% in Kent — top-decile yield for the area; either an underpriced asset or a hidden risk that comps aren't pricing in. Stress-test before assuming the spread holds.
Location & tenants
- Location reads 79/100 on livability (#109 in WA, #2,154 nationally) — a middle-class / working-renter tenant base. Strengths: amenities A+, commute A+, housing A+; Watch: schools C-, crime F, cost of living F.
- Kent School District (urban): math 47% / reading 57% proficiency, ranked #109 of 291 in WA (top 38%) — acceptable for families but not a draw, mixed tenant base, ~2y average lease.
- Market conditions: Rents flat; 332 active listings in the ZIP; 9 comparable units currently listed for rent nearby; rentals leasing fast (median 2d on market — plan ~1-2 weeks tenant-placement turnaround); high-income renter base; 10,555 units permitted in King County in 2024 (7,119 in 5+ unit buildings).
Forward outlook
- Local home prices are declining (-3.0%/yr); year-one equity from $415 of loan paydown is wiped out by about $2k of value loss. Plan a longer hold.
- King County population projected at +44% by 2050 — long-run rental-demand tailwind backs the buy-and-hold thesis.
- At projected returns (-3.0% appreciation + 0.2% rent growth), your $17k cash investment doubles in ~2 years — after that, you're playing with house money.
Negotiation context
- It's been on market 98 days — a 9% lower offer ($55k) is reasonable based on typical stale-listing flexibility.
- 2 sale attempts since 3y ago; this cycle's ask has dropped $12k (17%) from the opening price — seller is motivated, your offer sets the floor, not the list.
Questions for the listing agent
- It's been on market 98 days. Have you received any prior offers? Is the seller open to a 9% concession, seller financing, or rate buy-down credit?
- Built in 1973 — when were the roof, HVAC, electrical panel, plumbing, and water heater last replaced?
- Why hasn't it sold? Are there any deal-killer items the seller is aware of (foundation, flood, title, zoning, code violations)?
- Is there a deadline driving the sale (1031 exchange, divorce, estate, relocation)? That informs how much negotiation room exists.
- Crime grade is F in this area — have there been break-ins, vandalism, or insurance claims at this property in the last 3 years? What carrier currently insures it and at what premium?
- What's the average days-on-market for RENTAL listings here right now (not sales)? A rising rental-DOM trend means longer vacancies and softer asking-rent achievability than the comps imply.
- What's the recent tenant-quality profile in this submarket — average credit score on applications, eviction rate, late-payment / NSF rate, and stable-employment percentage? A property-management company in the area should have these aggregated.
- How much new for-sale + rental construction is in the pipeline within 1–3 miles? Heavy new supply typically softens prices + rents 12–24 months out; constrained supply supports both.
Investment metrics
- 1% rule
- 3.69% ✓
- Cap rate
- 33.01%
- Cash-on-cash
- 95.40%
- DSCR
- 5.24
- GRM
- 2.3
CMA / ARV
- ARV (median comp)
- $389,000
- List price
- $60,000
- Delta
- -84.58%
- Verdict
- UNDERPRICED
- Comps
- 4 within 2.0 mi
Show comp detail 1 sale within ~0.75 mi
| Address | Dist | Beds/Ba | Sqft | Sold | Price | $/sf | Match |
|---|---|---|---|---|---|---|---|
| 25739 135th Ave SE #45 | 0.00mi | 3/1.0 (+1) | 910 (-7%) | 20mo | $65,000 | $71 | 67 |
Match score weights: distance 35% · size 25% · config 20% · recency 20%. Top-matched comps best support the ARV.
Projected returns pro-forma
-3.0% appreciation · 0.19% rent growth · sell at horizon
- IRR
- 93.1%
- Equity multiple
- 5.12×
- Total profit
- $69,284
- Equity at exit
- $8,946
- IRR
- 95.4%
- Equity multiple
- 9.71×
- Total profit
- $146,368
- Equity at exit
- $5,188
Cash invested: $16,800 (down + closing). Projections, not guarantees.
Landlord ↔ Tenant lean methodology
- Overall (STATE)
- 28 Tenant-Leaning
- State Washington
- 28 Tenant-Leaning · D+8
- County
- — inherits STATE
- City
- — inherits STATE
ZIP-level market 98042
- Rents YoY
- 0.2%
- Active inventory
- 332
- Price-to-rent
- 2.3×
Monthly cashflow live
- Estimated rent
- $2,216 high interval (Pro) →
- Mortgage (P&I)
- −$315
- Tax est. 1.5%
- −$75 /mo · $900/yr
- Insurance
- −$25
- HOA
- −$0
- Vacancy / Maint / Mgmt
- −$465
- Net cashflow
- $1,336
Break-even live
UW: 25.0% down · 7.5% · 30yr · 1.5% tax · 5.0% vac · 8.0% maint · 8.0% mgmt
Financing live
Cash to close
- Down payment
- $15,000
- Closing costs
- $1,800
- Reserves months
- —
- Total cash needed
- —
Loan-product check · same deal, 3 products live
Conventional
25% down · 7.5% · 30yr
- Down + closing
- —
- Monthly P&I
- —
- Monthly cashflow
- —
- DSCR
- —
- Eligible?
- —
Personal DTI + credit; lowest rate.
DSCR
20% down · 8.5% · 30yr
- Down + closing
- —
- Monthly P&I
- —
- Monthly cashflow
- —
- DSCR
- —
- Eligible?
- —
No personal income docs; deal must DSCR.
Hard money
10% down · 12.0% · 12mo
- Down + closing
- —
- Monthly P&I
- —
- Monthly cashflow
- —
- DSCR
- —
- Eligible?
- —
Short-term bridge; refi at stabilization.
Rent comps 9 comps
| Address | Beds | Baths | Sqft | Rent | $/sqft | DOM | Units | Dist |
|---|---|---|---|---|---|---|---|---|
| 27400 132nd Ave SE Kent, WA | 1.0–2.0 | 1.0–2.0 | 842 | $2,095 | $2.49 | 1d | 7 | 0.97mi |
| 27403 141st Ave SE Kent, WA | 3.0 | 1.5 | 960 | $3,500 | $3.65 | 2d | 1 | 1.05mi |
| 13101 SE 240th St Kent, WA | 2.0 | 1.0 | 867 | $1,942 | $2.24 | 2d | 3 | 1.12mi |
| 12910 SE 240th St Kent, WA | 1.0–2.0 | 1.0–2.0 | 760 | $2,167 | $2.85 | 1d | 5 | 1.26mi |
| 14901 SE 272nd St Kent, WA | 1.0–3.0 | 1.0–2.0 | 900 | $1,959 | $2.18 | 1d | 15 | 1.30mi |
| 11305 SE Kent Kangley Rd Kent, WA | 2.0–3.0 | 2.5 | 1198 | $2,345 | $1.96 | 1d | 4 | 1.34mi |
| 11020 SE Kent Kangley Rd Kent, WA | 2.0 | 1.0 | 580 | $1,650 | $2.84 | 10d | 10 | 1.41mi |
| 10841 SE Kent Kangley Rd Kent, WA | 2.0 | 1.0 | 900 | $1,812 | $2.01 | 4d | 3 | 1.49mi |
| 10925 SE 259th St Kent, WA | 2.0 | 1.0 | 855 | $1,783 | $2.09 | 1d | 10 | 1.50mi |
Listing history 21 events
-
2026-06-18days on market $60,000 Active 98 DOM
-
2026-06-17days on market $60,000 Active 97 DOM
-
2026-06-16days on market $60,000 Active 96 DOM
-
2026-06-15price $60,000 Active 95 DOM
-
2026-06-15days on market $63,500 Active 95 DOM
-
2026-06-13days on market $63,500 Active 93 DOM
-
2026-06-09days on market $63,500 Active 89 DOM
-
2026-06-08days on market $63,500 Active 88 DOM
-
2026-06-07days on market $63,500 Active 87 DOM
-
2026-06-04days on market $63,500 Active 84 DOM
-
2026-06-03days on market $63,500 Active 83 DOM
-
2026-06-02days on market $63,500 Active 82 DOM
-
2026-06-01days on market $63,500 Active 81 DOM
-
2026-05-31days on market $63,500 Active 80 DOM
-
2026-04-30price $63,500
-
2026-04-09price $69,000
-
2026-03-09$72,000 Active
-
2023-11-17soldstatus $66,000 Closed
-
2023-10-18status Pending
-
2023-07-21price $69,500
-
2023-04-27$73,900 Active
ⓘ Source: listings_history table (triggers on properties + properties_extension) + one-shot
backfill from property_details.listing_events for pre-trigger history.
Climate risk First Street
- Flood 4/10 Moderate FEMA zone X (unshaded) · 22% chance over 30 yrs
- Wildfire 1/10 Low
- Heat 3/10 Moderate 7 d/yr ≥87°F today · 15 d/yr by 30 yrs out
- Wind 1/10 Low
- Air quality 8/10 Severe 12 unhealthy d/yr today · 12 by 30 yrs out
Nearby sold comps map
Loading sold comps map…
Walkable amenities ~0.75 mi
Loading nearby amenities…
Taxation est. · year 1
- Rental income
- $26,586
- − Mortgage interest
- −$3,361
- − Property taxes
- −$900
- − Insurance
- −$300
- − Repairs & maintenance
- −$2,127
- − Management
- −$2,127
- − Depreciation
- −$1,745
- Taxable income
- $16,026
- Est. tax owed @ 24.0%
- −$3,846
- After-tax cash flow
- $12,181/yr
For passive investors: Depreciation is non-cash, so a rental often shows a tax loss while cash-flowing — sheltering income. Rental losses are passive: they offset passive income freely, and up to $25,000/yr can offset ordinary (W-2) income if you actively participate and your MAGI is under $100k (phasing out to $0 by $150k); unused losses carry forward. On sale, claimed depreciation is recaptured at up to 25%, and gains may owe capital-gains tax (a 1031 exchange can defer both). Figures are a year-1 estimate at your 24.0% rate — not tax advice; consult a CPA.
Condition & rehab AI · 12 photos
This well-maintained mobile home offers a good condition with recent upgrades and a good curb appeal. Minor updates to exterior and interior can further enhance its value.
Value-add opportunities
- Both Paint exterior siding — Enhances curb appeal and value
- Both Replace carpet in living room and kitchen — Improves comfort and aesthetics
- Both Install new window treatments — Enhances energy efficiency and aesthetics
Renovation cost estimate screening
Value-add ROI direction
- Both Paint exterior siding — Enhances curb appeal and value ↑
- Both Replace carpet in living room and kitchen — Improves comfort and aesthetics ↑
- Both Install new window treatments — Enhances energy efficiency and aesthetics ↑
ⓘ Cost ranges are severity-bucket heuristics (US national rule-of-thumb). Get contractor quotes + a written scope before underwriting a rehab budget.
Schools (NCES district)
- District
- Kent School District
- NCES district ID
- 5303960
- Math proficiency
- 47% ▼ -1.00%
- Reading proficiency
- 57% ▼ -1.00%
- Median HH income
- $69,823
- Composite
- 48.25/100
- National rank
- #4714
- State rank
- #109 of 291 in WA
Livability — Kent
- Score
- 79/100
- State rank
- #109
- US rank
- #2154
Category grades
Schools grade is shown separately in the Schools card above.
Census & demographics
- Census place
- Kent, WA
- County
- King County · 2,251,916 people
- City population
- 119,479
- Metro
- Seattle-Tacoma-Bellevue, WA
- Population (ZIP)
- 50,216
- Household income
- $127,552
- Rent vs Own
- Severe rent burden
- 892.0
Population outlook (King County) Hauer SSP2
- Today (2025)
- 2,576,485 people
- By 2030
- 2,803,316 · +8.8%
- By 2040
- 3,255,921 · +26.4%
- By 2050
- 3,706,444 · +43.9%
- By 2075
- 4,746,063 · +84.2%
- By 2100
- 5,407,730 · +109.9%
Race, ethnicity, and origin ACS 2023
- Neighborhood character
- Diverse neighborhood (Simpson 0.58)
- Race & ethnicity
- White 62% Asian 13% Hispanic / Latino 12% Two or more races 12% Black 6%
- Hispanic origin (detail)
- Mexican 8%
- Common ancestry
- Portuguese 4% Subsaharan African 3% Italian 3%
- Foreign-born
- 19% · Canada, Vietnam, China
- Languages at home
- 75% English-only · Spanish 7% Russian/Polish/Slavic 4% Other Indo-European 3%
Political lean MEDSL · King
- 2024 margin
- Solid D (+51.7) · D 74.2% · R 22.5% · Other 3.4%
- 2008→2024 swing
- +9.6pp toward D · 2008: 42.1pp · 2024: 51.7pp
- All cycles
- 2024: D+51.7 2020: D+52.7 2016: D+50.4 2012: D+39.9 2008: D+42.1
Not yet ingested
- Civics
- —
Market trends
- HPI YoY
- ▼ -635.61%
- Current HPI
- 297.7991
- Rent YoY
- ▲ 0.19%
- Metro
- Seattle-Tacoma-Bellevue, WA
- State GDP YoY
- ▲ 4.65%
- F500 in state
- 22
Industry mix (Fortune 500 HQ in WA)
| Industry | F500 HQs | Revenue |
|---|---|---|
| Retail | 2 | $269B |
|
||
| Technology / Retail | 1 | $638B |
|
||
| Technology | 1 | $245B |
|
||
| Telecommunications | 1 | $38B |
|
||
| Food / Beverage | 1 | $36B |
|
||
| Automotive / Trucks | 1 | $34B |
|
||
Price history
-14.1% since first listed7 events — show timeline
- 2026-04-30 Price Changed $63,500 NWMLS as Distributed by MLS Grid
- 2026-04-09 Price Changed $69,000 NWMLS as Distributed by MLS Grid
- 2026-03-09 Listed $72,000 NWMLS as Distributed by MLS Grid
- 2023-11-17 Sold (MLS) $66,000 NWMLS as Distributed by MLS Grid
- 2023-10-18 Pending — NWMLS as Distributed by MLS Grid
- 2023-07-21 Price Changed $69,500 NWMLS as Distributed by MLS Grid
- 2023-04-27 Listed $73,900 NWMLS as Distributed by MLS Grid
Cash-flow waterfall
monthlySold comps — $/sqft
last 12 mo · ≤1 miLoading sold comps…