1533 Ccc Line Rd · Prairie, MS
Flood risk 1/10 · Minimal
- FEMA flood zone
- X (unshaded)
- Chance of flooding over 30 yrs
- 0.0%
- Est. flood insurance / yr
- $507 – $1,088
Fire risk 5/10 · Moderate
- Est. fire insurance / yr
- $1,241 – $2,305
Heat risk 6/10 · Moderate
- Hot days now (above 109°F)
- 7 days/yr
- Hot days in 30 yrs
- 21 days/yr
Wind risk 6/10 · Moderate
- Chance of severe wind over 30 yrs
- 27.0%
Air-quality risk 2/10 · Minimal
- Unhealthy air days now
- 0 days/yr
- Unhealthy air days in 30 yrs
- 1 days/yr
Risk factors via First Street. Map © Google.
Why this score? — see what drove the C+ grade
The composite is a weighted blend of 9 inputs, each scored 0–100. Each bar is that input's sub-score; the figure is the points it added to the 100-point composite (weight × sub-score).
- Cash flow +26.4/30.0
- DSCR +9.0/10.0
- ARV discount +7.5/15.0
- 1% rule +6.1/10.0
- Schools +5.0/10.0
- Rent growth +2.5/5.0
- Livability +2.5/5.0
- Condition / age +2.5/5.0
- Appreciation +0.0/10.0
$100,000
🖨 Deal sheet 📄 Offer letter ✓ Due diligence
Listing remarks
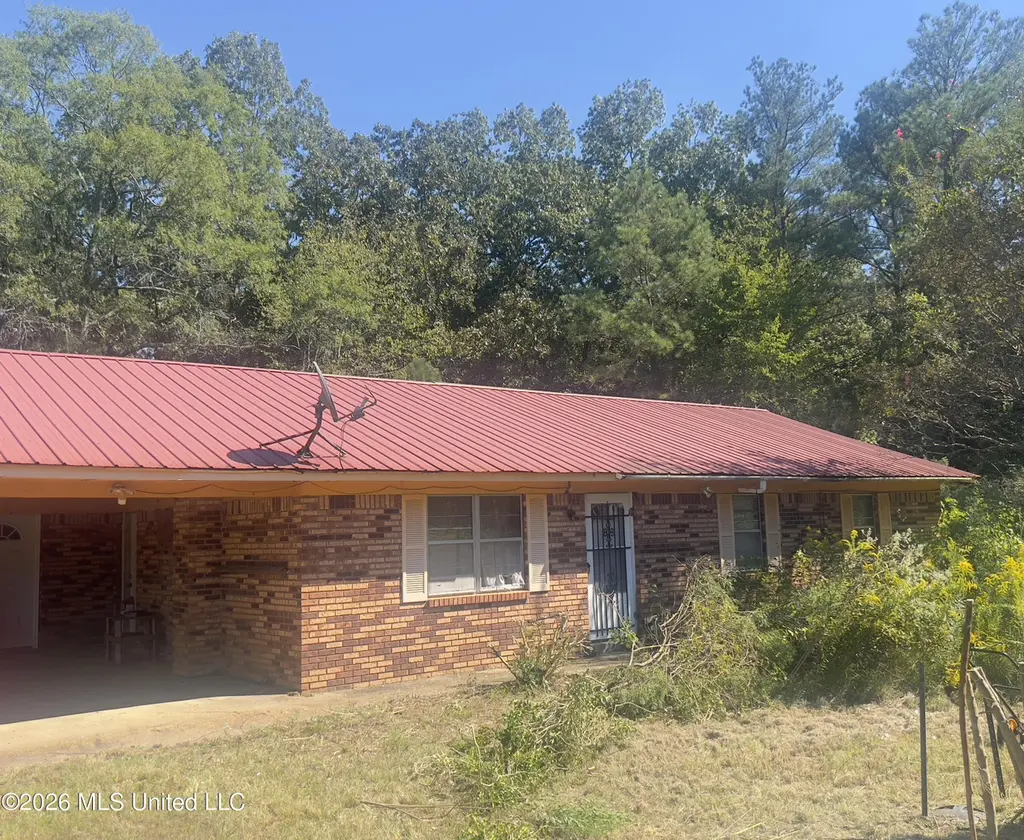
Welcome to 1533 CCC Line Road in Prairie, MS (West Point)—a prime opportunity for investors, flippers, or buyers ready to bring their vision to life! Nestled on a spacious 1-acre lot, this 3-bedroom, 2-bath home offers the perfect canvas for a full renovation project. This property already features a major upgrade with a newer-style metal roof, giving you a strong head start on improvements. The fully bricked exterior adds durability and timeless curb appeal, while the generous lot provides plenty of space for outdoor living, expansion, or additional improvements. Inside, the home is ready for transformation and will require significant repairs and updates—ideal for those lookin
Key facts
- Quiet rural setting
- 1 acre lot
- 1 acre lot
Tags
Property features AI
Exterior
- Parking: Attached carport with 2 carport spaces
- Utilities: Public water; Public sewer; Electricity available
- Home design: Single family residence (house); One story; Fixer condition
- Construction: Brick and brick veneer construction; Slab foundation; Built in public records (year built from public records)
- Exterior features: Metal roof; Shed(s); Open and wooded lot
Interior
- Kitchen: Dishwasher; Disposal; Free-standing range; Microwave; Range hood
- Flooring: Tile flooring
- Bathrooms: 2 full bathrooms
- Heating & cooling: Central heating; Central air conditioning
- Interior features: Ceiling fans; Open floor plan; Pantry; Tray ceilings; Walk-in closet(s); Double vanity(s); Storm door(s); Aluminum window frames with double-pane windows
- Laundry & utility: Washer hookup; Electric dryer hookup
Neighborhood map
What this means for you Summary
Snapshot
- This is a 3-bed/2.0-bath single-family listed at $100k.
Deal economics
- At list price, monthly cash flow is $260 ($3k/yr) — positive.
- The deal already cash-flows at list — no discount required.
- Meets the 1% rule at list price ($1k rent vs $100k).
- Recommended offer: $97k (3.0% below list) — sets the bar for market timing.
Location & tenants
- Location reads: area grade C — affects rentability + tenant quality, not the cash-flow math above.
- Zoned schools: West Clay Elementary School (math 15% / reading 24%, grade F, #244 of 375 statewide, top 65%, 94 students, 100% FRL).
- Market conditions: 17 active listings in the ZIP; 5 units permitted in Clay County in 2024 (0 in 5+ unit buildings).
Forward outlook
- Local home prices are declining (-3.0%/yr); year-one equity from $691 of loan paydown is wiped out by about $3k of value loss. Plan a longer hold.
- Clay County population projected at -18% by 2050 — secular population decline; favor cash flow + early exit over multi-decade hold.
- At projected returns (-3.0% appreciation + 3.0% rent growth), your $28k cash investment doubles in ~10 years — after that, you're playing with house money.
Negotiation context
- It's been on market 49 days — a 3% lower offer ($97k) is reasonable based on typical stale-listing flexibility.
Risks & watch-outs
- Climate carrying-cost: major wind risk, 27% chance of damaging wind over 30y; moderate wildfire risk; extreme-heat days projected 7→21/yr by 2055 (HVAC capex compounding) — expect insurance premiums to compound above CPI over the hold.
Questions for the listing agent
- It's been on market 49 days. Have you received any prior offers? Is the seller open to a 3% concession, seller financing, or rate buy-down credit?
- Is there a deadline driving the sale (1031 exchange, divorce, estate, relocation)? That informs how much negotiation room exists.
- What's the average days-on-market for RENTAL listings here right now (not sales)? A rising rental-DOM trend means longer vacancies and softer asking-rent achievability than the comps imply.
- What's the recent tenant-quality profile in this submarket — average credit score on applications, eviction rate, late-payment / NSF rate, and stable-employment percentage? A property-management company in the area should have these aggregated.
- How much new for-sale + rental construction is in the pipeline within 1–3 miles? Heavy new supply typically softens prices + rents 12–24 months out; constrained supply supports both.
Investment metrics
- 1% rule
- 1.11% ✓
- Cap rate
- 9.41%
- Cash-on-cash
- 11.14%
- DSCR
- 1.50
- GRM
- 7.5
CMA / ARV
No comps found within radius.
Projected returns pro-forma
-3.0% appreciation · 3.0% rent growth · sell at horizon
- IRR
- 0.3%
- Equity multiple
- 1.01×
- Total profit
- $320
- Equity at exit
- $14,910
- IRR
- 9.9%
- Equity multiple
- 1.77×
- Total profit
- $21,473
- Equity at exit
- $8,646
Cash invested: $28,000 (down + closing). Projections, not guarantees.
Landlord ↔ Tenant lean methodology
- Overall (STATE)
- 90 Strongly Landlord-Friendly
- State Mississippi
- 90 Strongly Landlord-Friendly · R+11
- County
- — inherits STATE
- City
- — inherits STATE
ZIP-level market 39773
- Home prices YoY
- -10.4%
- Active inventory
- 17
- Price-to-rent
- 7.5×
Monthly cashflow live
- Estimated rent
- $1,108 medium interval (Pro) →
- Mortgage (P&I)
- −$524
- Tax from tax record
- −$49 /mo · $588/yr
- Insurance
- −$42
- HOA
- −$0
- Vacancy / Maint / Mgmt
- −$233
- Net cashflow
- $260
Break-even live
UW: 25.0% down · 7.5% · 30yr · 1.5% tax · 5.0% vac · 8.0% maint · 8.0% mgmt
Financing live
Cash to close
- Down payment
- $25,000
- Closing costs
- $3,000
- Reserves months
- —
- Total cash needed
- —
Loan-product check · same deal, 3 products live
Conventional
25% down · 7.5% · 30yr
- Down + closing
- —
- Monthly P&I
- —
- Monthly cashflow
- —
- DSCR
- —
- Eligible?
- —
Personal DTI + credit; lowest rate.
DSCR
20% down · 8.5% · 30yr
- Down + closing
- —
- Monthly P&I
- —
- Monthly cashflow
- —
- DSCR
- —
- Eligible?
- —
No personal income docs; deal must DSCR.
Hard money
10% down · 12.0% · 12mo
- Down + closing
- —
- Monthly P&I
- —
- Monthly cashflow
- —
- DSCR
- —
- Eligible?
- —
Short-term bridge; refi at stabilization.
Listing history 17 events
-
2026-06-19days on market $100,000 Active 49 DOM
-
2026-06-18days on market $100,000 Active 48 DOM
-
2026-06-17days on market $100,000 Active 47 DOM
-
2026-06-16days on market $100,000 Active 46 DOM
-
2026-06-15days on market $100,000 Active 45 DOM
-
2026-06-14days on market $100,000 Active 43 DOM
-
2026-06-12days on market $100,000 Active 42 DOM
-
2026-06-09days on market $100,000 Active 39 DOM
-
2026-06-08days on market $100,000 Active 38 DOM
-
2026-06-07days on market $100,000 Active 37 DOM
-
2026-06-05days on market $100,000 Active 34 DOM
-
2026-06-03days on market $100,000 Active 33 DOM
-
2026-06-02days on market $100,000 Active 32 DOM
-
2026-06-01days on market $100,000 Active 31 DOM
-
2026-05-31days on market $100,000 Active 30 DOM
-
2026-05-30days on market $100,000 Active 29 DOM
-
2026-05-01$100,000 Active 1019-char remark
ⓘ Source: listings_history table (triggers on properties + properties_extension) + one-shot
backfill from property_details.listing_events for pre-trigger history.
Tax reassessment forecast MS · Resets to sale price
- Current annual tax
- $588 · $49/mo
- Projected year-2 tax
- $790 · $66/mo
- Expected delta
- +$202/yr (+$17/mo · 34.4%)
ⓘ Screening estimate from a state-policy table — verify with the county assessor before closing.
Climate risk First Street
- Flood 1/10 Low FEMA zone X (unshaded) · 0% chance over 30 yrs
- Wildfire 5/10 Major
- Heat 6/10 Major 7 d/yr ≥109°F today · 21 d/yr by 30 yrs out
- Wind 6/10 Major 27% chance of damaging wind over 30 yrs
- Air quality 2/10 Low 0 unhealthy d/yr today · 1 by 30 yrs out
Nearby sold comps map
Loading sold comps map…
Walkable amenities ~0.75 mi
Loading nearby amenities…
Taxation est. · year 1
- Rental income
- $13,291
- − Mortgage interest
- −$5,602
- − Property taxes
- −$588
- − Insurance
- −$500
- − Repairs & maintenance
- −$1,063
- − Management
- −$1,063
- − Depreciation
- −$2,909
- Taxable income
- $1,566
- Est. tax owed @ 24.0%
- −$376
- After-tax cash flow
- $2,743/yr
For passive investors: Depreciation is non-cash, so a rental often shows a tax loss while cash-flowing — sheltering income. Rental losses are passive: they offset passive income freely, and up to $25,000/yr can offset ordinary (W-2) income if you actively participate and your MAGI is under $100k (phasing out to $0 by $150k); unused losses carry forward. On sale, claimed depreciation is recaptured at up to 25%, and gains may owe capital-gains tax (a 1031 exchange can defer both). Figures are a year-1 estimate at your 24.0% rate — not tax advice; consult a CPA.
Schools (NCES district)
No district data.
Livability — Prairie
No livability data for this city. (Only ~50 U.S. cities are tracked.)
Census & demographics
- Population (ZIP)
- 14,771
Population outlook (Clay County) Hauer SSP2
- Today (2025)
- 19,339 people
- By 2030
- 18,773 · -2.9%
- By 2040
- 17,357 · -10.2%
- By 2050
- 15,891 · -17.8%
- By 2075
- 12,695 · -34.4%
- By 2100
- 9,930 · -48.7%
Race, ethnicity, and origin ACS 2023
- Neighborhood character
- Majority Black (60%)
- Race & ethnicity
- Black 60% White 39% Two or more races 1%
- Common ancestry
- Lithuanian 1%
- Foreign-born
- 1%
Political lean MEDSL · Clay
- 2024 margin
- D (+10.4) · D 54.8% · R 44.4%
- 2008→2024 swing
- -8.4pp toward R · 2008: 18.9pp · 2024: 10.4pp
- All cycles
- 2024: D+10.4 2020: D+16.3 2016: D+15.7 2012: D+22.0 2008: D+18.9
Not yet ingested
- Civics
- —
Market trends
- HPI YoY
- ▼ -16.19%
- Current HPI
- 139.7515
- Rent YoY
- —
- Metro
- —
- State GDP YoY
- —
- F500 in state
- 0
Price history
1 event — show timeline
- 2026-05-01 Listed $100,000 MLSU
Property tax history
+3.2%/yrLatest (2025): $588 · +1.3% YoY. Source: county tax records.
Cash-flow waterfall
monthlySold comps — $/sqft
last 12 mo · ≤1 miLoading sold comps…