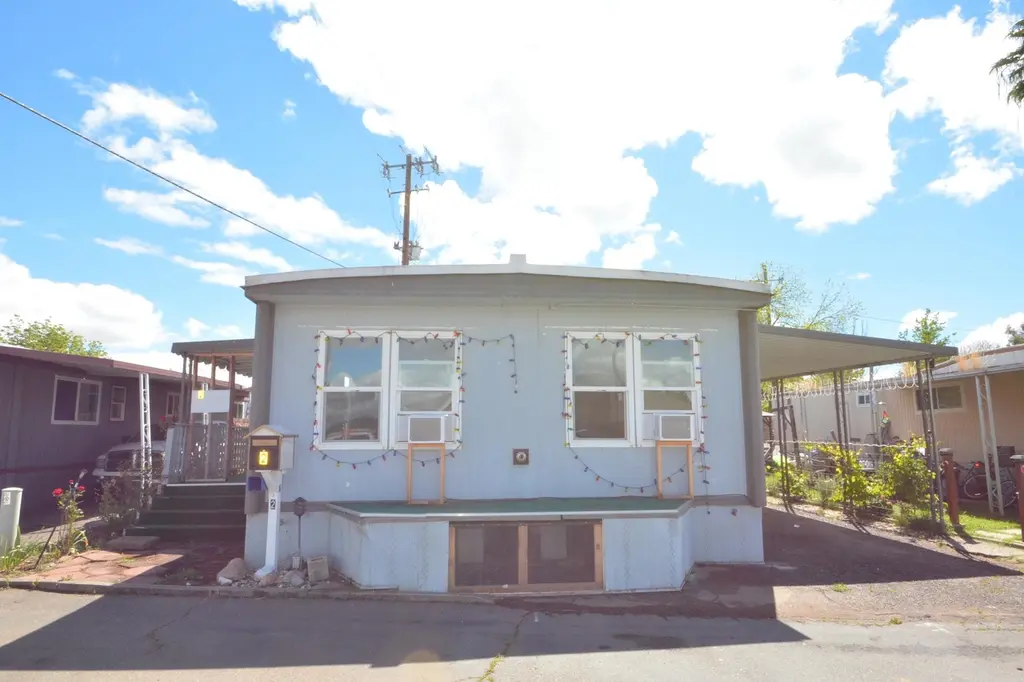
2 Rio Vista Ln · Red Bluff, CA
Flood risk 9/10 · Severe
- FEMA flood zone
- X (shaded)
- Chance of flooding over 30 yrs
- 0.99%
- Est. flood insurance / yr
- $507 – $1,088
Fire risk 8/10 · Major
- Est. fire insurance / yr
- $659 – $1,223
Heat risk 8/10 · Major
- Hot days now (above 105°F)
- 7 days/yr
- Hot days in 30 yrs
- 15 days/yr
Wind risk 1/10 · Minimal
- Chance of severe wind over 30 yrs
- —
Air-quality risk 10/10 · Severe
- Unhealthy air days now
- 32 days/yr
- Unhealthy air days in 30 yrs
- 34 days/yr
Risk factors via First Street. Map © Google.
Why this score? — see what drove the D- grade
The composite is a weighted blend of 9 inputs, each scored 0–100. Each bar is that input's sub-score; the figure is the points it added to the 100-point composite (weight × sub-score).
- Cash flow +15.0/30.0
- 1% rule +5.0/10.0
- DSCR +5.0/10.0
- Schools +3.3/10.0
- Livability +2.9/5.0
- Rent growth +2.7/5.0
- Condition / age +2.5/5.0
- ARV discount +0.0/15.0
- Appreciation +0.0/10.0
$25,000
🖨 Deal sheet 📄 Offer letter ✓ Due diligence
Listing remarks MLS
Nice 2/1 in family park. Located right by the clubhouse.
Key facts
- Low maintenance yard
- Quiet setting
- Built 1970
Tags
Property features AI
Exterior
- Parking: Attached carport; Has carport; Concrete and underground parking features
- Utilities: Natural gas available; Paved road access
- Home design: Manufactured home; Residential property; Park zoning (MHPark)
- Construction: Metal siding; Mobile home model Lancer; 20-foot mobile length
- Exterior features: Covered patio
Interior
- Kitchen: Gas oven; Gas range; Range hood
- Flooring: Vinyl
- Bathrooms: 1 full bathroom
- Heating & cooling: Wall/window air conditioning
- Interior features: Laminate counters; Range hood
- Laundry & utility: Laundry in common area
Neighborhood map
What this means for you Summary
Snapshot
- This is a 2-bed/1.0-bath manufactured listed at $25k.
Deal economics
- At list price, monthly cash flow is $748 ($9k/yr) — positive.
- The deal already cash-flows at list — no discount required.
- Meets the 1% rule at list price ($1k rent vs $25k).
- Recommended offer: $24k (6.0% below list) — sets the bar for market timing.
- Cap rate 45.4% vs local median 3.7% in Red Bluff — top-decile yield for the area; either an underpriced asset or a hidden risk that comps aren't pricing in. Stress-test before assuming the spread holds.
Location & tenants
- Location reads 58/100 on livability (#698 in CA) — a working-class tenant base; expect higher turnover. Strengths: health & safety A+, housing A-; Watch: cost of living D, crime F, amenities F.
- Antelope Elementary (town): math 34% / reading 44% proficiency, ranked #249 of 517 in CA (top 48%) — families likely to look elsewhere, expect single-tenant / working-renter base with shorter leases.
- Market conditions: Rents flat; 262 active listings in the ZIP; 186 units permitted in Tehama County in 2024 (0 in 5+ unit buildings).
Forward outlook
- Local home prices are declining (-3.0%/yr); year-one equity from $173 of loan paydown is wiped out by about $750 of value loss. Plan a longer hold.
- Tehama County population projected at -14% by 2050 — secular population decline; favor cash flow + early exit over multi-decade hold.
- At projected returns (-3.0% appreciation + 1.0% rent growth), your $7k cash investment doubles in ~1 year — after that, you're playing with house money.
Negotiation context
- It's been on market 64 days — a 6% lower offer ($24k) is reasonable based on typical stale-listing flexibility.
- 2 sale attempts since 4y ago; this cycle's ask has dropped $20k (44%) from the opening price — seller is motivated, your offer sets the floor, not the list.
Risks & watch-outs
- Watch-outs: flood insurance adds $66/mo.
- Climate carrying-cost: severe flood risk; severe wildfire risk; extreme-heat days projected 7→15/yr by 2055 (HVAC capex compounding) — expect insurance premiums to compound above CPI over the hold.
Questions for the listing agent
- It's been on market 64 days. Have you received any prior offers? Is the seller open to a 6% concession, seller financing, or rate buy-down credit?
- Built in 1970 — when were the roof, HVAC, electrical panel, plumbing, and water heater last replaced?
- What's the actual annual flood-insurance premium (NFIP or private), and is the property in a SFHA with mandatory coverage?
- Why hasn't it sold? Are there any deal-killer items the seller is aware of (foundation, flood, title, zoning, code violations)?
- Is there a deadline driving the sale (1031 exchange, divorce, estate, relocation)? That informs how much negotiation room exists.
- Crime grade is F in this area — have there been break-ins, vandalism, or insurance claims at this property in the last 3 years? What carrier currently insures it and at what premium?
- The area grade is low — what's the realistic commute time and amenity access for the typical tenant pool here? Any planned neighborhood developments (good or bad) we should know about?
- What's the average days-on-market for RENTAL listings here right now (not sales)? A rising rental-DOM trend means longer vacancies and softer asking-rent achievability than the comps imply.
- What's the recent tenant-quality profile in this submarket — average credit score on applications, eviction rate, late-payment / NSF rate, and stable-employment percentage? A property-management company in the area should have these aggregated.
- How much new for-sale + rental construction is in the pipeline within 1–3 miles? Heavy new supply typically softens prices + rents 12–24 months out; constrained supply supports both.
Investment metrics
- 1% rule
- 4.99% ✓
- Cap rate
- 45.38%
- Cash-on-cash
- 139.61%
- DSCR
- 7.21
- GRM
- 1.7
CMA / ARV
- ARV (on-the-fly)
- $20,800
- Comps found
- 5
Show comp detail 5 sales within ~0.75 mi
| Address | Dist | Beds/Ba | Sqft | Sold | Price | $/sf | Match |
|---|---|---|---|---|---|---|---|
| 184 Casa Grande Dr | 0.19mi | 2/1.0 | 720 (-10%) | 4mo | $19,000 | $26 | 71 |
| 18 Casa Grande Dr | 0.18mi | 2/2.0 | 720 (-10%) | 5mo | $17,000 | $24 | 67 |
| 9 Casa Grande Dr | 0.20mi | 2/2.0 | 880 (+10%) | 9mo | $68,500 | $78 | 62 |
| 44 Casa Grande Dr | 0.32mi | 2/1.0 | 868 (+8%) | 10mo | $59,050 | $68 | 62 |
| 172 Casa Grande Dr | 0.18mi | 2/2.0 | 720 (-10%) | 11mo | $15,000 | $21 | 62 |
Match score weights: distance 35% · size 25% · config 20% · recency 20%. Top-matched comps best support the ARV.
Projected returns pro-forma
-3.0% appreciation · 0.98% rent growth · sell at horizon
- IRR
- —
- Equity multiple
- 6.88×
- Total profit
- $41,157
- Equity at exit
- $3,728
- IRR
- —
- Equity multiple
- 13.52×
- Total profit
- $87,619
- Equity at exit
- $2,162
Cash invested: $7,000 (down + closing). Projections, not guarantees.
Landlord ↔ Tenant lean methodology
- Overall (STATE)
- 18 Strongly Tenant-Friendly
- State California
- 18 Strongly Tenant-Friendly · D+13
- County
- — inherits STATE
- City
- — inherits STATE
ZIP-level market 96080
- Rents YoY
- 1.0%
- Active inventory
- 262
- Price-to-rent
- 1.7×
Monthly cashflow live
- Estimated rent
- $1,248 medium interval (Pro) →
- Mortgage (P&I)
- −$131
- Tax from tax record
- −$30 /mo · $360/yr
- Insurance
- −$10
- Flood insurance flood zone
- −$66 /mo · $798/yr
- HOA
- −$0
- Vacancy / Maint / Mgmt
- −$262
- Net cashflow
- $748
Break-even live
UW: 25.0% down · 7.5% · 30yr · 1.5% tax · 5.0% vac · 8.0% maint · 8.0% mgmt
Financing live
Cash to close
- Down payment
- $6,250
- Closing costs
- $750
- Reserves months
- —
- Total cash needed
- —
Loan-product check · same deal, 3 products live
Conventional
25% down · 7.5% · 30yr
- Down + closing
- —
- Monthly P&I
- —
- Monthly cashflow
- —
- DSCR
- —
- Eligible?
- —
Personal DTI + credit; lowest rate.
DSCR
20% down · 8.5% · 30yr
- Down + closing
- —
- Monthly P&I
- —
- Monthly cashflow
- —
- DSCR
- —
- Eligible?
- —
No personal income docs; deal must DSCR.
Hard money
10% down · 12.0% · 12mo
- Down + closing
- —
- Monthly P&I
- —
- Monthly cashflow
- —
- DSCR
- —
- Eligible?
- —
Short-term bridge; refi at stabilization.
Listing history 21 events
-
2026-06-19days on market $25,000 Active 64 DOM
-
2026-06-18days on market $25,000 Active 63 DOM
-
2026-06-17days on market $25,000 Active 62 DOM
-
2026-06-17price $25,000 Active 61 DOM
-
2026-06-16days on market $39,000 Active 61 DOM
-
2026-06-15days on market $39,000 Active 60 DOM
-
2026-06-14days on market $39,000 Active 58 DOM
-
2026-06-12days on market $39,000 Active 57 DOM
-
2026-06-09days on market $39,000 Active 54 DOM
-
2026-06-08days on market $39,000 Active 53 DOM
-
2026-06-07days on market $39,000 Active 52 DOM
-
2026-06-05days on market $39,000 Active 49 DOM
-
2026-06-03days on market $39,000 Active 48 DOM
-
2026-06-02days on market $39,000 Active 47 DOM
-
2026-06-01days on market $39,000 Active 46 DOM
-
2026-05-31days on market $39,000 Active 45 DOM
-
2026-05-30days on market $39,000 Active 44 DOM
-
2026-05-20price $39,000
-
2026-04-16$45,000 Active
-
2022-10-06soldstatus $35,000 Closed 56-char remark
Show marketing remark (56 chars)
Nice 2/1 in family park. Located right by the clubhouse.
-
2022-08-22$32,000 Active 56-char remark
Show marketing remark (56 chars)
Nice 2/1 in family park. Located right by the clubhouse.
ⓘ Source: listings_history table (triggers on properties + properties_extension) + one-shot
backfill from property_details.listing_events for pre-trigger history.
Tax reassessment forecast CA · Resets to sale price
- Current annual tax
- $360 · $30/mo
- Projected year-2 tax
- $360 · $30/mo
- Expected delta
- $0/yr ($0/mo · 0.0%)
ⓘ Screening estimate from a state-policy table — verify with the county assessor before closing.
Climate risk First Street
- Flood 9/10 Extreme FEMA zone X (shaded) · 99% chance over 30 yrs
- Wildfire 8/10 Severe
- Heat 8/10 Severe 7 d/yr ≥105°F today · 15 d/yr by 30 yrs out
- Wind 1/10 Low
- Air quality 10/10 Extreme 32 unhealthy d/yr today · 34 by 30 yrs out
Nearby sold comps map
Loading sold comps map…
Walkable amenities ~0.75 mi
Loading nearby amenities…
Taxation est. · year 1
- Rental income
- $14,976
- − Mortgage interest
- −$1,400
- − Property taxes
- −$360
- − Insurance
- −$922
- − Repairs & maintenance
- −$1,198
- − Management
- −$1,198
- − Depreciation
- −$727
- Taxable income
- $9,169
- Est. tax owed @ 24.0%
- −$2,201
- After-tax cash flow
- $6,774/yr
For passive investors: Depreciation is non-cash, so a rental often shows a tax loss while cash-flowing — sheltering income. Rental losses are passive: they offset passive income freely, and up to $25,000/yr can offset ordinary (W-2) income if you actively participate and your MAGI is under $100k (phasing out to $0 by $150k); unused losses carry forward. On sale, claimed depreciation is recaptured at up to 25%, and gains may owe capital-gains tax (a 1031 exchange can defer both). Figures are a year-1 estimate at your 24.0% rate — not tax advice; consult a CPA.
Schools (NCES district)
- District
- Antelope Elementary
- NCES district ID
- 0602760
- Math proficiency
- 34% ▼ -11.00%
- Reading proficiency
- 44% ▼ -6.00%
- Median HH income
- $40,985
- Composite
- 32.77/100
- National rank
- #5630
- State rank
- #249 of 517 in CA
Livability — Red Bluff
- Score
- 58/100
- State rank
- #698
- US rank
- #21144
Category grades
Schools grade is shown separately in the Schools card above.
Census & demographics
- County
- Tehama County · 31,554 people
- City population
- 31,554
- Metro
- Red Bluff, CA
- Population (ZIP)
- 31,554
- Household income
- $66,076
- Rent vs Own
- Severe rent burden
- 981.0
Population outlook (Tehama County) Hauer SSP2
- Today (2025)
- 61,058 people
- By 2030
- 59,493 · -2.6%
- By 2040
- 56,076 · -8.2%
- By 2050
- 52,372 · -14.2%
- By 2075
- 43,895 · -28.1%
- By 2100
- 34,186 · -44.0%
Race, ethnicity, and origin ACS 2023
- Neighborhood character
- Predominantly White (71%)
- Race & ethnicity
- White 71% Hispanic / Latino 19% Two or more races 13% Native American 3% Black 2% Asian 1%
- Hispanic origin (detail)
- Mexican 17%
- Common ancestry
- Italian 2% Slovak 2% Lithuanian 2%
- Foreign-born
- 6% · Canada, Vietnam
- Languages at home
- 89% English-only · Spanish 9%
Political lean MEDSL · Tehama
- 2024 margin
- Solid R (+41.8) · D 27.9% · R 69.7% · Other 2.3%
- 2008→2024 swing
- -17.7pp toward R · 2008: -24.1pp · 2024: -41.8pp
- All cycles
- 2024: R+41.8 2020: R+35.6 2016: R+36.8 2012: R+27.4 2008: R+24.1
Not yet ingested
- Civics
- —
Market trends
- HPI YoY
- ▼ -139.80%
- Current HPI
- 246.877
- Rent YoY
- ▲ 0.98%
- Metro
- Red Bluff, CA
- State GDP YoY
- ▲ 3.21%
- F500 in state
- 116
Industry mix (Fortune 500 HQ in CA)
| Industry | F500 HQs | Revenue |
|---|---|---|
| Technology | 27 | $1,492B |
|
||
| Financial Services | 3 | $174B |
|
||
| Retail | 3 | $44B |
|
||
| Insurance | 3 | $26B |
|
||
| Media / Entertainment | 2 | $115B |
|
||
| Pharmaceuticals / Biotech | 2 | $62B |
|
||
Price history
+21.9% since first listed4 events — show timeline
- 2026-05-20 Price Changed $39,000 TCAOR
- 2026-04-16 Listed $45,000 TCAOR
- 2022-10-06 Sold (MLS) $35,000 TCAOR
- 2022-08-22 Listed $32,000 TCAOR
Property tax history
-0.3%/yrLatest (2025): $360 · -0.0% YoY. Source: county tax records.
Cash-flow waterfall
monthlySold comps — $/sqft
last 12 mo · ≤1 miLoading sold comps…