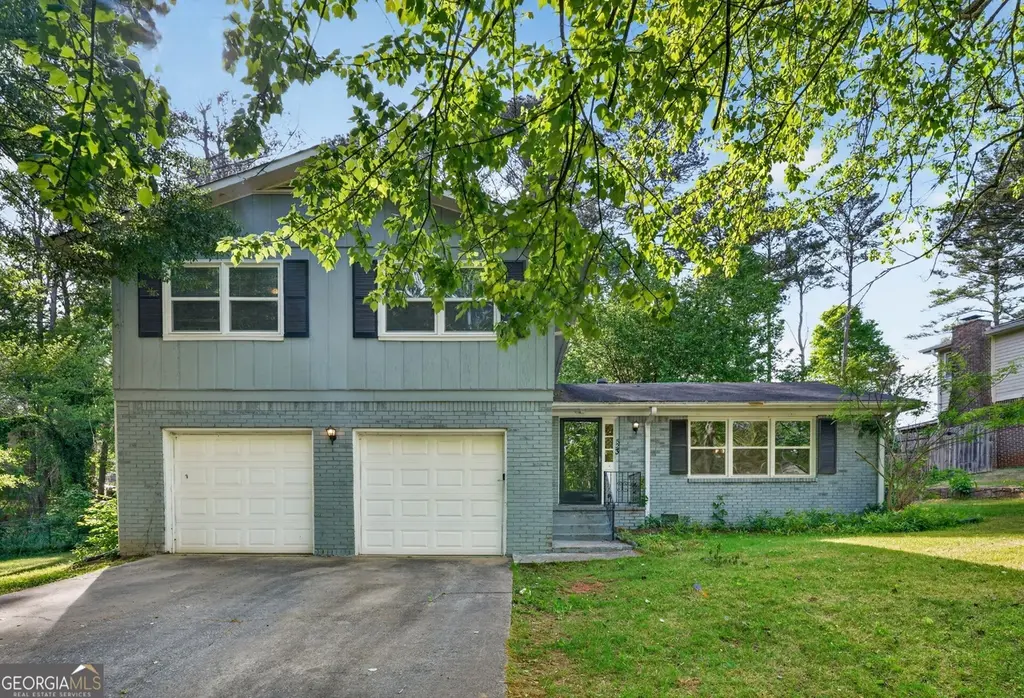
523 Barbashela Cir · Stone Mountain, GA
Flood risk 1/10 · Minimal
- FEMA flood zone
- X (unshaded)
- Chance of flooding over 30 yrs
- 0.0%
- Est. flood insurance / yr
- $507 – $1,088
Fire risk 2/10 · Minimal
- Est. fire insurance / yr
- $963 – $1,789
Heat risk 6/10 · Moderate
- Hot days now (above 104°F)
- 7 days/yr
- Hot days in 30 yrs
- 18 days/yr
Wind risk 5/10 · Moderate
- Chance of severe wind over 30 yrs
- 23.0%
Air-quality risk 6/10 · Moderate
- Unhealthy air days now
- 8 days/yr
- Unhealthy air days in 30 yrs
- 11 days/yr
Risk factors via First Street. Map © Google.
Why this score? — see what drove the D grade
The composite is a weighted blend of 9 inputs, each scored 0–100. Each bar is that input's sub-score; the figure is the points it added to the 100-point composite (weight × sub-score).
- ARV discount +13.1/15.0
- Cash flow +11.5/30.0
- Livability +4.0/5.0
- 1% rule +3.8/10.0
- DSCR +3.4/10.0
- Rent growth +3.4/5.0
- Condition / age +2.5/5.0
- Schools +2.1/10.0
- Appreciation +0.0/10.0
$259,900
🖨 Deal sheet (PDF) 📄 Offer letter ✓ Due diligence
Listing remarks
Take advantage of this spacious and well-maintained 4-bedroom, 3.5-bathroom split-level home situated in the established Mountain Valley community of Stone Mountain. Featuring a classic four-side brick exterior, this traditional residence offers a functional layout perfect for families or multi-generational living. The main level welcomes you with beautiful hardwood flooring, a bright formal living room, and a separate dining area that flows into a masterfully designed kitchen featuring an island cooktop and ample cabinet space. Just a few steps down, the expansive family room serves as the heart of the home, anchored by a cozy floor-to-ceiling brick fireplace. French doors lead to a versat
Key facts
- Hardwood flooring
- Partial basement
- Versatile sunroom
Tags
Property features AI
Finance
- Other: Listing accepts Cash, Conventional, FHA, and VA financing
- HOA & community: No HOA
Exterior
- Parking: Attached garage; 2 parking spaces (total)
- Utilities: Public water; Public sewer; Other utilities
- Home design: Single family residence (house); Resale property; 4-side brick split-level appearance (per directions / listing notes)
- Construction: Built in 1971; Brick and wood siding exterior; Composition roof; Slab foundation
- Exterior features: Sloped lot
Interior
- Kitchen: Cooktop; Dishwasher
- Bedrooms: 4 bedrooms
- Flooring: Carpet; Hardwood; Tile
- Bathrooms: 3 full bathrooms and 1 half bathroom (3.5 total)
- Heating & cooling: Forced air heating; Central air conditioning
- Interior features: Multi/split levels; Fireplace in the family room; Separate dining room; Basement: None; Other interior features
- Laundry & utility: Laundry features: Other
Neighborhood map
What this means for you Summary
Snapshot
- This is a 4-bed/3.5-bath single-family listed at $260k.
Deal economics
- At list price, monthly cash flow is $-85 ($-1k/yr) — negative.
- To cash-flow at today's rent, offer at most $245k (5.8% below list).
- To meet the 1% rule (rent ≥ 1% of price), the offer needs to be $228k (12.1% below list).
- Recommended offer: $228k (12.1% below list) — sets the bar for 1% rule.
Location & tenants
- Location reads 79/100 on livability (#11 in GA, #1,977 nationally) — a middle-class / working-renter tenant base. Strengths: commute A+, cost of living A+, housing A+; Watch: employment D+, crime F.
- Dekalb County (suburban): math 19% / reading 28% proficiency, ranked #125 of 174 in GA (top 72%) — low school quality limits family demand, transient renter base, plan for 1-2y turnover; 68% free/reduced lunch — lower-income household profile, screen leases tightly.
- Zoned schools: Rockbridge Elementary School (math 8% / reading 17%, grade F, #1,032 of 1,228 statewide, top 85%, 894 students, 100% FRL); Stone Mountain Middle School (math 12% / reading 15%, grade F, #407 of 470 statewide, top 87%, 1,072 students, 100% FRL); Stone Mountain High School (math 8% / reading 12%, grade F, #365 of 424 statewide, top 88%, 1,202 students, 100% FRL) — zoned schools average 100% FRL vs 68% district-wide (32 pts higher); higher-poverty schools than district average — tighter screening recommended.
- Market conditions: Rents rising (+3.7%/yr); 220 active listings in the ZIP; 2 comparable units currently listed for rent nearby; 1,240 units permitted in DeKalb County in 2024 (385 in 5+ unit buildings).
- This rent runs 39% of the median local income ($70k/yr) — at the standard rent-burdened threshold; future hikes will face affordability resistance.
Forward outlook
- Local home prices are declining (-3.0%/yr); year-one equity from $2k of loan paydown is wiped out by about $8k of value loss. Plan a longer hold.
- DeKalb County population projected at +28% by 2050 — long-run rental-demand tailwind backs the buy-and-hold thesis.
Negotiation context
- It's been on market 39 days — a 3% lower offer ($252k) is reasonable based on typical stale-listing flexibility.
- 3 sale attempts; this cycle's ask has dropped $15k (5%) from the opening price — seller is motivated, your offer sets the floor, not the list.
- Current owner paid $101k; list at $260k implies a 157% gain — meaningful room to come down on a strong offer.
Risks & watch-outs
- Climate carrying-cost: moderate wind risk, 23% chance of damaging wind over 30y; extreme-heat days projected 7→18/yr by 2055 (HVAC capex compounding) — expect insurance premiums to compound above CPI over the hold.
Questions for the listing agent
- What do current leases actually rent for vs. the listed asking? Can we see a recent rent roll and the last 12 months of T-12 income?
- It's been on market 39 days. Have you received any prior offers? Is the seller open to a 12% concession, seller financing, or rate buy-down credit?
- Built in 1971 — when were the roof, HVAC, electrical panel, plumbing, and water heater last replaced?
- Is there a deadline driving the sale (1031 exchange, divorce, estate, relocation)? That informs how much negotiation room exists.
- Schools are F-rated, which usually means shorter tenancies and higher turnover. Who's the typical renter profile here, and what's been the actual vacancy rate?
- Crime grade is F in this area — have there been break-ins, vandalism, or insurance claims at this property in the last 3 years? What carrier currently insures it and at what premium?
- The area grade is low — what's the realistic commute time and amenity access for the typical tenant pool here? Any planned neighborhood developments (good or bad) we should know about?
- What's the average days-on-market for RENTAL listings here right now (not sales)? A rising rental-DOM trend means longer vacancies and softer asking-rent achievability than the comps imply.
- What's the recent tenant-quality profile in this submarket — average credit score on applications, eviction rate, late-payment / NSF rate, and stable-employment percentage? A property-management company in the area should have these aggregated.
- How much new for-sale + rental construction is in the pipeline within 1–3 miles? Heavy new supply typically softens prices + rents 12–24 months out; constrained supply supports both.
Investment metrics
- 1% rule
- 0.88% ✗
- Cap rate
- 5.90%
- Cash-on-cash
- -1.41%
- DSCR
- 0.94
- GRM
- 9.5
CMA / ARV
- ARV (median comp)
- $296,918
- List price
- $259,900
- Delta
- -12.47%
- Verdict
- UNDERPRICED
- Comps
- 20 within 1.0 mi
Show comp detail 3 sales within ~0.75 mi
| Address | Dist | Beds/Ba | Sqft | Sold | Price | $/sf | Match |
|---|---|---|---|---|---|---|---|
| 524 Barbashela Dr | 0.14mi | 5/3.0 (+1) | 3,467 (+6%) | 16mo | $285,000 | $82 | 64 |
| 4853 Pine Shadows Dr | 0.32mi | 5/3.0 (+1) | 3,030 (-7%) | 8mo | $219,000 | $72 | 60 |
| 5013 Owen Mill Ln | 0.46mi | 4/2.5 | 2,816 (-14%) | 7mo | $346,900 | $123 | 45 |
Match score weights: distance 35% · size 25% · config 20% · recency 20%. Top-matched comps best support the ARV.
Projected returns pro-forma
-3.0% appreciation · 3.72% rent growth · sell at horizon
- IRR
- -17.7%
- Equity multiple
- 0.37×
- Total profit
- $-45,794
- Equity at exit
- $38,752
- IRR
- -8.4%
- Equity multiple
- 0.46×
- Total profit
- $-39,566
- Equity at exit
- $22,471
Cash invested: $72,772 (down + closing). Projections, not guarantees.
Landlord ↔ Tenant lean methodology
- Overall (STATE)
- 90 Strongly Landlord-Friendly
- State Georgia
- 90 Strongly Landlord-Friendly · R+3
- County
- — inherits STATE
- City
- — inherits STATE
ZIP-level market 30088
- Rents YoY
- 3.7%
- Active inventory
- 220
- Price-to-rent
- 9.5×
Monthly cashflow live
- Estimated rent
- $2,284 medium interval (Pro) →
- Mortgage (P&I)
- −$1,363
- Tax from tax record
- −$418 /mo · $5,020/yr
- Insurance
- −$108
- HOA
- −$0
- Vacancy / Maint / Mgmt
- −$480
- Net cashflow
- $-85
Break-even live
Sensitivity live
| Price | -10% $62 | -5% $-12 | +0% $-85 | +5% $-159 | +10% $-232 |
|---|---|---|---|---|---|
| Rent | -10% $-266 | -5% $-176 | +0% $-85 | +5% $5 | +10% $95 |
| Rate | -1.0pp $46 | -0.5pp $-19 | base $-85 | +0.5pp $-153 | +1.0pp $-221 |
UW: 25.0% down · 7.5% · 30yr · 1.5% tax · 5.0% vac · 8.0% maint · 8.0% mgmt
Financing live
Cash to close
- Down payment
- $64,975
- Closing costs
- $7,797
- Reserves months
- —
- Total cash needed
- —
Loan-product check · same deal, 3 products live
Conventional
25% down · 7.5% · 30yr
- Down + closing
- —
- Monthly P&I
- —
- Monthly cashflow
- —
- DSCR
- —
- Eligible?
- —
Personal DTI + credit; lowest rate.
DSCR
20% down · 8.5% · 30yr
- Down + closing
- —
- Monthly P&I
- —
- Monthly cashflow
- —
- DSCR
- —
- Eligible?
- —
No personal income docs; deal must DSCR.
Hard money
10% down · 12.0% · 12mo
- Down + closing
- —
- Monthly P&I
- —
- Monthly cashflow
- —
- DSCR
- —
- Eligible?
- —
Short-term bridge; refi at stabilization.
Rent comps 2 comps
| Address | Beds | Baths | Sqft | Rent | $/sqft | DOM | Units | Dist |
|---|---|---|---|---|---|---|---|---|
| 5002 Post Road Ct Stone Mountain, GA | 4.0 | 2.5 | 3579 | $2,130 | $0.60 | 5d | 1 | 0.82mi |
| 855 Lost Creek Cir Stone Mountain, GA | 4.0 | 2.5 | 2619 | $1,946 | $0.74 | 45d | 1 | 1.05mi |
Listing history 12 events
-
2026-06-21pricestatusdays on market $259,900 Active 39 DOM
-
2026-06-18status $269,900 Back On Market 36 DOM
-
2026-06-02status $269,900 Under Contract 36 DOM
-
2026-06-01days on market $269,900 Active 36 DOM
-
2026-05-31days on market $269,900 Active 35 DOM
-
2026-05-14price $269,900 1155-char remark
-
2026-05-12status Back On Market 1155-char remark
-
2026-05-07status Under Contract 1155-char remark
-
2026-04-21$274,900 New 1155-char remark
-
1996-03-04soldstatus $101,000
-
1987-05-15soldstatus $83,900
-
1981-07-24soldstatus $68,000
ⓘ Source: listings_history table (triggers on properties + properties_extension) + one-shot
backfill from property_details.listing_events for pre-trigger history.
Tax reassessment forecast GA · Resets to sale price
- Current annual tax
- $5,020 · $418/mo
- Projected year-2 tax
- $5,020 · $418/mo
- Expected delta
- $0/yr ($0/mo · 0.0%)
ⓘ Screening estimate from a state-policy table — verify with the county assessor before closing.
Climate risk First Street
- Flood 1/10 Low FEMA zone X (unshaded) · 0% chance over 30 yrs
- Wildfire 2/10 Low
- Heat 6/10 Major 7 d/yr ≥104°F today · 18 d/yr by 30 yrs out
- Wind 5/10 Major 23% chance of damaging wind over 30 yrs
- Air quality 6/10 Major 8 unhealthy d/yr today · 11 by 30 yrs out
Nearby sold comps map
Loading sold comps map…
Walkable amenities ~0.75 mi
Loading nearby amenities…
Taxation est. · year 1
- Rental income
- $27,406
- − Mortgage interest
- −$14,558
- − Property taxes
- −$5,020
- − Insurance
- −$1,300
- − Repairs & maintenance
- −$2,192
- − Management
- −$2,192
- − Depreciation
- −$7,561
- Taxable loss
- −$5,418
- Est. tax savings @ 24.0%
- +$1,300
- After-tax cash flow
- $276/yr
For passive investors: Depreciation is non-cash, so a rental often shows a tax loss while cash-flowing — sheltering income. Rental losses are passive: they offset passive income freely, and up to $25,000/yr can offset ordinary (W-2) income if you actively participate and your MAGI is under $100k (phasing out to $0 by $150k); unused losses carry forward. On sale, claimed depreciation is recaptured at up to 25%, and gains may owe capital-gains tax (a 1031 exchange can defer both). Figures are a year-1 estimate at your 24.0% rate — not tax advice; consult a CPA.
Schools (NCES district)
- District
- Dekalb County
- NCES district ID
- 1301740
- Math proficiency
- 19% ▼ -12.00%
- Reading proficiency
- 28% ▼ -7.00%
- Median HH income
- $51,448
- Composite
- 20.92/100
- National rank
- #8482
- State rank
- #125 of 174 in GA
Livability — Stone Mountain
- Score
- 79/100
- State rank
- #11
- US rank
- #1977
Category grades
Schools grade is shown separately in the Schools card above.
Census & demographics
- County
- Dekalb County · 782,738 people
- City population
- 130,941
- Metro
- Atlanta-Sandy Springs-Alpharetta, GA
- Population (ZIP)
- 29,240
- Household income
- $70,325
- Rent vs Own
- Severe rent burden
- 1106.0
Population outlook (DeKalb County) Hauer SSP2
- Today (2025)
- 839,977 people
- By 2030
- 891,768 · +6.2%
- By 2040
- 988,894 · +17.7%
- By 2050
- 1,074,583 · +27.9%
- By 2075
- 1,245,026 · +48.2%
- By 2100
- 1,303,135 · +55.1%
Race, ethnicity, and origin ACS 2023
- Neighborhood character
- Predominantly Black (84%)
- Race & ethnicity
- Black 84% White 5% Hispanic / Latino 5% Two or more races 5%
- Common ancestry
- Swedish 1% Russian 1%
- Foreign-born
- 11% · Canada
- Languages at home
- 90% English-only · Spanish 4% French/Haitian/Cajun 1% Other Indo-European 1%
Political lean MEDSL · DeKalb
- 2024 margin
- Solid D (+64.8) · D 81.9% · R 17.1% · Other 1.0%
- 2008→2024 swing
- +6.1pp toward D · 2008: 58.6pp · 2024: 64.8pp
- All cycles
- 2024: D+64.8 2020: D+67.4 2016: D+64.8 2012: D+56.8 2008: D+58.6
Not yet ingested
- Civics
- —
Market trends
- HPI YoY
- ▼ -169.92%
- Current HPI
- 206.5421
- Rent YoY
- ▲ 3.72%
- Metro
- Atlanta-Sandy Springs-Alpharetta, GA
- State GDP YoY
- ▲ 2.66%
- F500 in state
- 28
Industry mix (Fortune 500 HQ in GA)
| Industry | F500 HQs | Revenue |
|---|---|---|
| Paper / Packaging | 2 | $29B |
|
||
| Retail | 1 | $160B |
|
||
| Transportation / Logistics | 1 | $91B |
|
||
| Airlines | 1 | $62B |
|
||
| Consumer Goods | 1 | $47B |
|
||
| Utilities | 1 | $25B |
|
||
Price history
+282.2% since first listed10 events — show timeline
- 2026-06-18 Price Changed $259,900 GAMLS
- 2026-06-18 Relisted — GAMLS
- 2026-06-01 Pending — GAMLS
- 2026-05-14 Price Changed $269,900 GAMLS
- 2026-05-12 Relisted — GAMLS
- 2026-05-07 Pending — GAMLS
- 2026-04-21 Listed $274,900 GAMLS
- 1996-03-04 Sold (Public Records) $101,000 Public Records
- 1987-05-15 Sold (Public Records) $83,900 Public Records
- 1981-07-24 Sold (Public Records) $68,000 Public Records
Property tax history
+10.7%/yrLatest (2025): $5,020 · +0.0% YoY. Source: county tax records.
Cash-flow waterfall
monthlySold comps — $/sqft
last 12 mo · ≤1 miLoading sold comps…