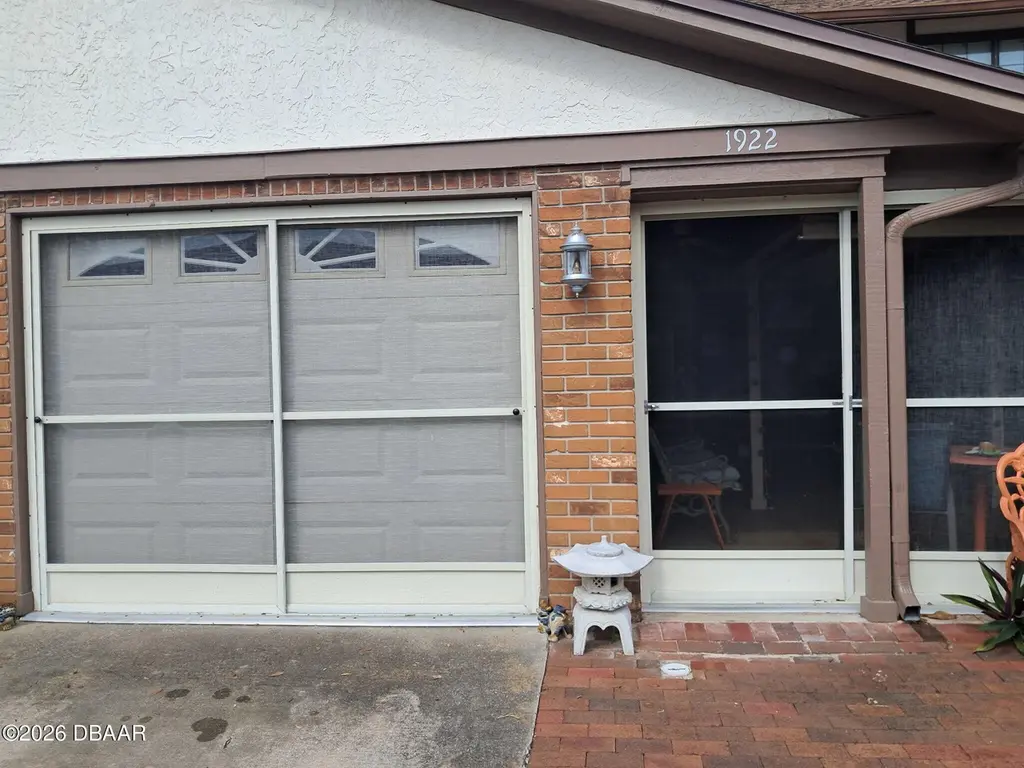
1922 S Riverside Dr · Edgewater, FL
Flood risk 6/10 · Moderate
- FEMA flood zone
- X (unshaded)
- Chance of flooding over 30 yrs
- 0.54%
- Est. flood insurance / yr
- $507 – $1,088
Fire risk 3/10 · Minor
- Est. fire insurance / yr
- $947 – $1,759
Heat risk 10/10 · Severe
- Hot days now (above 105°F)
- 7 days/yr
- Hot days in 30 yrs
- 22 days/yr
Wind risk 10/10 · Severe
- Chance of severe wind over 30 yrs
- 99.0%
Air-quality risk 2/10 · Minimal
- Unhealthy air days now
- 1 days/yr
- Unhealthy air days in 30 yrs
- 1 days/yr
Risk factors via First Street. Map © Google.
Why this score? — see what drove the D grade
The composite is a weighted blend of 9 inputs, each scored 0–100. Each bar is that input's sub-score; the figure is the points it added to the 100-point composite (weight × sub-score).
- Cash flow +15.3/30.0
- ARV discount +7.5/15.0
- DSCR +4.7/10.0
- Schools +3.9/10.0
- Livability +3.6/5.0
- 1% rule +3.0/10.0
- Rent growth +2.5/5.0
- Condition / age +2.5/5.0
- Appreciation +0.0/10.0
$251,000
🖨 Deal sheet (PDF) 📄 Offer letter ✓ Due diligence
Listing remarks MLS
Great location to the river! This small community is the perfect place to call home or generate income. * * NO HOA * * 2 large bedrooms each with their own full bathroom and a half bath downstairs. Fenced in courtyard too! * * HVAC 2020 * * Roof 2016 * * Washer and dryer in unit.
Key facts
- Work bench
- No flooding
- One car garage
Tags
Property features AI
Finance
- Other: Zero lot line; Few trees on lot; Concrete road frontage (private road)
- Financial info: Financial details not provided
- HOA & community: Private maintained road
Exterior
- Parking: Assigned garage parking; Garage door opener; 1-car garage
- Security: Smoke detectors; Carbon monoxide detectors
- Utilities: Public water; Public sewer; Electricity connected (100 amp service, 220 volts); Cable available; Water connected; Sewer connected
- Home design: Townhouse (attached); Two levels; Entry level 1; Facing east; Updated/remodeled condition; Single-family use
- Construction: Built with frame, redwood siding and stucco; Shingle roof; Slab foundation
- Exterior features: Courtyard; Awning-covered and screened porches (front and rear); Porch; Rear porch; Front porch; Wood fenced backyard
Interior
- Kitchen: Refrigerator; Microwave; Electric oven; Dishwasher; Disposal; Electric water heater
- Bedrooms: Bedrooms information not specified
- Flooring: Tile flooring
- Bathrooms: 2 full bathrooms; 1 half bathroom
- Heating & cooling: Heat pump; Central air; Ceiling fans
- Interior features: Breakfast bar; Ceiling fans; Entrance foyer; His and hers closets; Open floorplan
- Laundry & utility: Washer and dryer included; Laundry located in unit (lower level / in basement)
Neighborhood map
What this means for you Summary
Snapshot
- This is a 2-bed/2.5-bath townhouse listed at $251k.
Deal economics
- At list price, monthly cash flow is $93 ($1k/yr) — positive.
- The deal already cash-flows at list — no discount required.
- To meet the 1% rule (rent ≥ 1% of price), the offer needs to be $201k (20.1% below list).
- Recommended offer: $201k (20.1% below list) — sets the bar for 1% rule.
Location & tenants
- Location reads 72/100 on livability (#329 in FL) — a middle-class / working-renter tenant base. Strengths: cost of living A+, housing A+, health & safety A+; Watch: amenities D-, commute F.
- Volusia (suburban): math 44% / reading 49% proficiency, ranked #47 of 73 in FL (top 64%) — families likely to look elsewhere, expect single-tenant / working-renter base with shorter leases.
- Zoned schools: Edgewater Public School (math 67% / reading 52%, grade B-, #690 of 2,144 statewide, top 34%, 504 students, 64% FRL); New Smyrna Beach Middle School (math 43% / reading 43%, grade D-, #331 of 571 statewide, top 59%, 1,037 students, 53% FRL); New Smyrna Beach High School (math 34% / reading 52%, grade F, #255 of 667 statewide, top 39%, 1,810 students, 41% FRL) — zoned schools at 53% FRL track the district average.
- Market conditions: 307 active listings in the ZIP; 11 comparable units currently listed for rent nearby; rentals at typical pace (median 21d on market — plan ~3-4 weeks tenant-placement turnaround); 3,402 units permitted in Volusia County in 2024 (681 in 5+ unit buildings).
- This rent runs 38% of the median local income ($64k/yr) — at the standard rent-burdened threshold; future hikes will face affordability resistance.
Forward outlook
- Local home prices are declining (-3.0%/yr); year-one equity from $2k of loan paydown is wiped out by about $8k of value loss. Plan a longer hold.
- Volusia County population projected at +19% by 2050 — long-run rental-demand tailwind backs the buy-and-hold thesis.
Negotiation context
- Only 11 days on market — expect competitive offers; lowballing is unlikely to land.
- 9 sale attempts since 15y ago with the ask held roughly flat each time — persistent listings suggest the price (not the market) is what's stuck; bring a comps-based counter.
Risks & watch-outs
- Climate carrying-cost: major flood risk; severe wind risk, 99% chance of damaging wind over 30y; extreme-heat days projected 7→22/yr by 2055 (HVAC capex compounding) — expect insurance premiums to compound above CPI over the hold.
Questions for the listing agent
- Is there a deadline driving the sale (1031 exchange, divorce, estate, relocation)? That informs how much negotiation room exists.
- The area grade is low — what's the realistic commute time and amenity access for the typical tenant pool here? Any planned neighborhood developments (good or bad) we should know about?
- What's the average days-on-market for RENTAL listings here right now (not sales)? A rising rental-DOM trend means longer vacancies and softer asking-rent achievability than the comps imply.
- What's the recent tenant-quality profile in this submarket — average credit score on applications, eviction rate, late-payment / NSF rate, and stable-employment percentage? A property-management company in the area should have these aggregated.
- How much new for-sale + rental construction is in the pipeline within 1–3 miles? Heavy new supply typically softens prices + rents 12–24 months out; constrained supply supports both.
Investment metrics
- 1% rule
- 0.80% ✗
- Cap rate
- 6.74%
- Cash-on-cash
- 1.58%
- DSCR
- 1.07
- GRM
- 10.4
CMA / ARV
No comps found within radius.
Projected returns pro-forma
-3.0% appreciation · 3.0% rent growth · sell at horizon
- IRR
- -13.8%
- Equity multiple
- 0.50×
- Total profit
- $-34,897
- Equity at exit
- $37,425
- IRR
- -5.1%
- Equity multiple
- 0.67×
- Total profit
- $-23,281
- Equity at exit
- $21,702
Cash invested: $70,280 (down + closing). Projections, not guarantees.
Landlord ↔ Tenant lean methodology
- Overall (STATE)
- 87 Strongly Landlord-Friendly
- State Florida
- 87 Strongly Landlord-Friendly · R+3
- County
- — inherits STATE
- City
- — inherits STATE
ZIP-level market 32141
- Home prices YoY
- -19.2%
- Active inventory
- 307
- Price-to-rent
- 10.4×
Monthly cashflow live
- Estimated rent
- $2,005 high interval (Pro) →
- Mortgage (P&I)
- −$1,316
- Tax from tax record
- −$71 /mo · $847/yr
- Insurance
- −$105
- HOA
- −$0
- Vacancy / Maint / Mgmt
- −$421
- Net cashflow
- $93
Break-even live
Sensitivity live
| Price | -10% $235 | -5% $164 | +0% $93 | +5% $22 | +10% $-50 |
|---|---|---|---|---|---|
| Rent | -10% $-66 | -5% $13 | +0% $93 | +5% $172 | +10% $251 |
| Rate | -1.0pp $219 | -0.5pp $156 | base $93 | +0.5pp $28 | +1.0pp $-39 |
UW: 25.0% down · 7.5% · 30yr · 1.5% tax · 5.0% vac · 8.0% maint · 8.0% mgmt
Financing live
Cash to close
- Down payment
- $62,750
- Closing costs
- $7,530
- Reserves months
- —
- Total cash needed
- —
Loan-product check · same deal, 3 products live
Conventional
25% down · 7.5% · 30yr
- Down + closing
- —
- Monthly P&I
- —
- Monthly cashflow
- —
- DSCR
- —
- Eligible?
- —
Personal DTI + credit; lowest rate.
DSCR
20% down · 8.5% · 30yr
- Down + closing
- —
- Monthly P&I
- —
- Monthly cashflow
- —
- DSCR
- —
- Eligible?
- —
No personal income docs; deal must DSCR.
Hard money
10% down · 12.0% · 12mo
- Down + closing
- —
- Monthly P&I
- —
- Monthly cashflow
- —
- DSCR
- —
- Eligible?
- —
Short-term bridge; refi at stabilization.
Rent comps 11 comps
| Address | Beds | Baths | Sqft | Rent | $/sqft | DOM | Units | Dist |
|---|---|---|---|---|---|---|---|---|
| 120 Hardin Pl Edgewater, FL | 3.0 | 2.0 | 1455 | $2,075 | $1.43 | 16d | 1 | 0.35mi |
| 1000 Egret Ct Edgewater, FL | 2.0 | 2.0 | 1051 | $2,400 | $2.28 | 25d | 1 | 0.45mi |
| 121 W Marion Ave Edgewater, FL | 2.0 | 2.0 | 1020 | $1,250 | $1.23 | 25d | 1 | 0.64mi |
| 2314 Fern Palm Dr Unit 2314 Edgewater, FL | 2.0 | 2.0 | 1200 | $1,700 | $1.42 | 21d | 1 | 0.77mi |
| 2330 India Palm Dr Edgewater, FL | 2.0 | 2.0 | 1025 | $1,499 | $1.46 | 16d | 1 | 0.92mi |
| 2515 Fern Palm Dr Edgewater, FL | 3.0 | 2.0 | 1400 | $2,200 | $1.57 | 13d | 1 | 0.97mi |
| 2421 India Palm Dr Edgewater, FL | 3.0 | 2.0 | 1358 | $2,150 | $1.58 | 21d | 1 | 0.98mi |
| 2621 India Palm Dr Edgewater, FL | 3.0 | 2.0 | 1269 | $2,400 | $1.89 | 25d | 1 | 1.18mi |
| 1822 Royal Palm Dr Edgewater, FL | 3.0 | 2.0 | 1400 | $1,620 | $1.16 | 16d | 1 | 1.18mi |
| 2219 Umbrella Tree Dr Edgewater, FL | 3.0 | 2.0 | 1446 | $2,300 | $1.59 | 25d | 1 | 1.40mi |
| 706 Mary St Edgewater, FL | 2.0 | 1.5 | 1025 | $1,600 | $1.56 | 25d | 1 | 1.42mi |
Listing history 14 events
-
2026-06-22days on market $251,000 Active 11 DOM
-
2026-06-18days on market $251,000 Active 8 DOM
-
2026-06-17days on market $251,000 Active 7 DOM
-
2026-06-16days on market $251,000 Active 6 DOM
-
2026-06-15days on market $251,000 Active 5 DOM
-
2026-06-14days on market $251,000 Active 3 DOM
-
2026-06-10days on market $251,000 Active 9 DOM
-
2026-06-09days on market $251,000 Active 8 DOM
-
2026-06-08days on market $251,000 Active 7 DOM
-
2026-06-07days on market $251,000 Active 6 DOM
-
2026-06-05days on market $251,000 Active 3 DOM
-
2026-06-03days on market $251,000 Active 2 DOM
-
2026-06-02remarks 699-char remark
-
2026-06-02$251,000 Active 1 DOM
ⓘ Source: listings_history table (triggers on properties + properties_extension) + one-shot
backfill from property_details.listing_events for pre-trigger history.
Tax reassessment forecast FL · Resets to sale price
- Current annual tax
- $847 · $71/mo
- Projected year-2 tax
- $2,083 · $174/mo
- Expected delta
- +$1,236/yr (+$103/mo · 145.9%)
ⓘ Screening estimate from a state-policy table — verify with the county assessor before closing.
Climate risk First Street
- Flood 6/10 Major FEMA zone X (unshaded) · 54% chance over 30 yrs
- Wildfire 3/10 Moderate
- Heat 10/10 Extreme 7 d/yr ≥105°F today · 22 d/yr by 30 yrs out
- Wind 10/10 Extreme 99% chance of damaging wind over 30 yrs
- Air quality 2/10 Low 1 unhealthy d/yr today · 1 by 30 yrs out
Nearby sold comps map
Loading sold comps map…
Walkable amenities ~0.75 mi
Loading nearby amenities…
Taxation est. · year 1
- Rental income
- $24,061
- − Mortgage interest
- −$14,060
- − Property taxes
- −$847
- − Insurance
- −$1,255
- − Repairs & maintenance
- −$1,925
- − Management
- −$1,925
- − Depreciation
- −$7,302
- Taxable loss
- −$3,253
- Est. tax savings @ 24.0%
- +$781
- After-tax cash flow
- $1,891/yr
For passive investors: Depreciation is non-cash, so a rental often shows a tax loss while cash-flowing — sheltering income. Rental losses are passive: they offset passive income freely, and up to $25,000/yr can offset ordinary (W-2) income if you actively participate and your MAGI is under $100k (phasing out to $0 by $150k); unused losses carry forward. On sale, claimed depreciation is recaptured at up to 25%, and gains may owe capital-gains tax (a 1031 exchange can defer both). Figures are a year-1 estimate at your 24.0% rate — not tax advice; consult a CPA.
Schools (NCES district)
- District
- Volusia
- NCES district ID
- 1201920
- Math proficiency
- 44% ▼ -9.00%
- Reading proficiency
- 49% ▼ -3.00%
- Median HH income
- $42,946
- Composite
- 39.2/100
- National rank
- #4019
- State rank
- #47 of 73 in FL
Livability — Edgewater
- Score
- 72/100
- State rank
- #329
- US rank
- #5753
Category grades
Schools grade is shown separately in the Schools card above.
Census & demographics
- Census place
- Edgewater, FL
- County
- Volusia County · 556,871 people
- City population
- 18,726
- Metro
- Deltona-Daytona Beach-Ormond Beach, FL
- Population (ZIP)
- 18,726
- Household income
- $63,936
- Rent vs Own
- Severe rent burden
- 161.0
Population outlook (Volusia County) Hauer SSP2
- Today (2025)
- 572,749 people
- By 2030
- 598,695 · +4.5%
- By 2040
- 644,880 · +12.6%
- By 2050
- 681,451 · +19.0%
- By 2075
- 759,957 · +32.7%
- By 2100
- 778,902 · +36.0%
Race, ethnicity, and origin ACS 2023
- Neighborhood character
- Predominantly White (90%)
- Race & ethnicity
- White 90% Hispanic / Latino 4% Two or more races 3% Black 2%
- Common ancestry
- Romanian 6% Lithuanian 2% Slovak 1%
- Foreign-born
- 4% · Canada
- Languages at home
- 94% English-only · Spanish 2% Other Indo-European 2% German/W. Germanic 1%
Political lean MEDSL · Volusia
- 2024 margin
- Strong R (+21.8) · D 38.7% · R 60.5%
- 2008→2024 swing
- -27.4pp toward R · 2008: 5.7pp · 2024: -21.8pp
- All cycles
- 2024: R+21.8 2020: R+14.1 2016: R+13.1 2012: R+1.2 2008: D+5.7
Not yet ingested
- Civics
- —
Market trends
- HPI YoY
- ▼ -80.12%
- Current HPI
- 337.8301
- Rent YoY
- —
- Metro
- Deltona-Daytona Beach-Ormond Beach, FL
- State GDP YoY
- ▲ 3.28%
- F500 in state
- 36
Industry mix (Fortune 500 HQ in FL)
| Industry | F500 HQs | Revenue |
|---|---|---|
| Industrial Technology | 2 | $29B |
|
||
| Insurance | 2 | $17B |
|
||
| Retail | 1 | $60B |
|
||
| Technology Distribution | 1 | $58B |
|
||
| Homebuilding | 1 | $35B |
|
||
| Technology Manufacturing | 1 | $35B |
|
||
Price history
+356.4% since first listed29 events — show timeline
- 2026-05-31 Listed $251,000 Daytona MLS
- 2024-03-06 Sold (Public Records) $239,000 Public Records
- 2024-02-29 Sold (MLS) $239,000 Stellar MLS as Distributed by MLS Grid
- 2024-02-29 Sold (MLS) $239,000 Stellar MLS as Distributed by MLS Grid
- 2024-02-29 Sold (MLS) $239,000 Daytona MLS
- 2024-02-23 Pending — Daytona MLS
- 2024-02-23 Pending — Stellar MLS as Distributed by MLS Grid
- 2024-02-23 Pending — Stellar MLS as Distributed by MLS Grid
- 2023-12-24 Relisted — Stellar MLS as Distributed by MLS Grid
- 2023-12-24 Price Changed $244,000 Stellar MLS as Distributed by MLS Grid
- 2023-12-11 Price Changed $244,000 Daytona MLS
- 2023-12-11 Relisted — Daytona MLS
- 2023-12-11 Relisted — Stellar MLS as Distributed by MLS Grid
- 2023-12-11 Price Changed $244,000 Stellar MLS as Distributed by MLS Grid
- 2023-12-08 Pending — Stellar MLS as Distributed by MLS Grid
- 2023-11-27 Pending — Daytona MLS
- 2023-11-27 Pending — Stellar MLS as Distributed by MLS Grid
- 2023-10-23 Price Changed $264,000 Daytona MLS
- 2023-10-23 Price Changed $264,000 Stellar MLS as Distributed by MLS Grid
- 2023-10-10 Listed $274,000 Stellar MLS as Distributed by MLS Grid
- 2023-09-12 Listed $264,000 Stellar MLS as Distributed by MLS Grid
- 2023-08-30 Listed $274,000 Daytona MLS
- 2011-04-18 Sold (Public Records) $80,000 Public Records
- 2011-04-14 Sold (MLS) $80,000 Stellar MLS as Distributed by MLS Grid
- 2011-04-14 Sold (MLS) $80,000 NSBMLS
- 2011-03-28 Listed $80,000 Stellar MLS as Distributed by MLS Grid
- 2011-03-28 Listed $80,000 NSBMLS
- 1991-12-01 Sold (Public Records) $49,000 Public Records
- 1983-07-01 Sold (Public Records) $55,000 Public Records
Property tax history
-6.6%/yrLatest (2025): $847 · -74.5% YoY. Source: county tax records.
Cash-flow waterfall
monthlySold comps — $/sqft
last 12 mo · ≤1 miLoading sold comps…