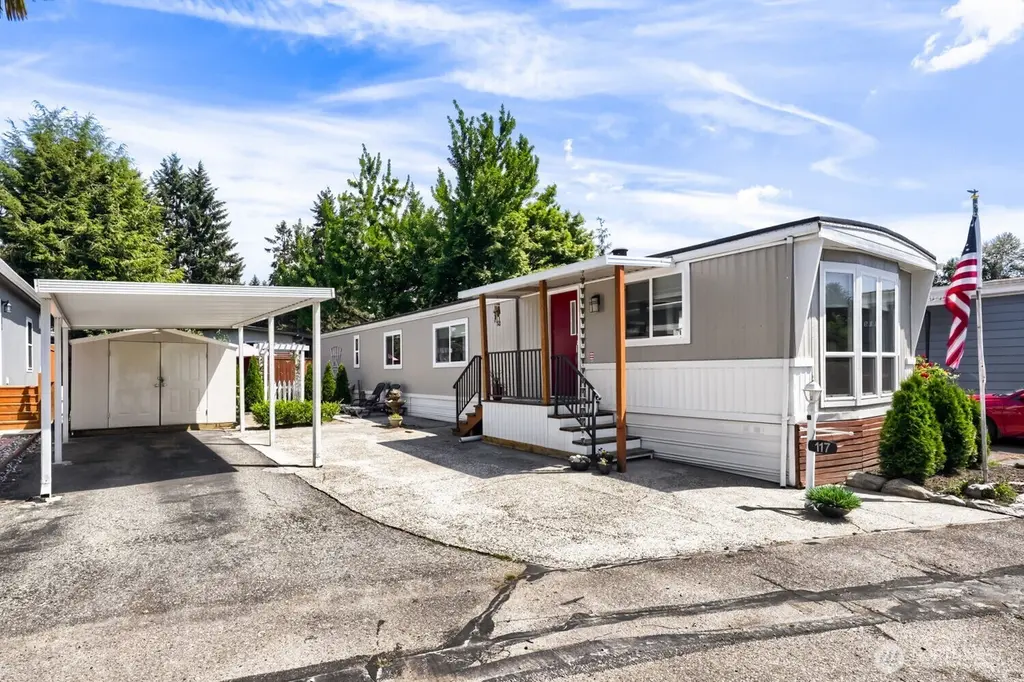
7301 NE 175th St #117 · Kenmore, WA
Flood risk 9/10 · Severe
- FEMA flood zone
- X (unshaded)
- Chance of flooding over 30 yrs
- 0.99%
- Est. flood insurance / yr
- $507 – $1,088
Fire risk 1/10 · Minimal
- Est. fire insurance / yr
- $604 – $1,122
Heat risk 3/10 · Minor
- Hot days now (above 86°F)
- 7 days/yr
- Hot days in 30 yrs
- 16 days/yr
Wind risk 1/10 · Minimal
- Chance of severe wind over 30 yrs
- —
Air-quality risk 6/10 · Moderate
- Unhealthy air days now
- 9 days/yr
- Unhealthy air days in 30 yrs
- 9 days/yr
Risk factors via First Street. Map © Google.
Why this score? — see what drove the A- grade
The composite is a weighted blend of 9 inputs, each scored 0–100. Each bar is that input's sub-score; the figure is the points it added to the 100-point composite (weight × sub-score).
- Cash flow +30.0/30.0
- ARV discount +15.0/15.0
- 1% rule +10.0/10.0
- DSCR +10.0/10.0
- Schools +6.7/10.0
- Livability +4.3/5.0
- Condition / age +4.0/5.0
- Rent growth +3.0/5.0
- Appreciation +0.0/10.0
$79,950
🖨 Deal sheet 📄 Offer letter ✓ Due diligence
Listing remarks
Charming and updated 2-bedroom, 1-bath home located on a rare double lot in a welcoming 55+ community in Kenmore. This cozy home features thoughtful updates throughout and comfortable living spaces. The beautifully maintained, garden-focused yard is designed for low-maintenance enjoyment with turf, landscaping, extra storage space, and a shed. Enjoy waterfront access just down the street — perfect for kayaking, or enjoying the peaceful surroundings. A unique opportunity to enjoy easy living in a quiet and convenient community.
Key facts
- Double lot
- Waterfront access
- Garden focused yard
Tags
Property features AI
Finance
- Other: Lot is paved and described as a double lot; Calculated building area 896; Energy efficient double-pane windows
- Financial info: Land lease: $1,400; Acceptable financing: Cash, Conventional; Buyer brokerage compensation: 3%
- HOA & community: Located in a senior community (Inglewood East); Park amenities include clubhouse, common area, community waterfront; Approximately 78 homes in the park; Community waterfront/private beach access; Bus route nearby (Route 522)
Exterior
- Parking: Carport; Uncovered parking; Storage in driveway
- Utilities: Electric energy source; Public water (billed through park); Electric water heater; Power by PSE
- Home design: Manufactured single-wide home; One story; Manufactured after 6/15/1976; Good condition; Model: Kozy K14X642RK; Make: Bendix; Mobile home remains; Skirted with metal
- Construction: Metal/vinyl construction; Flat roof; Pillar/post/pier foundation
- Exterior features: Metal/vinyl exterior; Patio/porch/deck; Drapes; Landscaped
Interior
- Kitchen: Dishwasher; Microwave; Refrigerator; Stove/Range
- Bedrooms: 2 bedrooms
- Flooring: Laminate
- Bathrooms: 1 full bathroom; One bathtub and one shower
- Heating & cooling: Ductless heating; Forced air heating; Cooling available
- Interior features: Fireplace (electric); Water heater
- Laundry & utility: Washer; Dryer; Water heater located in small bedroom closet
Neighborhood map
What this means for you Summary
Snapshot
- This is a 2-bed/1.0-bath manufactured listed at $80k. Condition is rated good.
Deal economics
- At list price, monthly cash flow is $1k ($13k/yr) — positive.
- The deal already cash-flows at list — no discount required.
- Meets the 1% rule at list price ($2k rent vs $80k).
- Cap rate 23.1% vs local median 1.6% in Kenmore — top-decile yield for the area; either an underpriced asset or a hidden risk that comps aren't pricing in. Stress-test before assuming the spread holds.
Location & tenants
- Location reads 86/100 on livability (#21 in WA, #427 nationally) — a professional / high-income tenant draw. Strengths: crime A+, amenities A+, commute A+; Watch: cost of living F.
- Northshore School District (suburban): math 69% / reading 78% proficiency, ranked #9 of 291 in WA (top 3%) — strong family-tenant draw, lease renewals of 3-5y typical; only 12% free/reduced lunch — higher-income household profile.
- Market conditions: Rents rising (+2.1%/yr); 190 active listings in the ZIP; 26 comparable units currently listed for rent nearby; rentals leasing fast (median 5d on market — plan ~1-2 weeks tenant-placement turnaround); high-income renter base; 10,555 units permitted in King County in 2024 (7,119 in 5+ unit buildings).
Forward outlook
- Local home prices are declining (-3.0%/yr); year-one equity from $552 of loan paydown is wiped out by about $2k of value loss. Plan a longer hold.
- King County population projected at +44% by 2050 — long-run rental-demand tailwind backs the buy-and-hold thesis.
- At projected returns (-3.0% appreciation + 2.1% rent growth), your $22k cash investment doubles in ~3 years — after that, you're playing with house money.
Negotiation context
- Only 9 days on market — expect competitive offers; lowballing is unlikely to land.
- 2 sale attempts since 3y ago with the ask held roughly flat each time — persistent listings suggest the price (not the market) is what's stuck; bring a comps-based counter.
- Current owner paid $62k; 28% above their basis — modest negotiation headroom, anchor on the comps not their cost.
Risks & watch-outs
- Watch-outs: flood insurance adds $66/mo.
- Climate carrying-cost: severe flood risk — expect insurance premiums to compound above CPI over the hold.
Questions for the listing agent
- What's the actual annual flood-insurance premium (NFIP or private), and is the property in a SFHA with mandatory coverage?
- Is there a deadline driving the sale (1031 exchange, divorce, estate, relocation)? That informs how much negotiation room exists.
- Schools are A-rated — typically a magnet for longer-tenancy family renters. What's the average tenant stay here, and is there a school-zone premium baked into asking?
- What's the average days-on-market for RENTAL listings here right now (not sales)? A rising rental-DOM trend means longer vacancies and softer asking-rent achievability than the comps imply.
- What's the recent tenant-quality profile in this submarket — average credit score on applications, eviction rate, late-payment / NSF rate, and stable-employment percentage? A property-management company in the area should have these aggregated.
- How much new for-sale + rental construction is in the pipeline within 1–3 miles? Heavy new supply typically softens prices + rents 12–24 months out; constrained supply supports both.
Investment metrics
- 1% rule
- 2.65% ✓
- Cap rate
- 23.13%
- Cash-on-cash
- 60.15%
- DSCR
- 3.68
- GRM
- 3.1
CMA / ARV
- ARV (on-the-fly)
- $128,128
- Comps found
- 2
Show comp detail 2 sales within ~0.75 mi
| Address | Dist | Beds/Ba | Sqft | Sold | Price | $/sf | Match |
|---|---|---|---|---|---|---|---|
| 7031 NE 175th St #33 | 0.20mi | 2/1.0 | 860 (-4%) | 7mo | $78,000 | $91 | 78 |
| 7614 NE Bothell Way #14 | 0.26mi | 2/1.5 | 980 (+9%) | 17mo | $140,000 | $143 | 56 |
Match score weights: distance 35% · size 25% · config 20% · recency 20%. Top-matched comps best support the ARV.
Projected returns pro-forma
-3.0% appreciation · 2.09% rent growth · sell at horizon
- IRR
- 54.0%
- Equity multiple
- 3.34×
- Total profit
- $52,428
- Equity at exit
- $11,921
- IRR
- 58.7%
- Equity multiple
- 6.57×
- Total profit
- $124,775
- Equity at exit
- $6,913
Cash invested: $22,386 (down + closing). Projections, not guarantees.
Landlord ↔ Tenant lean methodology
- Overall (STATE)
- 28 Tenant-Leaning
- State Washington
- 28 Tenant-Leaning · D+8
- County
- — inherits STATE
- City
- — inherits STATE
ZIP-level market 98028
- Rents YoY
- 2.1%
- Active inventory
- 190
- Price-to-rent
- 3.1×
Monthly cashflow live
- Estimated rent
- $2,120 high interval (Pro) →
- Mortgage (P&I)
- −$419
- Tax est. 1.5%
- −$100 /mo · $1,199/yr
- Insurance
- −$33
- Flood insurance flood zone
- −$66 /mo · $798/yr
- HOA
- −$0
- Vacancy / Maint / Mgmt
- −$445
- Net cashflow
- $1,056
Break-even live
UW: 25.0% down · 7.5% · 30yr · 1.5% tax · 5.0% vac · 8.0% maint · 8.0% mgmt
Financing live
Cash to close
- Down payment
- $19,988
- Closing costs
- $2,398
- Reserves months
- —
- Total cash needed
- —
Loan-product check · same deal, 3 products live
Conventional
25% down · 7.5% · 30yr
- Down + closing
- —
- Monthly P&I
- —
- Monthly cashflow
- —
- DSCR
- —
- Eligible?
- —
Personal DTI + credit; lowest rate.
DSCR
20% down · 8.5% · 30yr
- Down + closing
- —
- Monthly P&I
- —
- Monthly cashflow
- —
- DSCR
- —
- Eligible?
- —
No personal income docs; deal must DSCR.
Hard money
10% down · 12.0% · 12mo
- Down + closing
- —
- Monthly P&I
- —
- Monthly cashflow
- —
- DSCR
- —
- Eligible?
- —
Short-term bridge; refi at stabilization.
Rent comps 26 comps
| Address | Beds | Baths | Sqft | Rent | $/sqft | DOM | Units | Dist |
|---|---|---|---|---|---|---|---|---|
| 7345 NE 175th St Kenmore, WA | 1.0 | 1.0 | 760 | $1,850 | $2.43 | 24d | 1 | 0.05mi |
| 7711 NE 175th St Kenmore, WA | 1.0 | 1.0 | 709 | $1,874 | $2.64 | 2d | 1 | 0.17mi |
| 17525 80th Ave NE Kenmore, WA | 1.0–2.0 | 1.0–2.0 | 900 | $1,999 | $2.22 | 5d | 4 | 0.37mi |
| 7208 NE 182nd St Unit 7206 Kenmore, WA | 1.0 | 1.0 | 888 | $2,000 | $2.25 | 2d | 1 | 0.44mi |
| 18235 73rd Ave NE Kenmore, WA | 1.0–2.0 | 1.0 | 787 | $1,850 | $2.35 | 5d | 4 | 0.46mi |
| 18249 73rd Ave NE Kenmore, WA | 1.0–2.0 | 1.0–2.0 | 827 | $2,400 | $2.90 | 10d | 7 | 0.49mi |
| 18151 68th Ave NE Kenmore, WA | 1.0 | 1.0 | 720 | $2,196 | $3.05 | 5d | 4 | 0.54mi |
| 17527 83rd Pl NE Kenmore, WA | 2.0 | 2.0 | 900 | $1,990 | $2.21 | 5d | 1 | 0.56mi |
| 6711 NE 182nd St Kenmore, WA | 1.0–2.0 | 1.0–2.0 | 899 | $2,644 | $2.94 | 3d | 10 | 0.59mi |
| 17512 83rd Pl NE Kenmore, WA | 1.0–2.0 | 1.0–2.0 | 850 | $2,250 | $2.65 | 2d | 4 | 0.62mi |
| 6410 NE 181st St Kenmore, WA | 2.0 | 1.0 | 910 | $2,500 | $2.75 | 43d | 1 | 0.73mi |
| 18930 68th Ave NE Kenmore, WA | 1.0–2.0 | 1.0–2.0 | 799 | $2,497 | $3.13 | 2d | 6 | 0.81mi |
| 8700 NE Bothell Way Bothell, WA | 1.0–3.0 | 1.0–2.0 | 1038 | $2,098 | $2.02 | 1d | 8 | 0.82mi |
| 15914 84th Ave NE Unit C Kenmore, WA | 2.0 | 1.0 | 850 | $1,975 | $2.32 | 43d | 1 | 1.00mi |
| 17725 Hall Rd Bothell, WA | 1.0–2.0 | 1.0 | 772 | $1,950 | $2.52 | 3d | 1 | 1.30mi |
| 9505 NE 180th St Unit 102 Bothell, WA | 2.0 | 2.0 | 1070 | $2,595 | $2.43 | 11d | 1 | 1.34mi |
| 9517 NE 180th St Unit B106 Bothell, WA | 1.0 | 1.0 | 730 | $2,200 | $3.01 | 20d | 1 | 1.36mi |
| 9517 NE 180th St Unit B207 Bothell, WA | 2.0 | 1.0 | 840 | $1,850 | $2.20 | 2d | 1 | 1.36mi |
| 9517 NE 180th St Bothell, WA | 1.0 | 1.0 | 730 | $1,900 | $2.60 | 24d | 2 | 1.36mi |
| 9525 NE 180th St Unit 306 Bothell, WA | 1.0 | 1.0 | 740 | $1,900 | $2.57 | 2d | 1 | 1.38mi |
| 9525 NE 180th St Unit 303 Bothell, WA | 2.0 | 2.0 | 1080 | $2,375 | $2.20 | 5d | 1 | 1.38mi |
| 18125 96th Ave NE Unit 4 Bothell, WA | 2.0 | 1.0 | 900 | $1,725 | $1.92 | 24d | 1 | 1.40mi |
| 18125 96th Ave NE Unit 7 Bothell, WA | 2.0 | 1.0 | 900 | $1,895 | $2.11 | 5d | 1 | 1.40mi |
| 18125 96th Ave NE Apt 6 Bothell, WA | 2.0 | 1.0 | 900 | $1,895 | $2.11 | 43d | 1 | 1.40mi |
| 18209 96th Ave NE Bothell, WA | 1.0 | 1.0 | 600 | $1,850 | $3.08 | 43d | 1 | 1.41mi |
| 18305 96th Ave NE Bothell, WA | 2.0 | 1.0 | 670 | $2,300 | $3.43 | 14d | 2 | 1.42mi |
Listing history 7 events
-
2026-05-31status $79,950 Pending 9 DOM
-
2026-05-21$79,950 Active
-
2023-06-20soldstatus $62,500 Closed
-
2023-06-07status Pending
-
2023-04-30price $65,000
-
2023-03-30price $70,000
-
2023-01-23$78,000 Active
ⓘ Source: listings_history table (triggers on properties + properties_extension) + one-shot
backfill from property_details.listing_events for pre-trigger history.
Climate risk First Street
- Flood 9/10 Extreme FEMA zone X (unshaded) · 99% chance over 30 yrs
- Wildfire 1/10 Low
- Heat 3/10 Moderate 7 d/yr ≥86°F today · 16 d/yr by 30 yrs out
- Wind 1/10 Low
- Air quality 6/10 Major 9 unhealthy d/yr today · 9 by 30 yrs out
Nearby sold comps map
Loading sold comps map…
Walkable amenities ~0.75 mi
Loading nearby amenities…
Taxation est. · year 1
- Rental income
- $25,437
- − Mortgage interest
- −$4,478
- − Property taxes
- −$1,199
- − Insurance
- −$1,197
- − Repairs & maintenance
- −$2,035
- − Management
- −$2,035
- − Depreciation
- −$2,326
- Taxable income
- $12,167
- Est. tax owed @ 24.0%
- −$2,920
- After-tax cash flow
- $9,748/yr
For passive investors: Depreciation is non-cash, so a rental often shows a tax loss while cash-flowing — sheltering income. Rental losses are passive: they offset passive income freely, and up to $25,000/yr can offset ordinary (W-2) income if you actively participate and your MAGI is under $100k (phasing out to $0 by $150k); unused losses carry forward. On sale, claimed depreciation is recaptured at up to 25%, and gains may owe capital-gains tax (a 1031 exchange can defer both). Figures are a year-1 estimate at your 24.0% rate — not tax advice; consult a CPA.
Condition & rehab AI · 12 photos
This charming and updated 2-bedroom, 1-bath home in a 55+ community is move-in ready with thoughtful updates and a low-maintenance garden. It offers a unique opportunity for easy living in a quiet and convenient location.
Value-add opportunities
- Resale Paint exterior siding — Enhances curb appeal and value
- Rental Replace outdoor light fixtures — Improves curb appeal and safety
Renovation cost estimate screening
Value-add ROI direction
- Resale Paint exterior siding — Enhances curb appeal and value ↑
- Rental Replace outdoor light fixtures — Improves curb appeal and safety ↑
ⓘ Cost ranges are severity-bucket heuristics (US national rule-of-thumb). Get contractor quotes + a written scope before underwriting a rehab budget.
Schools (NCES district)
- District
- Northshore School District
- NCES district ID
- 5305910
- Math proficiency
- 69% ▼ -3.00%
- Reading proficiency
- 78% ▼ -1.00%
- Median HH income
- $92,951
- Composite
- 67.41/100
- National rank
- #826
- State rank
- #9 of 291 in WA
Livability — Kenmore
- Score
- 86/100
- State rank
- #21
- US rank
- #427
Category grades
Schools grade is shown separately in the Schools card above.
Census & demographics
- Census place
- Kenmore, WA
- County
- King County · 2,251,916 people
- City population
- 23,741
- Metro
- Seattle-Tacoma-Bellevue, WA
- Population (ZIP)
- 23,741
- Household income
- $139,764
- Rent vs Own
- Severe rent burden
- 557.0
Population outlook (King County) Hauer SSP2
- Today (2025)
- 2,576,485 people
- By 2030
- 2,803,316 · +8.8%
- By 2040
- 3,255,921 · +26.4%
- By 2050
- 3,706,444 · +43.9%
- By 2075
- 4,746,063 · +84.2%
- By 2100
- 5,407,730 · +109.9%
Race, ethnicity, and origin ACS 2023
- Neighborhood character
- Diverse neighborhood (Simpson 0.55)
- Race & ethnicity
- White 64% Asian 15% Hispanic / Latino 11% Two or more races 10% Black 3%
- Hispanic origin (detail)
- Mexican 8%
- Common ancestry
- Portuguese 5% Italian 4% Slovak 2%
- Foreign-born
- 22% · Canada, China, South Korea
- Languages at home
- 73% English-only · Spanish 7% Chinese 5% Other Indo-European 3%
Political lean MEDSL · King
- 2024 margin
- Solid D (+51.7) · D 74.2% · R 22.5% · Other 3.4%
- 2008→2024 swing
- +9.6pp toward D · 2008: 42.1pp · 2024: 51.7pp
- All cycles
- 2024: D+51.7 2020: D+52.7 2016: D+50.4 2012: D+39.9 2008: D+42.1
Not yet ingested
- Civics
- —
Market trends
- HPI YoY
- ▼ -907.61%
- Current HPI
- 392.3867
- Rent YoY
- ▲ 2.09%
- Metro
- Seattle-Tacoma-Bellevue, WA
- State GDP YoY
- ▲ 4.65%
- F500 in state
- 22
Industry mix (Fortune 500 HQ in WA)
| Industry | F500 HQs | Revenue |
|---|---|---|
| Retail | 2 | $269B |
|
||
| Technology / Retail | 1 | $638B |
|
||
| Technology | 1 | $245B |
|
||
| Telecommunications | 1 | $38B |
|
||
| Food / Beverage | 1 | $36B |
|
||
| Automotive / Trucks | 1 | $34B |
|
||
Price history
+2.5% since first listed6 events — show timeline
- 2026-05-21 Listed $79,950 NWMLS as Distributed by MLS Grid
- 2023-06-20 Sold (MLS) $62,500 NWMLS as Distributed by MLS Grid
- 2023-06-07 Pending — NWMLS as Distributed by MLS Grid
- 2023-04-30 Price Changed $65,000 NWMLS as Distributed by MLS Grid
- 2023-03-30 Price Changed $70,000 NWMLS as Distributed by MLS Grid
- 2023-01-23 Listed $78,000 NWMLS as Distributed by MLS Grid
Cash-flow waterfall
monthlySold comps — $/sqft
last 12 mo · ≤1 miLoading sold comps…