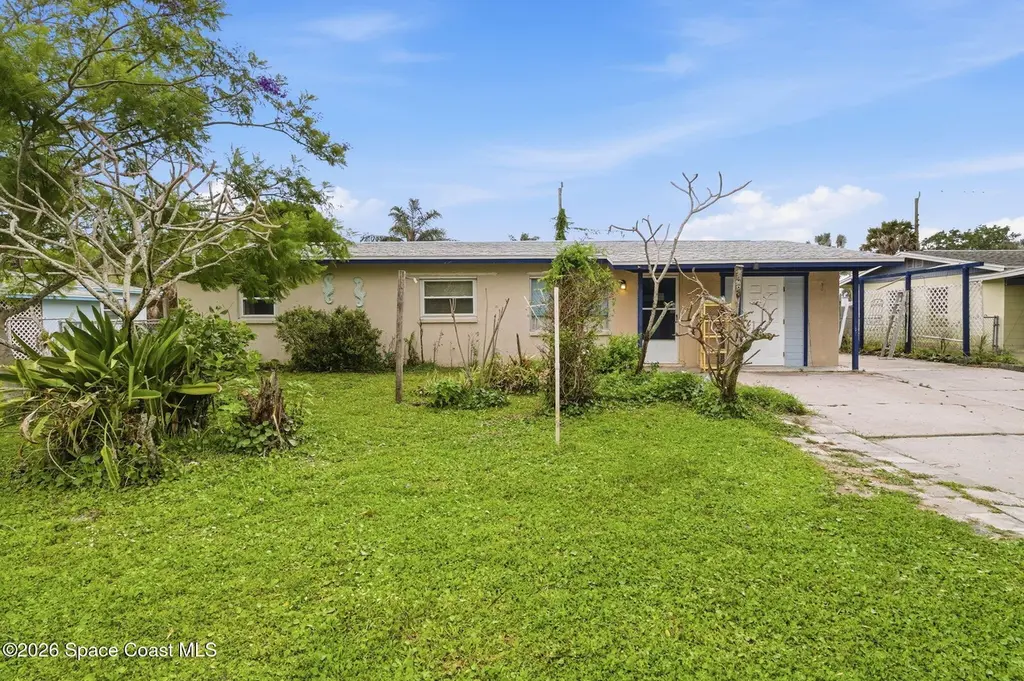
1857 Glenwood Dr · Melbourne, FL
Flood risk 1/10 · Minimal
- FEMA flood zone
- X (unshaded)
- Chance of flooding over 30 yrs
- 0.0%
- Est. flood insurance / yr
- $507 – $1,088
Fire risk 1/10 · Minimal
- Est. fire insurance / yr
- $947 – $1,759
Heat risk 10/10 · Severe
- Hot days now (above 105°F)
- 7 days/yr
- Hot days in 30 yrs
- 24 days/yr
Wind risk 10/10 · Severe
- Chance of severe wind over 30 yrs
- 99.0%
Air-quality risk 1/10 · Minimal
- Unhealthy air days now
- 0 days/yr
- Unhealthy air days in 30 yrs
- 0 days/yr
Risk factors via First Street. Map © Google.
Why this score? — see what drove the D+ grade
The composite is a weighted blend of 9 inputs, each scored 0–100. Each bar is that input's sub-score; the figure is the points it added to the 100-point composite (weight × sub-score).
- Cash flow +18.1/30.0
- ARV discount +7.5/15.0
- DSCR +5.7/10.0
- 1% rule +4.8/10.0
- Schools +4.7/10.0
- Rent growth +2.6/5.0
- Livability +2.5/5.0
- Condition / age +2.5/5.0
- Appreciation +0.0/10.0
$168,000
🖨 Deal sheet 📄 Offer letter ✓ Due diligence
Listing remarks
Located in Melbourne, Brevard County, this 3-bedroom, 2-bath concrete block home with a practical layout and recent updates. Major mechanical components have been updated within the past five years. The home sits on a 0.16-acre lot and includes a wood deck and detached shed. Conveniently located near shopping, dining, schools, and everyday amenities. Short drive to Melbourne Beach and Indialantic, with easy access to Melbourne Orlando International Airport and major roadways.
Key facts
- Recent updates
- Wood deck
- Short drive to beach
Tags
Property features AI
Finance
- Other: Lot approximately 0.16 acres; Additional parcel reference provided
Exterior
- Parking: Off-street parking
- Utilities: Public sewer; Electricity available; Sewer available; Water available
- Home design: Single family residence; Living area approximately 1,436 (area provided); Property used for residential single-family
- Construction: Block and stucco construction
- Exterior features: Other exterior features; No private pool; West-facing
Interior
- Kitchen: Kitchen on the main level
- Bedrooms: Three bedrooms on the main level
- Flooring: Tile
- Bathrooms: Two full bathrooms
- Heating & cooling: Central heating (electric); Central air conditioning with multiple units
- Interior features: Seven total rooms; Tile flooring
- Laundry & utility: Unfurnished unit (no built-in laundry details provided)
Neighborhood map
What this means for you Summary
Snapshot
- This is a 3-bed/1.0-bath single-family listed at $168k.
Deal economics
- At list price, monthly cash flow is $146 ($2k/yr) — positive.
- The deal already cash-flows at list — no discount required.
- To meet the 1% rule (rent ≥ 1% of price), the offer needs to be $165k (1.5% below list).
- Recommended offer: $165k (1.5% below list) — sets the bar for 1% rule.
Location & tenants
- Location reads: area grade D — affects rentability + tenant quality, not the cash-flow math above.
- Brevard (suburban): math 53% / reading 57% proficiency, ranked #19 of 73 in FL (top 26%) — acceptable for families but not a draw, mixed tenant base, ~2y average lease.
- Zoned schools: Lyndon B. Johnson Middle School (math 40% / reading 42%, grade F, #353 of 571 statewide, top 63%, 610 students, 61% FRL) — zoned schools average 61% FRL vs 43% district-wide (18 pts higher); higher-poverty schools than district average — tighter screening recommended.
- Zoned-school proficiency averages 41% at this address vs 55% district-wide (-14 pts) — the specific schools serving this property underperform the Brevard average; the district grade overstates school quality for this exact location.
- Market conditions: Rents flat; 332 active listings in the ZIP; 33 comparable units currently listed for rent nearby; rentals at typical pace (median 23d on market — plan ~3-4 weeks tenant-placement turnaround); 4,602 units permitted in Brevard County in 2024 (702 in 5+ unit buildings).
- This rent runs 31% of the median local income ($65k/yr) — at the standard rent-burdened threshold; future hikes will face affordability resistance.
Forward outlook
- Local home prices are declining (-3.0%/yr); year-one equity from $1k of loan paydown is wiped out by about $5k of value loss. Plan a longer hold.
- Brevard County population projected at +15% by 2050 — modest demand growth; plan on rents tracking national, not racing it.
Negotiation context
- Only 11 days on market — expect competitive offers; lowballing is unlikely to land.
- Current owner paid $52k; list at $168k implies a 220% gain — meaningful room to come down on a strong offer.
Risks & watch-outs
- Climate carrying-cost: severe wind risk, 99% chance of damaging wind over 30y; extreme-heat days projected 7→24/yr by 2055 (HVAC capex compounding) — expect insurance premiums to compound above CPI over the hold.
Questions for the listing agent
- Built in 1963 — when were the roof, HVAC, electrical panel, plumbing, and water heater last replaced?
- Is there a deadline driving the sale (1031 exchange, divorce, estate, relocation)? That informs how much negotiation room exists.
- The area grade is low — what's the realistic commute time and amenity access for the typical tenant pool here? Any planned neighborhood developments (good or bad) we should know about?
- What's the average days-on-market for RENTAL listings here right now (not sales)? A rising rental-DOM trend means longer vacancies and softer asking-rent achievability than the comps imply.
- What's the recent tenant-quality profile in this submarket — average credit score on applications, eviction rate, late-payment / NSF rate, and stable-employment percentage? A property-management company in the area should have these aggregated.
- How much new for-sale + rental construction is in the pipeline within 1–3 miles? Heavy new supply typically softens prices + rents 12–24 months out; constrained supply supports both.
Investment metrics
- 1% rule
- 0.98% ✗
- Cap rate
- 7.34%
- Cash-on-cash
- 3.73%
- DSCR
- 1.17
- GRM
- 8.5
CMA / ARV
No comps found within radius.
Projected returns pro-forma
-3.0% appreciation · 0.53% rent growth · sell at horizon
- IRR
- -13.3%
- Equity multiple
- 0.53×
- Total profit
- $-21,898
- Equity at exit
- $25,049
- IRR
- -8.7%
- Equity multiple
- 0.52×
- Total profit
- $-22,647
- Equity at exit
- $14,526
Cash invested: $47,040 (down + closing). Projections, not guarantees.
Landlord ↔ Tenant lean methodology
- Overall (STATE)
- 87 Strongly Landlord-Friendly
- State Florida
- 87 Strongly Landlord-Friendly · R+3
- County
- — inherits STATE
- City
- — inherits STATE
ZIP-level market 32935
- Rents YoY
- 0.5%
- Active inventory
- 332
- Price-to-rent
- 8.5×
Monthly cashflow live
- Estimated rent
- $1,655 high interval (Pro) →
- Mortgage (P&I)
- −$881
- Tax est. 1.5%
- −$210 /mo · $2,520/yr
- Insurance
- −$70
- HOA
- −$0
- Vacancy / Maint / Mgmt
- −$347
- Net cashflow
- $146
Break-even live
UW: 25.0% down · 7.5% · 30yr · 1.5% tax · 5.0% vac · 8.0% maint · 8.0% mgmt
Financing live
Cash to close
- Down payment
- $42,000
- Closing costs
- $5,040
- Reserves months
- —
- Total cash needed
- —
Loan-product check · same deal, 3 products live
Conventional
25% down · 7.5% · 30yr
- Down + closing
- —
- Monthly P&I
- —
- Monthly cashflow
- —
- DSCR
- —
- Eligible?
- —
Personal DTI + credit; lowest rate.
DSCR
20% down · 8.5% · 30yr
- Down + closing
- —
- Monthly P&I
- —
- Monthly cashflow
- —
- DSCR
- —
- Eligible?
- —
No personal income docs; deal must DSCR.
Hard money
10% down · 12.0% · 12mo
- Down + closing
- —
- Monthly P&I
- —
- Monthly cashflow
- —
- DSCR
- —
- Eligible?
- —
Short-term bridge; refi at stabilization.
Rent comps 33 comps
| Address | Beds | Baths | Sqft | Rent | $/sqft | DOM | Units | Dist |
|---|---|---|---|---|---|---|---|---|
| 196 San Juan Cir Melbourne, FL | 2.0 | 1.0 | 955 | $1,400 | $1.47 | 23d | 1 | 0.15mi |
| 1252 Ridgewood Dr Melbourne, FL | 3.0 | 2.0 | 1114 | $1,785 | $1.60 | 18d | 1 | 0.17mi |
| 109 San Juan Cir Melbourne, FL | 2.0 | 1.0 | 955 | $1,400 | $1.47 | 21d | 1 | 0.20mi |
| 1812 Guava Ave Melbourne, FL | 2.0 | 1.0 | 850 | $1,375 | $1.62 | 23d | 1 | 0.68mi |
| 1727 Avocado Ave Unit 6 Melbourne, FL | 2.0 | 1.0 | 900 | $1,425 | $1.58 | 23d | 1 | 0.71mi |
| 1727 Avocado Ave #8 Melbourne, FL | 2.0 | 1.0 | 900 | $1,475 | $1.64 | 23d | 1 | 0.71mi |
| 1805 Guava Ave Melbourne, FL | 2.0 | 1.0 | 896 | $1,600 | $1.79 | 14d | 1 | 0.72mi |
| 1728 Guava Ave Unit 7 Melbourne, FL | 2.0 | 1.0 | 820 | $1,400 | $1.71 | 23d | 1 | 0.73mi |
| 1821 Highland Ave Melbourne, FL | 2.0 | 1.0 | 900 | $1,650 | $1.83 | 23d | 1 | 0.78mi |
| 1811 Highland Ave Melbourne, FL | 2.0 | 1.0 | 900 | $1,650 | $1.83 | 23d | 1 | 0.78mi |
| 2082 Foxwood Dr Melbourne, FL | 2.0 | 2.0 | 975 | $1,600 | $1.64 | 14d | 1 | 0.79mi |
| 1809 Highland Ave Melbourne, FL | 2.0 | 1.0 | 900 | $1,650 | $1.83 | 23d | 1 | 0.79mi |
| 1868 Pineapple Ave Melbourne, FL | 2.0 | 1.0 | 1000 | $1,750 | $1.75 | 23d | 1 | 0.79mi |
| 1420 Avocado Ave #16 Melbourne, FL | 2.0 | 1.0 | 750 | $1,500 | $2.00 | 23d | 1 | 0.96mi |
| 1464 Guava Ave Melbourne, FL | 2.0 | 1.0 | 948 | $1,775 | $1.87 | 23d | 1 | 0.97mi |
| 2242 Flower Tree Cir Melbourne, FL | 2.0 | 2.0 | 879 | $1,300 | $1.48 | 23d | 1 | 1.01mi |
| 1688 Eisenhower Ave Melbourne, FL | 3.0 | 1.5 | 988 | $1,700 | $1.72 | 23d | 1 | 1.03mi |
| 2414 Summerset Dr Melbourne, FL | 2.0 | 2.0 | 1065 | $1,450 | $1.36 | 23d | 1 | 1.06mi |
| 188 Berkshire Ln Melbourne, FL | 3.0 | 2.0 | 1094 | $1,750 | $1.60 | 18d | 1 | 1.17mi |
| 177 Ulster Ln Melbourne, FL | 2.0 | 2.0 | 890 | $1,300 | $1.46 | 23d | 1 | 1.20mi |
| 181 Ulster Ln Melbourne, FL | 2.0 | 2.0 | 890 | $1,400 | $1.57 | 23d | 1 | 1.20mi |
| 254 Ulster Ln Melbourne, FL | 3.0 | 2.0 | 1094 | $1,600 | $1.46 | 13d | 1 | 1.25mi |
| 280 Ulster Ln Melbourne, FL | 3.0 | 2.0 | 1094 | $1,600 | $1.46 | 23d | 1 | 1.26mi |
| 217 Bristol Ln Melbourne, FL | 2.0 | 2.0 | 890 | $1,395 | $1.57 | 23d | 1 | 1.27mi |
| 189 Cambridge Ln Melbourne, FL | 3.0 | 2.0 | 1094 | $1,600 | $1.46 | 23d | 1 | 1.29mi |
| 2420 Central Park Dr Melbourne, FL | 1.0–3.0 | 1.0–2.0 | 1045 | $2,099 | $2.01 | 13d | 11 | 1.33mi |
| 2700 Croton Rd Melbourne, FL | 1.0–2.0 | 1.0–2.0 | 870 | $1,675 | $1.93 | 14d | 1 | 1.34mi |
| 2504 Bogey Ln Apt C Melbourne, FL | 2.0 | 2.0 | 1002 | $1,500 | $1.50 | 23d | 1 | 1.39mi |
| 1440 Parkway Dr Unit 7A Melbourne, FL | 2.0 | 1.0 | 800 | $1,495 | $1.87 | 23d | 1 | 1.44mi |
| 1432 Parkway Dr Unit 6b Melbourne, FL | 2.0 | 1.0 | 800 | $1,495 | $1.87 | 23d | 1 | 1.44mi |
| 1965 Barkley Ave Melbourne, FL | 3.0 | 1.0 | 1000 | $1,600 | $1.60 | 23d | 1 | 1.45mi |
| 3150 N Harbor City Blvd #143 Melbourne, FL | 2.0 | 2.0 | 1058 | $1,700 | $1.61 | 23d | 1 | 1.46mi |
| 2201 Hampton Greens Blvd Melbourne, FL | 1.0–3.0 | 1.0–2.0 | 900 | $2,001 | $2.22 | 13d | 10 | 1.48mi |
Listing history 3 events
-
2026-05-31status $168,000 Pending 11 DOM
-
2026-05-18$168,000 Active
-
2000-06-27soldstatus $52,500
ⓘ Source: listings_history table (triggers on properties + properties_extension) + one-shot
backfill from property_details.listing_events for pre-trigger history.
Climate risk First Street
- Flood 1/10 Low FEMA zone X (unshaded) · 0% chance over 30 yrs
- Wildfire 1/10 Low
- Heat 10/10 Extreme 7 d/yr ≥105°F today · 24 d/yr by 30 yrs out
- Wind 10/10 Extreme 99% chance of damaging wind over 30 yrs
- Air quality 1/10 Low 0 unhealthy d/yr today · 0 by 30 yrs out
Nearby sold comps map
Loading sold comps map…
Walkable amenities ~0.75 mi
Loading nearby amenities…
Taxation est. · year 1
- Rental income
- $19,857
- − Mortgage interest
- −$9,411
- − Property taxes
- −$2,520
- − Insurance
- −$840
- − Repairs & maintenance
- −$1,589
- − Management
- −$1,589
- − Depreciation
- −$4,887
- Taxable loss
- −$978
- Est. tax savings @ 24.0%
- +$235
- After-tax cash flow
- $1,990/yr
For passive investors: Depreciation is non-cash, so a rental often shows a tax loss while cash-flowing — sheltering income. Rental losses are passive: they offset passive income freely, and up to $25,000/yr can offset ordinary (W-2) income if you actively participate and your MAGI is under $100k (phasing out to $0 by $150k); unused losses carry forward. On sale, claimed depreciation is recaptured at up to 25%, and gains may owe capital-gains tax (a 1031 exchange can defer both). Figures are a year-1 estimate at your 24.0% rate — not tax advice; consult a CPA.
Schools (NCES district)
- District
- Brevard
- NCES district ID
- 1200150
- Math proficiency
- 53% ▼ -9.00%
- Reading proficiency
- 57% ▼ -4.00%
- Median HH income
- $49,426
- Composite
- 46.86/100
- National rank
- #2370
- State rank
- #19 of 73 in FL
Livability — Melbourne
No livability data for this city. (Only ~50 U.S. cities are tracked.)
Census & demographics
- Census place
- Melbourne, FL
- County
- Brevard County · 602,871 people
- City population
- 178,420
- Metro
- Palm Bay-Melbourne-Titusville, FL
- Population (ZIP)
- 41,965
- Household income
- $64,588
- Rent vs Own
- Severe rent burden
- 1747.0
Population outlook (Brevard County) Hauer SSP2
- Today (2025)
- 623,254 people
- By 2030
- 648,420 · +4.0%
- By 2040
- 690,009 · +10.7%
- By 2050
- 715,669 · +14.8%
- By 2075
- 775,744 · +24.5%
- By 2100
- 776,687 · +24.6%
Race, ethnicity, and origin ACS 2023
- Neighborhood character
- Predominantly White (74%)
- Race & ethnicity
- White 74% Hispanic / Latino 13% Two or more races 9% Black 5% Asian 2%
- Hispanic origin (detail)
- Mexican 3% Puerto Rican 5%
- Common ancestry
- Slovak 2% Romanian 2% Lithuanian 2%
- Foreign-born
- 9% · Canada, Vietnam, Jamaica
- Languages at home
- 88% English-only · Spanish 8% Other Indo-European 1% Tagalog/Filipino 1%
Political lean MEDSL · Brevard
- 2024 margin
- Strong R (+20.8) · D 39.1% · R 59.9% · Other 1.0%
- 2008→2024 swing
- -10.4pp toward R · 2008: -10.4pp · 2024: -20.8pp
- All cycles
- 2024: R+20.8 2020: R+16.4 2016: R+19.8 2012: R+12.7 2008: R+10.4
Not yet ingested
- Civics
- —
Market trends
- HPI YoY
- ▼ -185.48%
- Current HPI
- 308.7443
- Rent YoY
- ▲ 0.53%
- Metro
- Palm Bay-Melbourne-Titusville, FL
- State GDP YoY
- ▲ 3.28%
- F500 in state
- 36
Industry mix (Fortune 500 HQ in FL)
| Industry | F500 HQs | Revenue |
|---|---|---|
| Industrial Technology | 2 | $29B |
|
||
| Insurance | 2 | $17B |
|
||
| Retail | 1 | $60B |
|
||
| Technology Distribution | 1 | $58B |
|
||
| Homebuilding | 1 | $35B |
|
||
| Technology Manufacturing | 1 | $35B |
|
||
Price history
+220.0% since first listed2 events — show timeline
- 2026-05-18 Listed $168,000 SCMLS
- 2000-06-27 Sold (Public Records) $52,500 Public Records
Property tax history
+0.5%/yrLatest (2025): $261 · +5.2% YoY. Source: county tax records.
Cash-flow waterfall
monthlySold comps — $/sqft
last 12 mo · ≤1 miLoading sold comps…