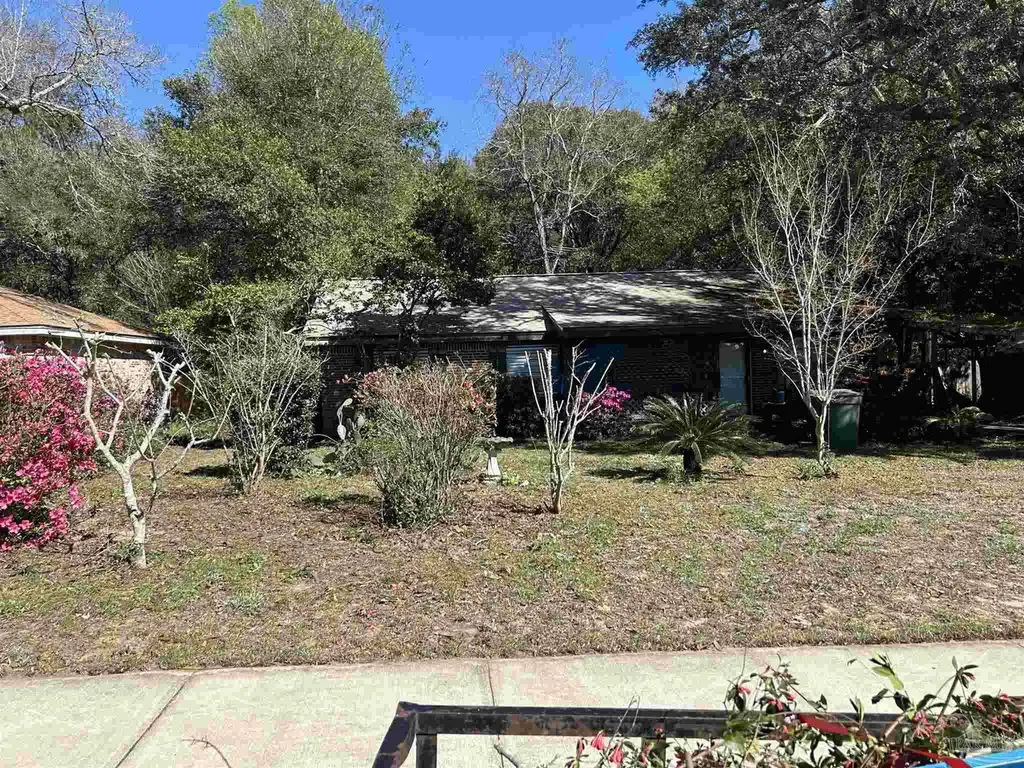
5800 Avondale Rd · Bellview, FL
Flood risk 1/10 · Minimal
- FEMA flood zone
- X (unshaded)
- Chance of flooding over 30 yrs
- 0.0%
- Est. flood insurance / yr
- $507 – $1,088
Fire risk 3/10 · Minor
- Est. fire insurance / yr
- $947 – $1,759
Heat risk 10/10 · Severe
- Hot days now (above 105°F)
- 6 days/yr
- Hot days in 30 yrs
- 20 days/yr
Wind risk 9/10 · Severe
- Chance of severe wind over 30 yrs
- 99.0%
Air-quality risk 1/10 · Minimal
- Unhealthy air days now
- 0 days/yr
- Unhealthy air days in 30 yrs
- 0 days/yr
Risk factors via First Street. Map © Google.
Why this score? — see what drove the B+ grade
The composite is a weighted blend of 9 inputs, each scored 0–100. Each bar is that input's sub-score; the figure is the points it added to the 100-point composite (weight × sub-score).
- Cash flow +30.0/30.0
- ARV discount +15.0/15.0
- DSCR +10.0/10.0
- 1% rule +8.3/10.0
- Rent growth +3.6/5.0
- Schools +3.6/10.0
- Livability +3.4/5.0
- Condition / age +2.5/5.0
- Appreciation +0.0/10.0
$145,000
🖨 Deal sheet (PDF) 📄 Offer letter ✓ Due diligence
Listing remarks MLS
IMMACULATE,PRIDE OF OWNERSHIP EVIDENCED HERE.TILE BATHS WALK IN SHOWER MASTER BA.LOTS OF KITCHEN CABINETS.HUGE SCREENED PORCH.LG UTILITY ROOM.
Key facts
- 8,712 sq ft lot
- 3 parking spots
- Built 1970
Neighborhood map
What this means for you Summary
Snapshot
- This is a 4-bed/2.0-bath single-family listed at $145k.
Deal economics
- At list price, monthly cash flow is $644 ($8k/yr) — positive.
- The deal already cash-flows at list — no discount required.
- Meets the 1% rule at list price ($2k rent vs $145k).
- Recommended offer: $141k (3.0% below list) — sets the bar for market timing.
- Cap rate 11.6% vs local median 5.2% in Bellview — top-decile yield for the area; either an underpriced asset or a hidden risk that comps aren't pricing in. Stress-test before assuming the spread holds.
Location & tenants
- Location reads 67/100 on livability (#561 in FL) — a middle-class / working-renter tenant base. Strengths: cost of living A+, housing A+; Watch: schools D+, amenities F, commute F.
- Escambia (suburban): math 40% / reading 45% proficiency, ranked #56 of 73 in FL (top 77%) — families likely to look elsewhere, expect single-tenant / working-renter base with shorter leases.
- Market conditions: Rents rising fast (+4.4%/yr); 417 active listings in the ZIP; 11 comparable units currently listed for rent nearby; rentals at typical pace (median 24d on market — plan ~3-4 weeks tenant-placement turnaround); solid renter incomes; 1,479 units permitted in Escambia County in 2024 (0 in 5+ unit buildings).
- This rent runs 31% of the median local income ($75k/yr) — at the standard rent-burdened threshold; future hikes will face affordability resistance.
Forward outlook
- Local home prices are declining (-3.0%/yr); year-one equity from $1k of loan paydown is wiped out by about $4k of value loss. Plan a longer hold.
- Escambia County population projected at +13% by 2050 — modest demand growth; plan on rents tracking national, not racing it.
- At projected returns (-3.0% appreciation + 4.4% rent growth), your $41k cash investment doubles in ~6 years — after that, you're playing with house money.
Negotiation context
- It's been on market 31 days — a 3% lower offer ($141k) is reasonable based on typical stale-listing flexibility.
- 2 sale attempts since 27y ago with the ask held roughly flat each time — persistent listings suggest the price (not the market) is what's stuck; bring a comps-based counter.
- Current owner paid $66k; list at $145k implies a 120% gain — meaningful room to come down on a strong offer.
Risks & watch-outs
- Climate carrying-cost: severe wind risk, 99% chance of damaging wind over 30y; extreme-heat days projected 6→20/yr by 2055 (HVAC capex compounding) — expect insurance premiums to compound above CPI over the hold.
Questions for the listing agent
- It's been on market 31 days. Have you received any prior offers? Is the seller open to a 3% concession, seller financing, or rate buy-down credit?
- Built in 1970 — when were the roof, HVAC, electrical panel, plumbing, and water heater last replaced?
- Is there a deadline driving the sale (1031 exchange, divorce, estate, relocation)? That informs how much negotiation room exists.
- Schools are D-rated, which usually means shorter tenancies and higher turnover. Who's the typical renter profile here, and what's been the actual vacancy rate?
- What's the average days-on-market for RENTAL listings here right now (not sales)? A rising rental-DOM trend means longer vacancies and softer asking-rent achievability than the comps imply.
- What's the recent tenant-quality profile in this submarket — average credit score on applications, eviction rate, late-payment / NSF rate, and stable-employment percentage? A property-management company in the area should have these aggregated.
- How much new for-sale + rental construction is in the pipeline within 1–3 miles? Heavy new supply typically softens prices + rents 12–24 months out; constrained supply supports both.
Investment metrics
- 1% rule
- 1.33% ✓
- Cap rate
- 11.62%
- Cash-on-cash
- 19.03%
- DSCR
- 1.85
- GRM
- 6.3
CMA / ARV
- ARV (on-the-fly)
- $207,414
- Comps found
- 12
Show comp detail 12 sales within ~0.75 mi
| Address | Dist | Beds/Ba | Sqft | Sold | Price | $/sf | Match |
|---|---|---|---|---|---|---|---|
| 4674 Durham Dr | 0.18mi | 4/1.0 | 1,205 (-3%) | 5mo | $179,000 | $149 | 78 |
| 4664 Kingston Dr | 0.06mi | 3/1.5 (-1) | 1,300 (+5%) | 8mo | $200,000 | $154 | 76 |
| 4763 Lanett Dr | 0.33mi | 3/2.0 (-1) | 1,208 (-3%) | 2mo | $173,000 | $143 | 73 |
| 5787 Graymont Ln | 0.40mi | 3/2.0 (-1) | 1,171 (-6%) | 4mo | $225,000 | $192 | 64 |
| 6033 Champion Oaks Dr | 0.62mi | 4/2.0 | 1,231 (-1%) | 7mo | $199,900 | $162 | 64 |
| 5719 Ventura Ln | 0.36mi | 4/2.0 | 1,400 (+13%) | 3mo | $185,000 | $132 | 60 |
| 5684 Ventura Ln | 0.40mi | 3/1.5 (-1) | 1,150 (-7%) | 3mo | $199,900 | $174 | 60 |
| 3135 Bent Oak Dr | 0.68mi | 3/2.0 (-1) | 1,206 (-3%) | 3mo | $215,000 | $178 | 56 |
| 7026 Balboa Dr | 0.74mi | 3/2.0 (-1) | 1,220 (-2%) | 8mo | $204,000 | $167 | 51 |
| 6931 Falcon Dr | 0.72mi | 3/2.0 (-1) | 1,347 (+8%) | 2mo | $265,000 | $197 | 46 |
| 6027 Dallas Ave | 0.73mi | 3/2.0 (-1) | 1,336 (+8%) | 8mo | $239,000 | $179 | 42 |
| 7013 Balboa Dr | 0.72mi | 3/1.5 (-1) | 1,325 (+7%) | 8mo | $210,000 | $158 | 41 |
Match score weights: distance 35% · size 25% · config 20% · recency 20%. Top-matched comps best support the ARV.
Projected returns pro-forma
-3.0% appreciation · 4.42% rent growth · sell at horizon
- IRR
- 12.3%
- Equity multiple
- 1.50×
- Total profit
- $20,240
- Equity at exit
- $21,620
- IRR
- 22.3%
- Equity multiple
- 3.02×
- Total profit
- $81,990
- Equity at exit
- $12,537
Cash invested: $40,600 (down + closing). Projections, not guarantees.
Landlord ↔ Tenant lean methodology
- Overall (STATE)
- 87 Strongly Landlord-Friendly
- State Florida
- 87 Strongly Landlord-Friendly · R+3
- County
- — inherits STATE
- City
- — inherits STATE
ZIP-level market 32526
- Home prices YoY
- -28.3%
- Rents YoY
- 4.4%
- Active inventory
- 417
- Price-to-rent
- 6.3×
Monthly cashflow live
- Estimated rent
- $1,923 high interval (Pro) →
- Mortgage (P&I)
- −$760
- Tax from tax record
- −$55 /mo · $660/yr
- Insurance
- −$60
- HOA
- −$0
- Vacancy / Maint / Mgmt
- −$404
- Net cashflow
- $644
Break-even live
Sensitivity live
| Price | -10% $726 | -5% $685 | +0% $644 | +5% $603 | +10% $562 |
|---|---|---|---|---|---|
| Rent | -10% $492 | -5% $568 | +0% $644 | +5% $720 | +10% $796 |
| Rate | -1.0pp $717 | -0.5pp $681 | base $644 | +0.5pp $606 | +1.0pp $568 |
UW: 25.0% down · 7.5% · 30yr · 1.5% tax · 5.0% vac · 8.0% maint · 8.0% mgmt
Financing live
Cash to close
- Down payment
- $36,250
- Closing costs
- $4,350
- Reserves months
- —
- Total cash needed
- —
Loan-product check · same deal, 3 products live
Conventional
25% down · 7.5% · 30yr
- Down + closing
- —
- Monthly P&I
- —
- Monthly cashflow
- —
- DSCR
- —
- Eligible?
- —
Personal DTI + credit; lowest rate.
DSCR
20% down · 8.5% · 30yr
- Down + closing
- —
- Monthly P&I
- —
- Monthly cashflow
- —
- DSCR
- —
- Eligible?
- —
No personal income docs; deal must DSCR.
Hard money
10% down · 12.0% · 12mo
- Down + closing
- —
- Monthly P&I
- —
- Monthly cashflow
- —
- DSCR
- —
- Eligible?
- —
Short-term bridge; refi at stabilization.
Rent comps 11 comps
| Address | Beds | Baths | Sqft | Rent | $/sqft | DOM | Units | Dist |
|---|---|---|---|---|---|---|---|---|
| 6081 Royal Port Ct Pensacola, FL | 3.0 | 2.5 | 1428 | $1,850 | $1.30 | 24d | 1 | 0.53mi |
| 3230 Palmdale Ave Pensacola, FL | 3.0 | 2.0 | 1300 | $1,500 | $1.15 | 24d | 1 | 0.67mi |
| 5472 Dover Ave Pensacola, FL | 3.0 | 2.0 | 840 | $1,300 | $1.55 | 24d | 1 | 0.75mi |
| 4930 Laceiba Dr Pensacola, FL | 3.0 | 1.5 | 1020 | $1,300 | $1.27 | 22d | 1 | 0.76mi |
| 6225 Mobile Hwy Pensacola, FL | 1.0–3.0 | 1.0–2.0 | 1036 | $2,595 | $2.50 | 14d | 15 | 0.77mi |
| 3219 Fresno Ave Pensacola, FL | 3.0 | 2.0 | 1192 | $1,375 | $1.15 | 24d | 1 | 0.84mi |
| 6322 Louisville Ave Pensacola, FL | 3.0 | 2.0 | 1001 | $2,147 | $2.14 | 24d | 1 | 0.95mi |
| 2702 Massachusetts Ave Pensacola, FL | 1.0–3.0 | 1.0–2.5 | 1150 | $1,745 | $1.52 | 14d | 9 | 0.99mi |
| 5877 Tryton Cir Pensacola, FL | 4.0 | 2.0 | 1419 | $1,825 | $1.29 | 24d | 1 | 1.26mi |
| 5404 N Blue Angel Pkwy Pensacola, FL | 3.0 | 1.0 | 1120 | $1,275 | $1.14 | 24d | 1 | 1.27mi |
| 3216 Two Sisters Way Pensacola, FL | 3.0 | 2.0 | 1117 | $1,700 | $1.52 | 24d | 1 | 1.39mi |
Listing history 7 events
-
2026-04-23status Pending
-
2026-04-11historical Contingent
-
2026-03-23$145,000 Active
-
2000-04-04soldstatus $66,000
-
2000-03-30soldstatus $66,000 142-char remark
Show marketing remark (142 chars)
IMMACULATE,PRIDE OF OWNERSHIP EVIDENCED HERE.TILE BATHS WALK IN SHOWER MASTER BA.LOTS OF KITCHEN CABINETS.HUGE SCREENED PORCH.LG UTILITY ROOM.
-
1999-12-07$65,000 142-char remark
Show marketing remark (142 chars)
IMMACULATE,PRIDE OF OWNERSHIP EVIDENCED HERE.TILE BATHS WALK IN SHOWER MASTER BA.LOTS OF KITCHEN CABINETS.HUGE SCREENED PORCH.LG UTILITY ROOM.
-
1994-08-01soldstatus $51,900
ⓘ Source: listings_history table (triggers on properties + properties_extension) + one-shot
backfill from property_details.listing_events for pre-trigger history.
Tax reassessment forecast FL · Resets to sale price
- Current annual tax
- $660 · $55/mo
- Projected year-2 tax
- $1,204 · $100/mo
- Expected delta
- +$544/yr (+$45/mo · 82.4%)
ⓘ Screening estimate from a state-policy table — verify with the county assessor before closing.
Climate risk First Street
- Flood 1/10 Low FEMA zone X (unshaded) · 0% chance over 30 yrs
- Wildfire 3/10 Moderate
- Heat 10/10 Extreme 6 d/yr ≥105°F today · 20 d/yr by 30 yrs out
- Wind 9/10 Extreme 99% chance of damaging wind over 30 yrs
- Air quality 1/10 Low 0 unhealthy d/yr today · 0 by 30 yrs out
Nearby sold comps map
Loading sold comps map…
Walkable amenities ~0.75 mi
Loading nearby amenities…
Taxation est. · year 1
- Rental income
- $23,081
- − Mortgage interest
- −$8,122
- − Property taxes
- −$660
- − Insurance
- −$725
- − Repairs & maintenance
- −$1,846
- − Management
- −$1,846
- − Depreciation
- −$4,218
- Taxable income
- $5,663
- Est. tax owed @ 24.0%
- −$1,359
- After-tax cash flow
- $6,365/yr
For passive investors: Depreciation is non-cash, so a rental often shows a tax loss while cash-flowing — sheltering income. Rental losses are passive: they offset passive income freely, and up to $25,000/yr can offset ordinary (W-2) income if you actively participate and your MAGI is under $100k (phasing out to $0 by $150k); unused losses carry forward. On sale, claimed depreciation is recaptured at up to 25%, and gains may owe capital-gains tax (a 1031 exchange can defer both). Figures are a year-1 estimate at your 24.0% rate — not tax advice; consult a CPA.
Schools (NCES district)
- District
- Escambia
- NCES district ID
- 1200510
- Math proficiency
- 40% ▼ -9.00%
- Reading proficiency
- 45% ▼ -4.00%
- Median HH income
- $44,649
- Composite
- 36.04/100
- National rank
- #4773
- State rank
- #56 of 73 in FL
Livability — Bellview
- Score
- 67/100
- State rank
- #561
- US rank
- #10731
Category grades
Schools grade is shown separately in the Schools card above.
Census & demographics
- Census place
- Bellview, FL
- County
- Escambia County · 301,722 people
- Metro
- Pensacola-Ferry Pass-Brent, FL
- Population (ZIP)
- 44,680
- Household income
- $75,098
- Rent vs Own
- Severe rent burden
- 1166.0
Population outlook (Escambia County) Hauer SSP2
- Today (2025)
- 334,637 people
- By 2030
- 345,779 · +3.3%
- By 2040
- 364,828 · +9.0%
- By 2050
- 378,514 · +13.1%
- By 2075
- 403,220 · +20.5%
- By 2100
- 386,125 · +15.4%
Race, ethnicity, and origin ACS 2023
- Neighborhood character
- Predominantly White (66%)
- Race & ethnicity
- White 66% Black 19% Two or more races 8% Hispanic / Latino 5% Asian 3%
- Common ancestry
- Lithuanian 2% Slovak 2% Serbian 2%
- Foreign-born
- 5% · Canada, China
- Languages at home
- 94% English-only · Spanish 2% Tagalog/Filipino 1% Other Indo-European 1%
Political lean MEDSL · Escambia
- 2024 margin
- R (+19.5) · D 39.7% · R 59.2% · Other 1.1%
- 2008→2024 swing
- -0.2pp no change · 2008: -19.3pp · 2024: -19.5pp
- All cycles
- 2024: R+19.5 2020: R+15.1 2016: R+20.6 2012: R+20.6 2008: R+19.3
Not yet ingested
- Civics
- —
Market trends
- HPI YoY
- ▼ -99.68%
- Current HPI
- 252.6406
- Rent YoY
- ▲ 4.42%
- Metro
- Pensacola-Ferry Pass-Brent, FL
- State GDP YoY
- ▲ 3.28%
- F500 in state
- 36
Industry mix (Fortune 500 HQ in FL)
| Industry | F500 HQs | Revenue |
|---|---|---|
| Industrial Technology | 2 | $29B |
|
||
| Insurance | 2 | $17B |
|
||
| Retail | 1 | $60B |
|
||
| Technology Distribution | 1 | $58B |
|
||
| Homebuilding | 1 | $35B |
|
||
| Technology Manufacturing | 1 | $35B |
|
||
Price history
+179.4% since first listed7 events — show timeline
- 2026-04-23 Pending — PARMLS
- 2026-04-11 Contingent — PARMLS
- 2026-03-23 Listed $145,000 PARMLS
- 2000-04-04 Sold (Public Records) $66,000 Public Records
- 2000-03-30 Sold (MLS) $66,000 PARMLS
- 1999-12-07 Listed $65,000 PARMLS
- 1994-08-01 Sold (Public Records) $51,900 Public Records
Property tax history
+3.1%/yrLatest (2025): $660 · +25.0% YoY. Source: county tax records.
Cash-flow waterfall
monthlySold comps — $/sqft
last 12 mo · ≤1 miLoading sold comps…