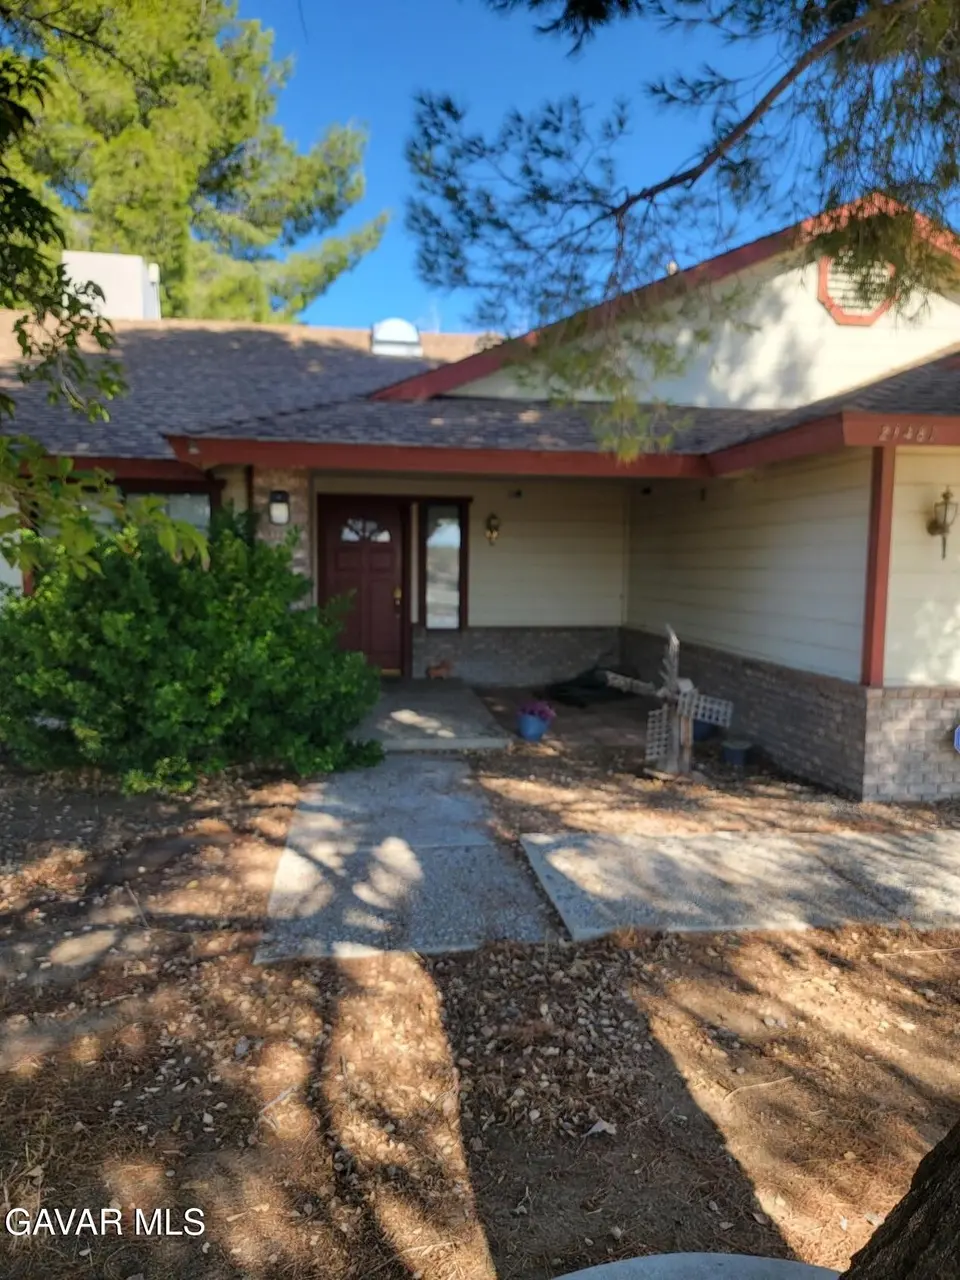
21481 Randsburg Mojave Rd · California City, CA
Flood risk 1/10 · Minimal
- FEMA flood zone
- X (unshaded)
- Chance of flooding over 30 yrs
- 0.0%
- Est. flood insurance / yr
- $507 – $1,088
Fire risk 1/10 · Minimal
- Est. fire insurance / yr
- $659 – $1,223
Heat risk 8/10 · Major
- Hot days now (above 101°F)
- 5 days/yr
- Hot days in 30 yrs
- 13 days/yr
Wind risk 1/10 · Minimal
- Chance of severe wind over 30 yrs
- —
Air-quality risk 7/10 · Major
- Unhealthy air days now
- 13 days/yr
- Unhealthy air days in 30 yrs
- 15 days/yr
Risk factors via First Street. Map © Google.
Why this score? — see what drove the C grade
The composite is a weighted blend of 9 inputs, each scored 0–100. Each bar is that input's sub-score; the figure is the points it added to the 100-point composite (weight × sub-score).
- Cash flow +15.0/30.0
- ARV discount +15.0/15.0
- Appreciation +10.0/10.0
- DSCR +4.6/10.0
- Rent growth +3.9/5.0
- 1% rule +3.5/10.0
- Condition / age +2.5/5.0
- Livability +2.2/5.0
- Schools +2.1/10.0
$239,000
🖨 Deal sheet 📄 Offer letter ✓ Due diligence
Listing remarks MLS
INCREDIBLE OPPORTUNITY FOR FLIPPERS OR INVESTORS! California City, a small town that has room for growth. With local restaurants, shopping, parks and schools. This nice 3 bedroom, 1 and ¾ bath with a fireplace in living room also has ceiling fans in Living room and main bedroom. Central air conditioning, evaporative cooler, stove and, a refrigerator. Fenced back yards, 2 car garage and RV parking possible. With sewer, SCE, public water and natural gas. The main bathroom needs to be remodeled. Buyer to verify all needed building requirements. This is a probate sale, and all offers will need to be approved by the court and escrow period 90 days at least. AS IS SALE
Key facts
- Ceiling fans
- Fenced back yards
- Rv parking possible
Tags
Neighborhood map
What this means for you Summary
Snapshot
- This is a 3-bed/2.0-bath single-family listed at $239k.
Deal economics
- At list price, monthly cash flow is $73 ($875/yr) — positive.
- The deal already cash-flows at list — no discount required.
- To meet the 1% rule (rent ≥ 1% of price), the offer needs to be $203k (15.1% below list).
- Recommended offer: $203k (15.1% below list) — sets the bar for 1% rule.
- Cap rate 6.7% vs local median 5.2% in California City — meaningfully above typical; check what's discounted (condition, days-on-market, listing class) to confirm the premium yield is real.
Location & tenants
- Location reads 44/100 on livability (#1,329 in CA) — a working-class tenant base; expect higher turnover. Strengths: housing A+; Watch: schools F, crime F, amenities F.
- Mojave Unified (town): math 25% / reading 25% proficiency, ranked #411 of 517 in CA (top 80%) — low school quality limits family demand, transient renter base, plan for 1-2y turnover; 76% free/reduced lunch — lower-income household profile, screen leases tightly.
- Market conditions: Rents rising fast (+5.5%/yr); 703 active listings in the ZIP; 8 comparable units currently listed for rent nearby; rentals at typical pace (median 24d on market — plan ~3-4 weeks tenant-placement turnaround); 3,244 units permitted in Kern County in 2024 (73 in 5+ unit buildings).
- This rent runs 41% of the median local income ($60k/yr) — at the standard rent-burdened threshold; future hikes will face affordability resistance.
Forward outlook
- In year one you build about $26k of equity ($2k loan paydown + $24k appreciation (10.0% local appreciation)).
- Kern County population projected at +17% by 2050 — long-run rental-demand tailwind backs the buy-and-hold thesis.
- At projected returns (10.0% appreciation + 5.5% rent growth), your $67k cash investment doubles in ~3 years — after that, you're playing with house money.
- By year 2, paydown + projected appreciation supports a ~$41k cash-out refi (75% LTV) — recoverable capital for the next deal without selling this one.
Negotiation context
- It's been on market 245 days — a 12% lower offer ($210k) is reasonable based on typical stale-listing flexibility.
- Current owner paid $98k; list at $239k implies a 145% gain — meaningful room to come down on a strong offer.
Risks & watch-outs
- Climate carrying-cost: extreme-heat days projected 5→13/yr by 2055 (HVAC capex compounding) — expect insurance premiums to compound above CPI over the hold.
Questions for the listing agent
- It's been on market 245 days. Have you received any prior offers? Is the seller open to a 15% concession, seller financing, or rate buy-down credit?
- Why hasn't it sold? Are there any deal-killer items the seller is aware of (foundation, flood, title, zoning, code violations)?
- Is there a deadline driving the sale (1031 exchange, divorce, estate, relocation)? That informs how much negotiation room exists.
- Schools are F-rated, which usually means shorter tenancies and higher turnover. Who's the typical renter profile here, and what's been the actual vacancy rate?
- Crime grade is F in this area — have there been break-ins, vandalism, or insurance claims at this property in the last 3 years? What carrier currently insures it and at what premium?
- What's the average days-on-market for RENTAL listings here right now (not sales)? A rising rental-DOM trend means longer vacancies and softer asking-rent achievability than the comps imply.
- What's the recent tenant-quality profile in this submarket — average credit score on applications, eviction rate, late-payment / NSF rate, and stable-employment percentage? A property-management company in the area should have these aggregated.
- How much new for-sale + rental construction is in the pipeline within 1–3 miles? Heavy new supply typically softens prices + rents 12–24 months out; constrained supply supports both.
Investment metrics
- 1% rule
- 0.85% ✗
- Cap rate
- 6.66%
- Cash-on-cash
- 1.31%
- DSCR
- 1.06
- GRM
- 9.8
CMA / ARV
- ARV (median comp)
- $343,209
- List price
- $239,000
- Delta
- -30.36%
- Verdict
- UNDERPRICED
- Comps
- 20 within 1.0 mi
Show comp detail 12 sales within ~0.75 mi
| Address | Dist | Beds/Ba | Sqft | Sold | Price | $/sf | Match |
|---|---|---|---|---|---|---|---|
| 10549 Camille Ct | 0.27mi | 3/2.0 | 1,508 (-10%) | 1mo | $319,000 | $212 | 70 |
| 21745 Upton Dr | 0.31mi | 3/2.0 | 1,514 (-10%) | 2mo | $300,000 | $198 | 68 |
| 21631 Sheridan Ct | 0.31mi | 4/2.0 (+1) | 1,792 (+7%) | 4mo | $389,000 | $217 | 66 |
| 10701 Bay Ave | 0.60mi | 3/2.0 | 1,629 (-3%) | 5mo | $335,000 | $206 | 63 |
| 21420 Reed Pl | 0.20mi | 4/3.0 (+1) | 1,858 (+11%) | 1mo | $379,900 | $204 | 63 |
| 10840 Evelyn Ave | 0.35mi | 3/2.0 | 1,845 (+10%) | 6mo | $305,000 | $165 | 62 |
| 11043 Rome Beauty Dr | 0.43mi | 3/2.0 | 1,505 (-10%) | 3mo | $270,000 | $179 | 61 |
| 10611 Garibaldi Dr | 0.52mi | 3/2.0 | 1,500 (-10%) | 1mo | $175,000 | $117 | 57 |
| 21750 Bancroft Dr | 0.60mi | 4/2.0 (+1) | 1,809 (+8%) | 6mo | $320,000 | $177 | 48 |
| 21251 Calhoun Ct | 0.73mi | 3/2.0 | 1,429 (-15%) | 4mo | $330,000 | $231 | 38 |
| 21231 Calhoun Ct | 0.74mi | 3/2.0 | 1,429 (-15%) | 4mo | $331,000 | $232 | 37 |
| 21241 Calhoun Ct | 0.74mi | 4/2.0 (+1) | 1,429 (-15%) | 2mo | $323,000 | $226 | 34 |
Match score weights: distance 35% · size 25% · config 20% · recency 20%. Top-matched comps best support the ARV.
Projected returns pro-forma
10.0% appreciation · 5.45% rent growth · sell at horizon
- IRR
- 26.0%
- Equity multiple
- 3.09×
- Total profit
- $139,891
- Equity at exit
- $215,310
- IRR
- 23.5%
- Equity multiple
- 7.27×
- Total profit
- $419,693
- Equity at exit
- $464,324
Cash invested: $66,920 (down + closing). Projections, not guarantees.
Landlord ↔ Tenant lean methodology
- Overall (STATE)
- 18 Strongly Tenant-Friendly
- State California
- 18 Strongly Tenant-Friendly · D+13
- County
- — inherits STATE
- City
- — inherits STATE
ZIP-level market 93505
- Home prices YoY
- 13.0%
- Rents YoY
- 5.5%
- Active inventory
- 703
- Price-to-rent
- 9.8×
Monthly cashflow live
- Estimated rent
- $2,029 high interval (Pro) →
- Mortgage (P&I)
- −$1,253
- Tax from tax record
- −$177 /mo · $2,122/yr
- Insurance
- −$100
- HOA
- −$0
- Vacancy / Maint / Mgmt
- −$426
- Net cashflow
- $73
Break-even live
UW: 25.0% down · 7.5% · 30yr · 1.5% tax · 5.0% vac · 8.0% maint · 8.0% mgmt
Financing live
Cash to close
- Down payment
- $59,750
- Closing costs
- $7,170
- Reserves months
- —
- Total cash needed
- —
Loan-product check · same deal, 3 products live
Conventional
25% down · 7.5% · 30yr
- Down + closing
- —
- Monthly P&I
- —
- Monthly cashflow
- —
- DSCR
- —
- Eligible?
- —
Personal DTI + credit; lowest rate.
DSCR
20% down · 8.5% · 30yr
- Down + closing
- —
- Monthly P&I
- —
- Monthly cashflow
- —
- DSCR
- —
- Eligible?
- —
No personal income docs; deal must DSCR.
Hard money
10% down · 12.0% · 12mo
- Down + closing
- —
- Monthly P&I
- —
- Monthly cashflow
- —
- DSCR
- —
- Eligible?
- —
Short-term bridge; refi at stabilization.
Rent comps 8 comps
| Address | Beds | Baths | Sqft | Rent | $/sqft | DOM | Units | Dist |
|---|---|---|---|---|---|---|---|---|
| 21398 Baldwin Ln California City, CA | 4.0 | 2.0 | 1527 | $2,000 | $1.31 | 2d | 1 | 0.33mi |
| 10193 Evelyn Ave California City, CA | 3.0 | 2.0 | 1616 | $2,150 | $1.33 | 14d | 1 | 0.74mi |
| 21319 Conklin Ct California City, CA | 2.0 | 2.0 | 1816 | $2,200 | $1.21 | 43d | 1 | 0.88mi |
| 21187 Conklin Blvd California City, CA | 3.0 | 2.0 | 1473 | $1,800 | $1.22 | 14d | 1 | 0.91mi |
| 9931 Putter Ct California City, CA | 3.0 | 2.0 | 1445 | $1,675 | $1.16 | 3d | 1 | 0.94mi |
| 21235 Windsong St California City, CA | 3.0 | 3.0 | 1780 | $2,100 | $1.18 | 23d | 1 | 0.95mi |
| 9548 Sally Ave Unit B California City, CA | 3.0 | 2.5 | 1200 | $1,695 | $1.41 | 23d | 1 | 1.33mi |
| 9524 Sally Ave Unit C California City, CA | 2.0 | 1.5 | 1140 | $1,300 | $1.14 | 23d | 1 | 1.38mi |
Listing history 5 events
-
2025-11-01price $239,000 678-char remark
Show marketing remark (678 chars)
INCREDIBLE OPPORTUNITY FOR FLIPPERS OR INVESTORS! California City, a small town that has room for growth. With local restaurants, shopping, parks and schools. This nice 3 bedroom, 1 and ¾ bath with a fireplace in living room also has ceiling fans in Living room and main bedroom. Central air conditioning, evaporative cooler, stove and, a refrigerator. Fenced back yards, 2 car garage and RV parking possible. With sewer, SCE, public water and natural gas. The main bathroom needs to be remodeled. Buyer to verify all needed building requirements. This is a probate sale, and all offers will need to be approved by the court and escrow period 90 days at least. AS IS SALE
-
2025-09-24$250,000 Active 678-char remark
Show marketing remark (678 chars)
INCREDIBLE OPPORTUNITY FOR FLIPPERS OR INVESTORS! California City, a small town that has room for growth. With local restaurants, shopping, parks and schools. This nice 3 bedroom, 1 and ¾ bath with a fireplace in living room also has ceiling fans in Living room and main bedroom. Central air conditioning, evaporative cooler, stove and, a refrigerator. Fenced back yards, 2 car garage and RV parking possible. With sewer, SCE, public water and natural gas. The main bathroom needs to be remodeled. Buyer to verify all needed building requirements. This is a probate sale, and all offers will need to be approved by the court and escrow period 90 days at least. AS IS SALE
-
1991-12-26soldstatus $97,500
-
1991-12-26soldstatus $97,500
-
1989-10-23soldstatus $14,000
ⓘ Source: listings_history table (triggers on properties + properties_extension) + one-shot
backfill from property_details.listing_events for pre-trigger history.
Tax reassessment forecast CA · Resets to sale price
- Current annual tax
- $2,122 · $177/mo
- Projected year-2 tax
- $2,122 · $177/mo
- Expected delta
- $0/yr ($0/mo · 0.0%)
ⓘ Screening estimate from a state-policy table — verify with the county assessor before closing.
Climate risk First Street
- Flood 1/10 Low FEMA zone X (unshaded) · 0% chance over 30 yrs
- Wildfire 1/10 Low
- Heat 8/10 Severe 5 d/yr ≥101°F today · 13 d/yr by 30 yrs out
- Wind 1/10 Low
- Air quality 7/10 Severe 13 unhealthy d/yr today · 15 by 30 yrs out
Nearby sold comps map
Loading sold comps map…
Walkable amenities ~0.75 mi
Loading nearby amenities…
Taxation est. · year 1
- Rental income
- $24,345
- − Mortgage interest
- −$13,388
- − Property taxes
- −$2,122
- − Insurance
- −$1,195
- − Repairs & maintenance
- −$1,948
- − Management
- −$1,948
- − Depreciation
- −$6,953
- Taxable loss
- −$3,208
- Est. tax savings @ 24.0%
- +$770
- After-tax cash flow
- $1,645/yr
For passive investors: Depreciation is non-cash, so a rental often shows a tax loss while cash-flowing — sheltering income. Rental losses are passive: they offset passive income freely, and up to $25,000/yr can offset ordinary (W-2) income if you actively participate and your MAGI is under $100k (phasing out to $0 by $150k); unused losses carry forward. On sale, claimed depreciation is recaptured at up to 25%, and gains may owe capital-gains tax (a 1031 exchange can defer both). Figures are a year-1 estimate at your 24.0% rate — not tax advice; consult a CPA.
Schools (NCES district)
- District
- Mojave Unified
- NCES district ID
- 0625230
- Math proficiency
- 25% ▲ 11.00%
- Reading proficiency
- 25% ▼ -1.00%
- Median HH income
- $43,017
- Composite
- 21.4/100
- National rank
- #8350
- State rank
- #411 of 517 in CA
Livability — California City
- Score
- 44/100
- State rank
- #1329
- US rank
- #26753
Category grades
Schools grade is shown separately in the Schools card above.
Census & demographics
- Census place
- California City, CA
- County
- Kern County · 710,371 people
- City population
- 14,353
- Metro
- Bakersfield, CA
- Population (ZIP)
- 14,353
- Household income
- $59,827
- Rent vs Own
- Severe rent burden
- 883.0
Population outlook (Kern County) Hauer SSP2
- Today (2025)
- 947,286 people
- By 2030
- 978,984 · +3.3%
- By 2040
- 1,045,018 · +10.3%
- By 2050
- 1,105,232 · +16.7%
- By 2075
- 1,229,538 · +29.8%
- By 2100
- 1,238,059 · +30.7%
Race, ethnicity, and origin ACS 2023
- Neighborhood character
- Highly diverse neighborhood (Simpson 0.70)
- Race & ethnicity
- Hispanic / Latino 40% White 30% Black 22% Two or more races 16% Native American 3% Asian 1%
- Hispanic origin (detail)
- Mexican 29%
- Common ancestry
- Italian 3% Lithuanian 1% Romanian 1%
- Foreign-born
- 13% · Canada, Dominican Republic
- Languages at home
- 68% English-only · Spanish 29%
Political lean MEDSL · Kern
- 2024 margin
- Strong R (+21.1) · D 38.2% · R 59.3% · Other 2.5%
- 2008→2024 swing
- -3.3pp toward R · 2008: -17.8pp · 2024: -21.1pp
- All cycles
- 2024: R+21.1 2020: R+10.2 2016: R+15.0 2012: R+20.9 2008: R+17.8
Not yet ingested
- Civics
- —
Market trends
- HPI YoY
- ▲ 46.32%
- Current HPI
- 402.4192
- Rent YoY
- ▲ 5.45%
- Metro
- Bakersfield, CA
- State GDP YoY
- ▲ 3.21%
- F500 in state
- 116
Industry mix (Fortune 500 HQ in CA)
| Industry | F500 HQs | Revenue |
|---|---|---|
| Technology | 27 | $1,492B |
|
||
| Financial Services | 3 | $174B |
|
||
| Retail | 3 | $44B |
|
||
| Insurance | 3 | $26B |
|
||
| Media / Entertainment | 2 | $115B |
|
||
| Pharmaceuticals / Biotech | 2 | $62B |
|
||
Price history
+1607.1% since first listed5 events — show timeline
- 2025-11-01 Price Changed $239,000 AVMLS
- 2025-09-24 Listed $250,000 AVMLS
- 1991-12-26 Sold (Public Records) $97,500 Public Records
- 1991-12-26 Sold (Public Records) $97,500 Public Records
- 1989-10-23 Sold (Public Records) $14,000 Public Records
Property tax history
+7.0%/yrLatest (2025): $2,122 · -5.0% YoY. Source: county tax records.
Cash-flow waterfall
monthlySold comps — $/sqft
last 12 mo · ≤1 miLoading sold comps…