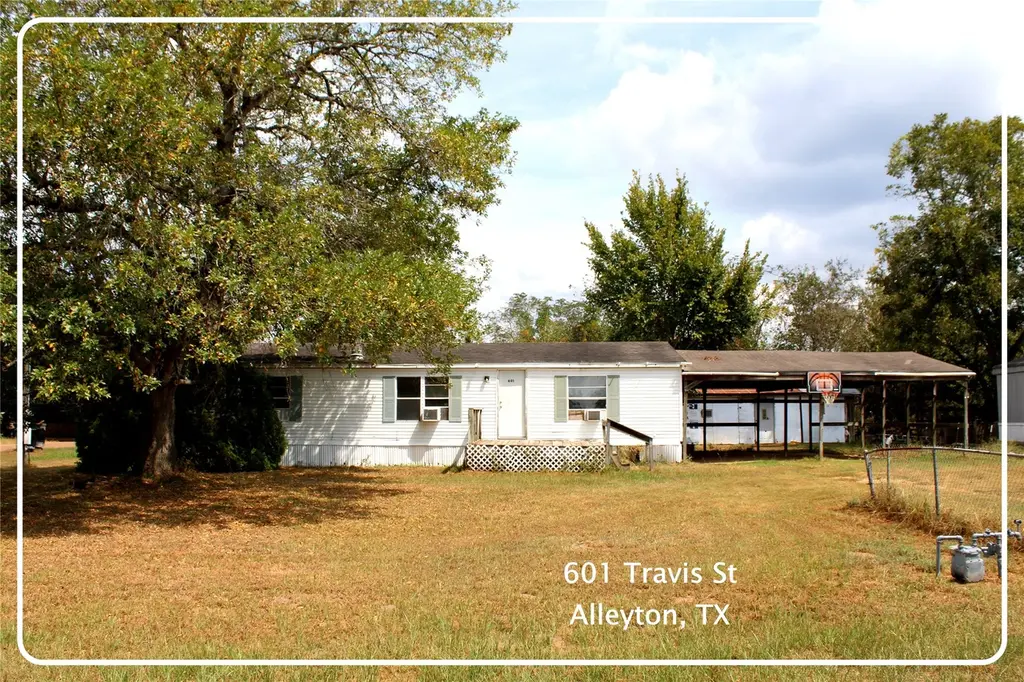
601 Travis St · Columbus, TX
Flood risk 1/10 · Minimal
- FEMA flood zone
- X (shaded)
- Chance of flooding over 30 yrs
- 0.0%
- Est. flood insurance / yr
- $507 – $1,088
Fire risk 2/10 · Minimal
- Est. fire insurance / yr
- $1,222 – $2,270
Heat risk 8/10 · Major
- Hot days now (above 111°F)
- 7 days/yr
- Hot days in 30 yrs
- 22 days/yr
Wind risk 8/10 · Major
- Chance of severe wind over 30 yrs
- 99.0%
Air-quality risk 1/10 · Minimal
- Unhealthy air days now
- 0 days/yr
- Unhealthy air days in 30 yrs
- 0 days/yr
Risk factors via First Street. Map © Google.
Why this score? — see what drove the B grade
The composite is a weighted blend of 9 inputs, each scored 0–100. Each bar is that input's sub-score; the figure is the points it added to the 100-point composite (weight × sub-score).
- Cash flow +30.0/30.0
- DSCR +10.0/10.0
- 1% rule +9.2/10.0
- ARV discount +7.5/15.0
- Appreciation +4.7/10.0
- Livability +3.6/5.0
- Schools +2.9/10.0
- Rent growth +2.5/5.0
- Condition / age +2.5/5.0
$150,000
🖨 Deal sheet 📄 Offer letter ✓ Due diligence
Listing remarks
SOLID built home. Needs some repairs, Situated on a shady corner lot - 1/4 of an acre! Country setting with easy access to IH-10 and SH 71. 3 bedroom, 2 full baths. Kitchen open to dining room. Split bedroom floor-plan. Wood burning fireplace. Attached double carport. Additional building in back can be transformed into an additional living area, game room, man cave, she shed, workshop, etc. .. just use your imagination! Owner will carry note with terms.
Key facts
- Country setting
- Shady corner lot
- Additional building
Tags
Neighborhood map
What this means for you Summary
Snapshot
- This is a 3-bed/2.0-bath manufactured listed at $150k.
Deal economics
- At list price, monthly cash flow is $806 ($10k/yr) — positive.
- The deal already cash-flows at list — no discount required.
- Meets the 1% rule at list price ($2k rent vs $150k).
- Recommended offer: $132k (12.0% below list) — sets the bar for market timing.
- Cap rate 12.7% vs local median 2.4% in Columbus — top-decile yield for the area; either an underpriced asset or a hidden risk that comps aren't pricing in. Stress-test before assuming the spread holds.
Location & tenants
- Location reads 71/100 on livability (#295 in TX) — a middle-class / working-renter tenant base. Strengths: cost of living A+, housing A+, crime A; Watch: health & safety C-, amenities F, commute F.
- Columbus ISD (town): math 34% / reading 34% proficiency, ranked #531 of 826 in TX (top 64%) — families likely to look elsewhere, expect single-tenant / working-renter base with shorter leases.
- Market conditions: 12 active listings in the ZIP; 29 units permitted in Colorado County in 2024 (0 in 5+ unit buildings).
Forward outlook
- In year one you build about $79 of equity ($1k loan paydown + $-958 appreciation (-0.6% local appreciation)).
- At projected returns (-0.6% appreciation + 3.0% rent growth), your $42k cash investment doubles in ~4 years — after that, you're playing with house money.
Negotiation context
- It's been on market 262 days — a 12% lower offer ($132k) is reasonable based on typical stale-listing flexibility.
- 3 sale attempts since 2y ago with the ask held roughly flat each time — persistent listings suggest the price (not the market) is what's stuck; bring a comps-based counter.
Risks & watch-outs
- Climate carrying-cost: severe wind risk, 99% chance of damaging wind over 30y; extreme-heat days projected 7→22/yr by 2055 (HVAC capex compounding) — expect insurance premiums to compound above CPI over the hold.
Questions for the listing agent
- It's been on market 262 days. Have you received any prior offers? Is the seller open to a 12% concession, seller financing, or rate buy-down credit?
- Why hasn't it sold? Are there any deal-killer items the seller is aware of (foundation, flood, title, zoning, code violations)?
- Is there a deadline driving the sale (1031 exchange, divorce, estate, relocation)? That informs how much negotiation room exists.
- What's the average days-on-market for RENTAL listings here right now (not sales)? A rising rental-DOM trend means longer vacancies and softer asking-rent achievability than the comps imply.
- What's the recent tenant-quality profile in this submarket — average credit score on applications, eviction rate, late-payment / NSF rate, and stable-employment percentage? A property-management company in the area should have these aggregated.
- How much new for-sale + rental construction is in the pipeline within 1–3 miles? Heavy new supply typically softens prices + rents 12–24 months out; constrained supply supports both.
Investment metrics
- 1% rule
- 1.42% ✓
- Cap rate
- 12.74%
- Cash-on-cash
- 23.03%
- DSCR
- 2.02
- GRM
- 5.9
CMA / ARV
No comps found within radius.
Projected returns pro-forma
-0.64% appreciation · 3.0% rent growth · sell at horizon
- IRR
- 21.6%
- Equity multiple
- 2.01×
- Total profit
- $42,438
- Equity at exit
- $38,827
- IRR
- 26.5%
- Equity multiple
- 3.80×
- Total profit
- $117,591
- Equity at exit
- $43,049
Cash invested: $42,000 (down + closing). Projections, not guarantees.
Landlord ↔ Tenant lean methodology
- Overall (STATE)
- 87 Strongly Landlord-Friendly
- State Texas
- 87 Strongly Landlord-Friendly · R+5
- County
- — inherits STATE
- City
- — inherits STATE
ZIP-level market 78935
- Home prices YoY
- -0.6%
- Active inventory
- 12
- Price-to-rent
- 5.9×
Monthly cashflow live
- Estimated rent
- $2,130 medium interval (Pro) →
- Mortgage (P&I)
- −$787
- Tax from tax record
- −$28 /mo · $335/yr
- Insurance
- −$62
- HOA
- −$0
- Vacancy / Maint / Mgmt
- −$447
- Net cashflow
- $806
Break-even live
UW: 25.0% down · 7.5% · 30yr · 1.5% tax · 5.0% vac · 8.0% maint · 8.0% mgmt
Financing live
Cash to close
- Down payment
- $37,500
- Closing costs
- $4,500
- Reserves months
- —
- Total cash needed
- —
Loan-product check · same deal, 3 products live
Conventional
25% down · 7.5% · 30yr
- Down + closing
- —
- Monthly P&I
- —
- Monthly cashflow
- —
- DSCR
- —
- Eligible?
- —
Personal DTI + credit; lowest rate.
DSCR
20% down · 8.5% · 30yr
- Down + closing
- —
- Monthly P&I
- —
- Monthly cashflow
- —
- DSCR
- —
- Eligible?
- —
No personal income docs; deal must DSCR.
Hard money
10% down · 12.0% · 12mo
- Down + closing
- —
- Monthly P&I
- —
- Monthly cashflow
- —
- DSCR
- —
- Eligible?
- —
Short-term bridge; refi at stabilization.
Listing history 20 events
-
2026-06-18days on market $150,000 Active 262 DOM
-
2026-06-17days on market $150,000 Active 261 DOM
-
2026-06-16days on market $150,000 Active 260 DOM
-
2026-06-15days on market $150,000 Active 259 DOM
-
2026-06-13days on market $150,000 Active 257 DOM
-
2026-06-12days on market $150,000 Active 256 DOM
-
2026-06-09days on market $150,000 Active 253 DOM
-
2026-06-08days on market $150,000 Active 252 DOM
-
2026-06-08days on market $150,000 Active 251 DOM
-
2026-06-05days on market $150,000 Active 249 DOM
-
2026-06-03days on market $150,000 Active 247 DOM
-
2026-06-02days on market $150,000 Active 246 DOM
-
2026-06-01days on market $150,000 Active 245 DOM
-
2026-05-31days on market $150,000 Active 244 DOM
-
2025-10-01historical
-
2025-09-29$150,000 Active
-
2025-09-29historical
-
2025-09-29$150,000 Active
-
2024-10-04$150,000 Active
-
1992-11-15soldstatus
ⓘ Source: listings_history table (triggers on properties + properties_extension) + one-shot
backfill from property_details.listing_events for pre-trigger history.
Tax reassessment forecast TX · Resets to sale price
- Current annual tax
- $335 · $28/mo
- Projected year-2 tax
- $2,745 · $229/mo
- Expected delta
- +$2,410/yr (+$201/mo · 719.0%)
ⓘ Screening estimate from a state-policy table — verify with the county assessor before closing.
Climate risk First Street
- Flood 1/10 Low FEMA zone X (shaded) · 0% chance over 30 yrs
- Wildfire 2/10 Low
- Heat 8/10 Severe 7 d/yr ≥111°F today · 22 d/yr by 30 yrs out
- Wind 8/10 Severe 99% chance of damaging wind over 30 yrs
- Air quality 1/10 Low 0 unhealthy d/yr today · 0 by 30 yrs out
Nearby sold comps map
Loading sold comps map…
Walkable amenities ~0.75 mi
Loading nearby amenities…
Taxation est. · year 1
- Rental income
- $25,566
- − Mortgage interest
- −$8,402
- − Property taxes
- −$335
- − Insurance
- −$750
- − Repairs & maintenance
- −$2,045
- − Management
- −$2,045
- − Depreciation
- −$4,364
- Taxable income
- $7,624
- Est. tax owed @ 24.0%
- −$1,830
- After-tax cash flow
- $7,843/yr
For passive investors: Depreciation is non-cash, so a rental often shows a tax loss while cash-flowing — sheltering income. Rental losses are passive: they offset passive income freely, and up to $25,000/yr can offset ordinary (W-2) income if you actively participate and your MAGI is under $100k (phasing out to $0 by $150k); unused losses carry forward. On sale, claimed depreciation is recaptured at up to 25%, and gains may owe capital-gains tax (a 1031 exchange can defer both). Figures are a year-1 estimate at your 24.0% rate — not tax advice; consult a CPA.
Schools (NCES district)
- District
- Columbus ISD
- NCES district ID
- 4814700
- Math proficiency
- 34% ▼ -20.00%
- Reading proficiency
- 34% ▼ -8.00%
- Median HH income
- $46,130
- Composite
- 29.16/100
- National rank
- #6578
- State rank
- #531 of 826 in TX
Livability — Columbus
- Score
- 71/100
- State rank
- #295
- US rank
- #6751
Category grades
Schools grade is shown separately in the Schools card above.
Census & demographics
- City population
- 6,833
- Population (ZIP)
- 650
Population outlook (Colorado County) Hauer SSP2
- Today (2025)
- 20,932 people
- By 2030
- 20,803 · -0.6%
- By 2040
- 20,518 · -2.0%
- By 2050
- 20,325 · -2.9%
- By 2075
- 20,086 · -4.0%
- By 2100
- 18,228 · -12.9%
Race, ethnicity, and origin ACS 2023
- Neighborhood character
- Majority White (62%)
- Race & ethnicity
- White 62% Hispanic / Latino 31% Native American 8% Black 4% Two or more races 3%
- Hispanic origin (detail)
- Mexican 29%
- Common ancestry
- Serbian 4% Lithuanian 3% Slovak 2%
- Foreign-born
- 21% · Canada
- Languages at home
- 86% English-only · Spanish 14%
Political lean MEDSL · Colorado
- 2024 margin
- Solid R (+57.2) · D 21.1% · R 78.3%
- 2008→2024 swing
- -17.9pp toward R · 2008: -39.4pp · 2024: -57.2pp
- All cycles
- 2024: R+57.2 2020: R+50.6 2016: R+51.2 2012: R+49.3 2008: R+39.4
Not yet ingested
- Civics
- —
Market trends
- HPI YoY
- ▼ -0.64%
- Current HPI
- 104.2278
- Rent YoY
- —
- Metro
- —
- State GDP YoY
- ▲ 3.95%
- F500 in state
- 110
Industry mix (Fortune 500 HQ in TX)
| Industry | F500 HQs | Revenue |
|---|---|---|
| Energy | 16 | $1,198B |
|
||
| Technology | 5 | $198B |
|
||
| Engineering / Construction | 4 | $72B |
|
||
| Energy Services | 3 | $60B |
|
||
| Utilities | 3 | $41B |
|
||
| Healthcare | 2 | $330B |
|
||
Price history
+0.0% since first listed6 events — show timeline
- 2025-10-01 Listing Removed — HARMLS
- 2025-09-29 Listed $150,000 HARMLS
- 2025-09-29 Listing Removed — HARMLS
- 2025-09-29 Listed $150,000 HARMLS
- 2024-10-04 Listed $150,000 HARMLS
- 1992-11-15 Sold (Public Records) — Public Records
Property tax history
-2.1%/yrLatest (2025): $335 · +18.9% YoY. Source: county tax records.
Cash-flow waterfall
monthlySold comps — $/sqft
last 12 mo · ≤1 miLoading sold comps…