807 Beverly Dr · Raleigh, NC
Flood risk 1/10 · Minimal
- FEMA flood zone
- X (unshaded)
- Chance of flooding over 30 yrs
- 0.0%
- Est. flood insurance / yr
- $507 – $1,088
Fire risk 1/10 · Minimal
- Est. fire insurance / yr
- $906 – $1,684
Heat risk 6/10 · Moderate
- Hot days now (above 105°F)
- 7 days/yr
- Hot days in 30 yrs
- 17 days/yr
Wind risk 6/10 · Moderate
- Chance of severe wind over 30 yrs
- 66.0%
Air-quality risk 3/10 · Minor
- Unhealthy air days now
- 2 days/yr
- Unhealthy air days in 30 yrs
- 2 days/yr
Risk factors via First Street. Map © Google.
Why this score? — see what drove the D+ grade
The composite is a weighted blend of 9 inputs, each scored 0–100. Each bar is that input's sub-score; the figure is the points it added to the 100-point composite (weight × sub-score).
- ARV discount +15.0/15.0
- Cash flow +13.5/30.0
- Schools +4.9/10.0
- Livability +4.2/5.0
- DSCR +4.1/10.0
- 1% rule +3.0/10.0
- Rent growth +2.6/5.0
- Condition / age +2.5/5.0
- Appreciation +0.0/10.0
$222,000
🖨 Deal sheet (PDF) 📄 Offer letter ✓ Due diligence
Listing remarks
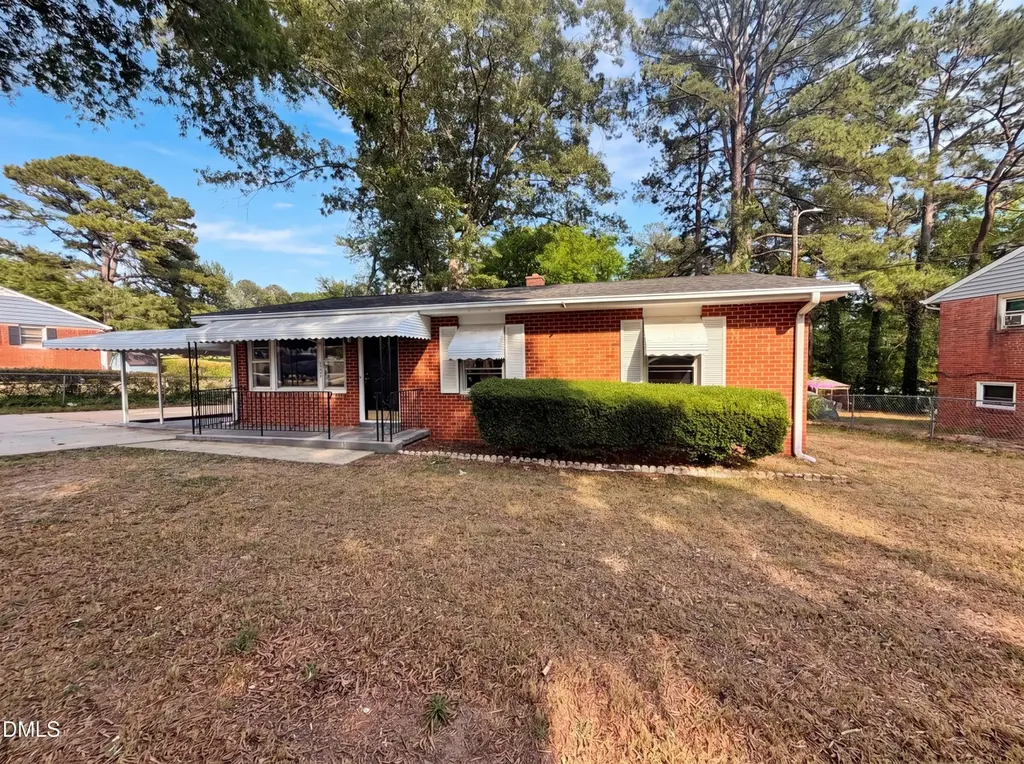
This ranch style home in Southeast Raleigh offers classic brick exterior and convenient one level living! This home is located in an established neighborhood with no HOA! Situated on a spacious lot with carport parking, this home features a functional layout with bright living spaces and plenty of potential to make it your own. Enjoy easy access to Downtown Raleigh, shopping, dining, parks, and major highways. Great opportunity for first-time buyers, investors, or anyone looking for a centrally located property with room to personalize.
Key facts
- Brick exterior
- Bright living spaces
- Carport parking
Tags
Property features AI
Finance
- Other: Lot size about 0.22 acres
- HOA & community: No association; Not a senior community
Exterior
- Parking: Driveway parking
- Utilities: Public water; Public sewer
- Home design: Single-story house
- Construction: Brick construction; Brick/mortar foundation; Shingle roof; Built as a house
- Exterior features: Publicly maintained road access; Driveway
Interior
- Kitchen: Range
- Bedrooms: Three bedrooms (all on the main level)
- Flooring: Other flooring
- Bathrooms: One full bathroom
- Heating & cooling: Natural gas heating; Central air conditioning
- Interior features: Bathtub/shower combination; Eat-in kitchen; Kitchen and dining area combined
Neighborhood map
What this means for you Summary
Snapshot
- This is a 3-bed/1.0-bath single-family listed at $222k.
Deal economics
- At list price, monthly cash flow is $8 ($94/yr) — positive.
- The deal already cash-flows at list — no discount required.
- To meet the 1% rule (rent ≥ 1% of price), the offer needs to be $178k (20.0% below list).
- Recommended offer: $178k (20.0% below list) — sets the bar for 1% rule.
- Cap rate 6.3% vs local median 2.7% in Raleigh — top-decile yield for the area; either an underpriced asset or a hidden risk that comps aren't pricing in. Stress-test before assuming the spread holds.
Location & tenants
- Location reads 83/100 on livability (#10 in NC, #1,028 nationally) — a professional / high-income tenant draw. Strengths: amenities A+, commute A+, housing A+; Watch: crime F.
- Wake County Schools (suburban): math 52% / reading 60% proficiency, ranked #35 of 178 in NC (top 20%) — acceptable for families but not a draw, mixed tenant base, ~2y average lease.
- Zoned schools: North Ridge Elementary (math 45% / reading 53%, grade D, #459 of 1,410 statewide, top 33%, 708 students, 40% FRL); West Millbrook Middle (math 43% / reading 54%, grade C-, #127 of 475 statewide, top 28%, 1,046 students, 40% FRL); Enloe High (math 64% / reading 75%, grade B, #121 of 535 statewide, top 24%, 2,502 students, 27% FRL).
- Market conditions: Rents flat; 594 active listings in the ZIP; 30 comparable units currently listed for rent nearby; rentals at typical pace (median 22d on market — plan ~3-4 weeks tenant-placement turnaround); 15,249 units permitted in Wake County in 2024 (5,568 in 5+ unit buildings).
- This rent runs 31% of the median local income ($68k/yr) — at the standard rent-burdened threshold; future hikes will face affordability resistance.
Forward outlook
- Local home prices are declining (-3.0%/yr); year-one equity from $2k of loan paydown is wiped out by about $7k of value loss. Plan a longer hold.
- Wake County population projected at +51% by 2050 — long-run rental-demand tailwind backs the buy-and-hold thesis.
Negotiation context
- Only 6 days on market — expect competitive offers; lowballing is unlikely to land.
- Current owner paid $25k; list at $222k implies a 788% gain — meaningful room to come down on a strong offer.
Risks & watch-outs
- Watch-outs: built in 1959 — expect roof / HVAC / electrical / plumbing capex.
- Climate carrying-cost: major wind risk, 66% chance of damaging wind over 30y; extreme-heat days projected 7→17/yr by 2055 (HVAC capex compounding) — expect insurance premiums to compound above CPI over the hold.
Questions for the listing agent
- Built in 1959 — when were the roof, HVAC, electrical panel, plumbing, and water heater last replaced?
- Is there a deadline driving the sale (1031 exchange, divorce, estate, relocation)? That informs how much negotiation room exists.
- Schools are B-rated — typically a magnet for longer-tenancy family renters. What's the average tenant stay here, and is there a school-zone premium baked into asking?
- Crime grade is F in this area — have there been break-ins, vandalism, or insurance claims at this property in the last 3 years? What carrier currently insures it and at what premium?
- The area grade is low — what's the realistic commute time and amenity access for the typical tenant pool here? Any planned neighborhood developments (good or bad) we should know about?
- What's the average days-on-market for RENTAL listings here right now (not sales)? A rising rental-DOM trend means longer vacancies and softer asking-rent achievability than the comps imply.
- What's the recent tenant-quality profile in this submarket — average credit score on applications, eviction rate, late-payment / NSF rate, and stable-employment percentage? A property-management company in the area should have these aggregated.
- How much new for-sale + rental construction is in the pipeline within 1–3 miles? Heavy new supply typically softens prices + rents 12–24 months out; constrained supply supports both.
Investment metrics
- 1% rule
- 0.80% ✗
- Cap rate
- 6.34%
- Cash-on-cash
- 0.15%
- DSCR
- 1.01
- GRM
- 10.4
CMA / ARV
- ARV (on-the-fly)
- $278,000
- Comps found
- 4
Show comp detail 4 sales within ~0.75 mi
| Address | Dist | Beds/Ba | Sqft | Sold | Price | $/sf | Match |
|---|---|---|---|---|---|---|---|
| 917 Carlisle St | 0.29mi | 3/2.0 | 1,032 (+3%) | 1mo | $307,000 | $297 | 76 |
| 833 Brigham Rd | 0.66mi | 3/2.0 | 1,123 (+12%) | 10mo | $308,000 | $274 | 36 |
| 912 Cooper Rd | 0.46mi | 3/2.0 | 1,150 (+15%) | 22mo | $286,000 | $249 | 31 |
| 804 Brigham Rd | 0.67mi | 3/2.0 | 1,134 (+13%) | 19mo | $315,000 | $278 | 27 |
Match score weights: distance 35% · size 25% · config 20% · recency 20%. Top-matched comps best support the ARV.
Projected returns pro-forma
-3.0% appreciation · 0.2% rent growth · sell at horizon
- IRR
- -19.0%
- Equity multiple
- 0.35×
- Total profit
- $-40,400
- Equity at exit
- $33,101
- IRR
- -17.9%
- Equity multiple
- 0.14×
- Total profit
- $-53,661
- Equity at exit
- $19,195
Cash invested: $62,160 (down + closing). Projections, not guarantees.
Landlord ↔ Tenant lean methodology
- Overall (STATE)
- 85 Strongly Landlord-Friendly
- State North Carolina
- 85 Strongly Landlord-Friendly · R+3
- County
- — inherits STATE
- City
- — inherits STATE
ZIP-level market 27610
- Rents YoY
- 0.2%
- Active inventory
- 594
- Price-to-rent
- 10.4×
Monthly cashflow live
- Estimated rent
- $1,776 high interval (Pro) →
- Mortgage (P&I)
- −$1,164
- Tax from tax record
- −$139 /mo · $1,665/yr
- Insurance
- −$92
- HOA
- −$0
- Vacancy / Maint / Mgmt
- −$373
- Net cashflow
- $8
Break-even live
Sensitivity live
| Price | -10% $134 | -5% $71 | +0% $8 | +5% $-55 | +10% $-118 |
|---|---|---|---|---|---|
| Rent | -10% $-132 | -5% $-62 | +0% $8 | +5% $78 | +10% $148 |
| Rate | -1.0pp $120 | -0.5pp $64 | base $8 | +0.5pp $-50 | +1.0pp $-108 |
UW: 25.0% down · 7.5% · 30yr · 1.5% tax · 5.0% vac · 8.0% maint · 8.0% mgmt
Financing live
Cash to close
- Down payment
- $55,500
- Closing costs
- $6,660
- Reserves months
- —
- Total cash needed
- —
Loan-product check · same deal, 3 products live
Conventional
25% down · 7.5% · 30yr
- Down + closing
- —
- Monthly P&I
- —
- Monthly cashflow
- —
- DSCR
- —
- Eligible?
- —
Personal DTI + credit; lowest rate.
DSCR
20% down · 8.5% · 30yr
- Down + closing
- —
- Monthly P&I
- —
- Monthly cashflow
- —
- DSCR
- —
- Eligible?
- —
No personal income docs; deal must DSCR.
Hard money
10% down · 12.0% · 12mo
- Down + closing
- —
- Monthly P&I
- —
- Monthly cashflow
- —
- DSCR
- —
- Eligible?
- —
Short-term bridge; refi at stabilization.
Rent comps 30 comps
| Address | Beds | Baths | Sqft | Rent | $/sqft | DOM | Units | Dist |
|---|---|---|---|---|---|---|---|---|
| 825 Rawls Dr Raleigh, NC | 3.0 | 2.0 | 1500 | $1,845 | $1.23 | 14d | 1 | 0.45mi |
| 825 Rawls Dr Raleigh, NC | 3.0 | 2.0 | 1500 | $1,845 | $1.23 | 22d | 1 | 0.45mi |
| 709 Glenbrook Dr Raleigh, NC | 3.0 | 1.0 | 1185 | $1,550 | $1.31 | 25d | 1 | 0.48mi |
| 3108 Woodpecker Ct Raleigh, NC | 2.0 | 2.0 | 934 | $1,400 | $1.50 | 22d | 1 | 0.50mi |
| 2804 Donovan Pl Raleigh, NC | 3.0 | 1.5 | 1125 | $1,697 | $1.51 | 14d | 1 | 0.56mi |
| 312 Dacian Rd Raleigh, NC | 2.0 | 2.0 | 1000 | $1,345 | $1.34 | 25d | 1 | 0.60mi |
| 308 Dacian Rd Raleigh, NC | 2.0 | 2.0 | 1000 | $1,345 | $1.34 | 6d | 1 | 0.62mi |
| 308 Dacian Rd Apt B Raleigh, NC | 2.0 | 2.0 | 1000 | $1,345 | $1.34 | 25d | 1 | 0.62mi |
| 308 Dacian Rd Raleigh, NC | 2.0 | 2.0 | 1000 | $1,345 | $1.34 | 22d | 1 | 0.62mi |
| 832 Brigham Rd Raleigh, NC | 3.0 | 1.5 | 1107 | $1,595 | $1.44 | 25d | 1 | 0.68mi |
| 713 Grantland Dr Raleigh, NC | 3.0 | 3.0 | 1323 | $1,995 | $1.51 | 19d | 1 | 0.71mi |
| 802 Star Ridge Dr Raleigh, NC | 3.0 | 2.5 | 1447 | $1,800 | $1.24 | 18d | 1 | 0.81mi |
| 838 Oak Center Dr Raleigh, NC | 3.0 | 2.5 | 1463 | $1,995 | $1.36 | 25d | 1 | 0.85mi |
| 804 Oak Center Dr Raleigh, NC | 3.0 | 2.5 | 1447 | $1,900 | $1.31 | 21d | 1 | 0.87mi |
| 3369 Bridgeville Rd Raleigh, NC | 3.0 | 2.5 | 1200 | $1,699 | $1.42 | 6d | 1 | 0.88mi |
| 503 Erie Rd Unit 503 Raleigh, NC | 3.0 | 2.5 | 1470 | $1,650 | $1.12 | 16d | 1 | 0.91mi |
| 305 Kennedy St Raleigh, NC | 2.0 | 1.0 | 759 | $895 | $1.18 | 25d | 1 | 0.99mi |
| 1611 Royal Foxhound Ln Raleigh, NC | 2.0–4.0 | 2.0 | 1214 | $1,597 | $1.32 | 3d | 31 | 1.00mi |
| 2012 Winston Diamond Ct Raleigh, NC | 3.0 | 2.5 | 1369 | $1,830 | $1.34 | 25d | 1 | 1.06mi |
| 460 Dickens Dr Raleigh, NC | 3.0 | 2.0 | 1422 | $1,950 | $1.37 | 12d | 1 | 1.08mi |
| 1729 Dallas St Raleigh, NC | 2.0 | 1.0 | 783 | $1,375 | $1.76 | 25d | 1 | 1.12mi |
| 1701 E Lenoir St Raleigh, NC | 3.0 | 2.0 | 1100 | $2,900 | $2.64 | 25d | 1 | 1.14mi |
| 212 N Peartree Ln Raleigh, NC | 3.0 | 1.5 | 1379 | $1,545 | $1.12 | 22d | 1 | 1.22mi |
| 2321 Stoney Spring Dr Raleigh, NC | 1.0–2.0 | 1.0–2.0 | 879 | $1,541 | $1.75 | 3d | 103 | 1.27mi |
| 1622 Proctor Rd Raleigh, NC | 2.0–3.0 | 1.0 | 829 | $1,505 | $1.81 | 5d | 6 | 1.34mi |
| 717 Vardaman St Raleigh, NC | 2.0 | 1.0 | 824 | $1,225 | $1.49 | 25d | 1 | 1.38mi |
| 801 Vardaman St Raleigh, NC | 2.0 | 1.0 | 824 | $1,210 | $1.47 | 25d | 1 | 1.39mi |
| 2411 Aurora Cove Ct Raleigh, NC | 1.0–3.0 | 1.0–2.0 | 1001 | $1,952 | $1.95 | 3d | 12 | 1.39mi |
| 737 Southgate Dr Raleigh, NC | 3.0 | 2.5 | 1332 | $1,845 | $1.39 | 6d | 1 | 1.46mi |
| 3105 Holston Ln Raleigh, NC | 1.0–2.0 | 1.0 | 745 | $1,245 | $1.67 | 4d | 122 | 1.49mi |
Listing history 6 events
-
2026-06-02status $222,000 Pending 6 DOM
-
2026-06-01days on market $222,000 Active 6 DOM
-
2026-05-31days on market $222,000 Active 5 DOM
-
2026-05-26$222,000 Active
-
1977-09-29soldstatus $25,000
-
1977-06-13soldstatus $25,000
ⓘ Source: listings_history table (triggers on properties + properties_extension) + one-shot
backfill from property_details.listing_events for pre-trigger history.
Tax reassessment forecast NC · Resets to sale price
- Current annual tax
- $1,665 · $139/mo
- Projected year-2 tax
- $1,820 · $152/mo
- Expected delta
- +$155/yr (+$13/mo · 9.3%)
ⓘ Screening estimate from a state-policy table — verify with the county assessor before closing.
Climate risk First Street
- Flood 1/10 Low FEMA zone X (unshaded) · 0% chance over 30 yrs
- Wildfire 1/10 Low
- Heat 6/10 Major 7 d/yr ≥105°F today · 17 d/yr by 30 yrs out
- Wind 6/10 Major 66% chance of damaging wind over 30 yrs
- Air quality 3/10 Moderate 2 unhealthy d/yr today · 2 by 30 yrs out
Nearby sold comps map
Loading sold comps map…
Walkable amenities ~0.75 mi
Loading nearby amenities…
Taxation est. · year 1
- Rental income
- $21,316
- − Mortgage interest
- −$12,435
- − Property taxes
- −$1,665
- − Insurance
- −$1,110
- − Repairs & maintenance
- −$1,705
- − Management
- −$1,705
- − Depreciation
- −$6,458
- Taxable loss
- −$3,763
- Est. tax savings @ 24.0%
- +$903
- After-tax cash flow
- $997/yr
For passive investors: Depreciation is non-cash, so a rental often shows a tax loss while cash-flowing — sheltering income. Rental losses are passive: they offset passive income freely, and up to $25,000/yr can offset ordinary (W-2) income if you actively participate and your MAGI is under $100k (phasing out to $0 by $150k); unused losses carry forward. On sale, claimed depreciation is recaptured at up to 25%, and gains may owe capital-gains tax (a 1031 exchange can defer both). Figures are a year-1 estimate at your 24.0% rate — not tax advice; consult a CPA.
Schools (NCES district)
- District
- Wake County Schools
- NCES district ID
- 3704720
- Math proficiency
- 52% ▲ 2.00%
- Reading proficiency
- 60% ▲ 4.00%
- Median HH income
- $67,509
- Composite
- 49.41/100
- National rank
- #2010
- State rank
- #35 of 178 in NC
Livability — Raleigh
- Score
- 83/100
- State rank
- #10
- US rank
- #1028
Category grades
Schools grade is shown separately in the Schools card above.
Census & demographics
- Census place
- Raleigh, NC
- County
- Wake County · 1,216,256 people
- City population
- 569,344
- Metro
- Raleigh-Cary, NC
- Population (ZIP)
- 81,419
- Household income
- $67,932
- Rent vs Own
- Severe rent burden
- 3499.0
Population outlook (Wake County) Hauer SSP2
- Today (2025)
- 1,293,152 people
- By 2030
- 1,428,223 · +10.4%
- By 2040
- 1,698,188 · +31.3%
- By 2050
- 1,955,807 · +51.2%
- By 2075
- 2,520,273 · +94.9%
- By 2100
- 2,893,335 · +123.7%
Race, ethnicity, and origin ACS 2023
- Neighborhood character
- Diverse neighborhood (Simpson 0.59)
- Race & ethnicity
- Black 59% Hispanic / Latino 20% White 15% Two or more races 8% Asian 1%
- Hispanic origin (detail)
- Mexican 10% Puerto Rican 1% Dominican 1%
- Common ancestry
- Lithuanian 1% Slovak 1% Serbian 1%
- Foreign-born
- 14% · Canada
- Languages at home
- 77% English-only · Spanish 18% Arabic 1% French/Haitian/Cajun 1%
Political lean MEDSL · Wake
- 2024 margin
- Strong D (+25.5) · D 61.9% · R 36.4% · Other 1.7%
- 2008→2024 swing
- +11.1pp toward D · 2008: 14.4pp · 2024: 25.5pp
- All cycles
- 2024: D+25.5 2020: D+26.4 2016: D+20.5 2012: D+10.2 2008: D+14.4
Not yet ingested
- Civics
- —
Market trends
- HPI YoY
- ▼ -131.88%
- Current HPI
- 237.704
- Rent YoY
- ▲ 0.20%
- Metro
- Raleigh-Cary, NC
- State GDP YoY
- ▲ 3.28%
- F500 in state
- 26
Industry mix (Fortune 500 HQ in NC)
| Industry | F500 HQs | Revenue |
|---|---|---|
| Financial Services | 2 | $213B |
|
||
| Retail | 2 | $95B |
|
||
| Industrial Conglomerate | 1 | $38B |
|
||
| Metals / Steel | 1 | $35B |
|
||
| Utilities | 1 | $30B |
|
||
| Industrial Machinery | 1 | $19B |
|
||
Price history
+788.0% since first listed3 events — show timeline
- 2026-05-26 Listed $222,000 TMLS
- 1977-09-29 Sold (Public Records) $25,000 Public Records
- 1977-06-13 Sold (Public Records) $25,000 Public Records
Property tax history
+4.5%/yrLatest (2025): $1,665 · +0.4% YoY. Source: county tax records.
Cash-flow waterfall
monthlySold comps — $/sqft
last 12 mo · ≤1 miLoading sold comps…