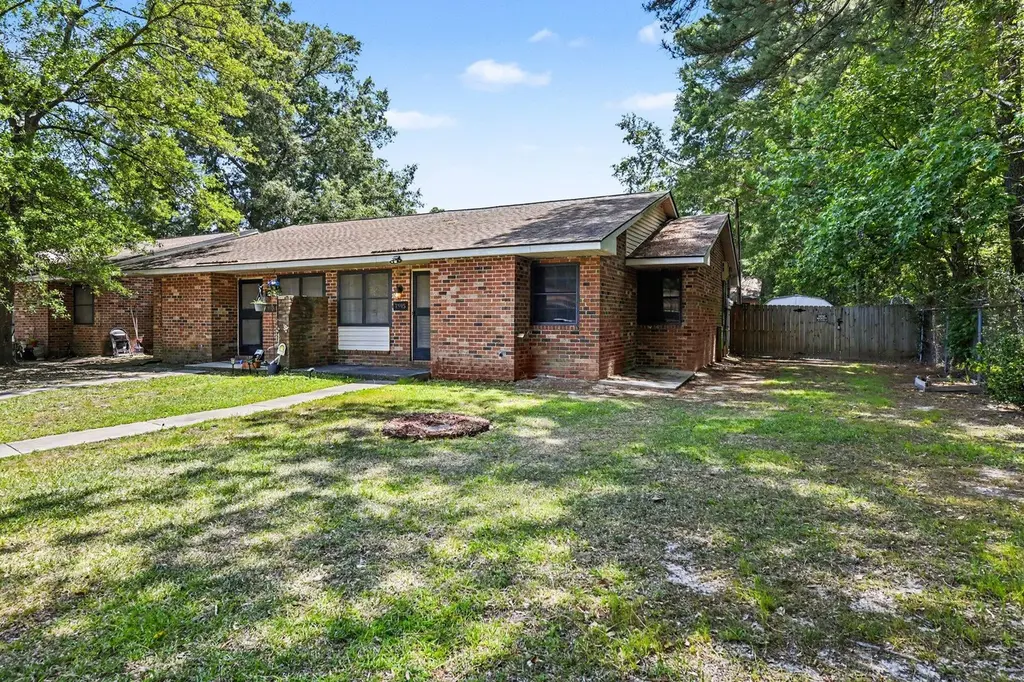
7915 Cider Ct · North Charleston, SC
Flood risk 1/10 · Minimal
- FEMA flood zone
- X (unshaded)
- Chance of flooding over 30 yrs
- 0.0%
- Est. flood insurance / yr
- $507 – $1,088
Fire risk 3/10 · Minor
- Est. fire insurance / yr
- $783 – $1,453
Heat risk 9/10 · Severe
- Hot days now (above 107°F)
- 7 days/yr
- Hot days in 30 yrs
- 17 days/yr
Wind risk 8/10 · Major
- Chance of severe wind over 30 yrs
- 99.0%
Air-quality risk 2/10 · Minimal
- Unhealthy air days now
- 2 days/yr
- Unhealthy air days in 30 yrs
- 2 days/yr
Risk factors via First Street. Map © Google.
Why this score? — see what drove the D+ grade
The composite is a weighted blend of 9 inputs, each scored 0–100. Each bar is that input's sub-score; the figure is the points it added to the 100-point composite (weight × sub-score).
- Cash flow +18.1/30.0
- DSCR +5.7/10.0
- 1% rule +4.9/10.0
- Schools +4.3/10.0
- ARV discount +3.3/15.0
- Livability +3.3/5.0
- Rent growth +3.0/5.0
- Condition / age +2.5/5.0
- Appreciation +0.0/10.0
$199,000
🖨 Deal sheet 📄 Offer letter ✓ Due diligence
Listing remarks
Location, location, location! Spacious end-unit brick townhome conveniently located just minutes from I-26, Ashley Phosphate, and the new Weber Blvd exit. This desirable corner-unit home offers added privacy with a fenced rear yard and wooded buffer on the right side. Enjoy outdoor living and extra storage with both a rear-yard shed and exterior storage closet. Brick exterior construction, low-maintenance living, and a prime location close to shopping, dining, and major commuter routes make this property a must-see! Use seller's preferred lender to buy this home and receive an incentive towards your closing costs or rate buydown. Book your showing today!
Key facts
- Wooded buffer
- Rear-yard shed
- Prime location
Tags
Property features AI
Finance
- HOA & community: No association fee; Community park; Community trash service
Exterior
- Parking: Off-street parking
- Utilities: Public sewer; Charleston Water Service; Dominion Energy
- Home design: Single-family attached (townhouse); One story; Ground-level entry; Fee simple ownership
- Construction: Townhouse construction
- Exterior features: Asphalt roof; Shed(s); Located on a cul-de-sac; Lot under 0.5 acre
Interior
- Kitchen: Dishwasher; Electric range/oven; Refrigerator
- Bedrooms: 3 bedrooms (master bedroom on lower level)
- Flooring: Carpet; Vinyl
- Bathrooms: 2 total bathrooms (1 full, 1 half)
- Heating & cooling: Electric heating; Central air conditioning
- Interior features: Blown ceiling insulation; Eat-in kitchen; Family room
- Laundry & utility: Washer hookup; Electric dryer hookup
Neighborhood map
What this means for you Summary
Snapshot
- This is a 3-bed/2.0-bath townhouse listed at $199k.
Deal economics
- At list price, monthly cash flow is $176 ($2k/yr) — positive.
- The deal already cash-flows at list — no discount required.
- To meet the 1% rule (rent ≥ 1% of price), the offer needs to be $196k (1.3% below list).
- Recommended offer: $193k (3.0% below list) — sets the bar for market timing.
- Cap rate 7.4% vs local median 4.0% in North Charleston — top-decile yield for the area; either an underpriced asset or a hidden risk that comps aren't pricing in. Stress-test before assuming the spread holds.
Location & tenants
- Location reads 66/100 on livability (#122 in SC) — a middle-class / working-renter tenant base. Strengths: housing A+, health & safety A+, cost of living A; Watch: employment C-, crime F, amenities F.
- Charleston 01 (urban): math 48% / reading 53% proficiency, ranked #7 of 80 in SC (top 9%) — acceptable for families but not a draw, mixed tenant base, ~2y average lease.
- Zoned schools: Northwoods Middle (math 11% / reading 16%, grade F, #207 of 229 statewide, top 91%, 738 students, 100% FRL); Rb Stall High (math 49% / reading 63%, grade C, #126 of 196 statewide, top 65%, 1,952 students, 100% FRL) — zoned schools average 100% FRL vs 44% district-wide (56 pts higher); higher-poverty schools than district average — tighter screening recommended.
- Zoned-school proficiency averages 35% at this address vs 50% district-wide (-16 pts) — the specific schools serving this property underperform the Charleston 01 average; the district grade overstates school quality for this exact location.
- Market conditions: Rents rising (+1.8%/yr); 129 active listings in the ZIP; 27 comparable units currently listed for rent nearby; rentals at typical pace (median 14d on market — plan ~3-4 weeks tenant-placement turnaround); 4,156 units permitted in Charleston County in 2024 (857 in 5+ unit buildings).
- This rent runs 32% of the median local income ($73k/yr) — at the standard rent-burdened threshold; future hikes will face affordability resistance.
Forward outlook
- Local home prices are declining (-3.0%/yr); year-one equity from $1k of loan paydown is wiped out by about $6k of value loss. Plan a longer hold.
- Charleston County population projected at +44% by 2050 — long-run rental-demand tailwind backs the buy-and-hold thesis.
Negotiation context
- It's been on market 31 days — a 3% lower offer ($193k) is reasonable based on typical stale-listing flexibility.
- Current owner paid $80k; list at $199k implies a 149% gain — meaningful room to come down on a strong offer.
Risks & watch-outs
- Climate carrying-cost: severe wind risk, 99% chance of damaging wind over 30y; extreme-heat days projected 7→17/yr by 2055 (HVAC capex compounding) — expect insurance premiums to compound above CPI over the hold.
Questions for the listing agent
- It's been on market 31 days. Have you received any prior offers? Is the seller open to a 3% concession, seller financing, or rate buy-down credit?
- Is there a deadline driving the sale (1031 exchange, divorce, estate, relocation)? That informs how much negotiation room exists.
- Crime grade is F in this area — have there been break-ins, vandalism, or insurance claims at this property in the last 3 years? What carrier currently insures it and at what premium?
- The area grade is low — what's the realistic commute time and amenity access for the typical tenant pool here? Any planned neighborhood developments (good or bad) we should know about?
- What's the average days-on-market for RENTAL listings here right now (not sales)? A rising rental-DOM trend means longer vacancies and softer asking-rent achievability than the comps imply.
- What's the recent tenant-quality profile in this submarket — average credit score on applications, eviction rate, late-payment / NSF rate, and stable-employment percentage? A property-management company in the area should have these aggregated.
- How much new for-sale + rental construction is in the pipeline within 1–3 miles? Heavy new supply typically softens prices + rents 12–24 months out; constrained supply supports both.
Investment metrics
- 1% rule
- 0.99% ✗
- Cap rate
- 7.35%
- Cash-on-cash
- 3.79%
- DSCR
- 1.17
- GRM
- 8.4
CMA / ARV
- ARV (on-the-fly)
- $182,160
- Comps found
- 12
Show comp detail 12 sales within ~0.75 mi
| Address | Dist | Beds/Ba | Sqft | Sold | Price | $/sf | Match |
|---|---|---|---|---|---|---|---|
| 2757 Oak Leaf Drive Dr | 0.10mi | 3/1.5 | 1,028 (-1%) | 20mo | $175,000 | $170 | 76 |
| 7911 Ebony Court Ct | 0.10mi | 3/1.5 | 1,014 (-2%) | 18mo | $178,700 | $176 | 75 |
| 7914 Dutch Ct | 0.02mi | 3/1.5 | 1,147 (+11%) | 11mo | $185,000 | $161 | 70 |
| 7910 Ebony Ct | 0.07mi | 3/1.0 | 988 (-4%) | 20mo | $170,000 | $172 | 68 |
| 8097 Shadow Oak Dr | 0.62mi | 2/2.5 (-1) | 1,063 (+3%) | 2mo | $174,000 | $164 | 58 |
| 8156 Shadow Oak Dr | 0.62mi | 2/1.5 (-1) | 998 (-4%) | 1mo | $212,000 | $212 | 57 |
| 7965 Shadow Oak Dr | 0.72mi | 2/1.5 (-1) | 1,043 (+1%) | 2mo | $197,000 | $189 | 57 |
| 8059 Shadow Oak Dr | 0.61mi | 2/2.0 (-1) | 1,092 (+6%) | 1mo | $197,000 | $180 | 57 |
| 2447 Woodstock Ave | 0.56mi | 2/1.5 (-1) | 1,114 (+8%) | 5mo | $190,000 | $171 | 50 |
| 8056 Thelen St | 0.61mi | 2/1.5 (-1) | 1,114 (+8%) | 7mo | $192,500 | $173 | 46 |
| 8100 Shadow Oak Dr | 0.62mi | 2/2.5 (-1) | 1,063 (+3%) | 18mo | $219,975 | $207 | 45 |
| 8048 Shadow Oak Dr | 0.65mi | 2/2.0 (-1) | 1,092 (+6%) | 15mo | $225,000 | $206 | 43 |
Match score weights: distance 35% · size 25% · config 20% · recency 20%. Top-matched comps best support the ARV.
Projected returns pro-forma
-3.0% appreciation · 1.83% rent growth · sell at horizon
- IRR
- -11.7%
- Equity multiple
- 0.58×
- Total profit
- $-23,304
- Equity at exit
- $29,672
- IRR
- -4.3%
- Equity multiple
- 0.73×
- Total profit
- $-14,910
- Equity at exit
- $17,206
Cash invested: $55,720 (down + closing). Projections, not guarantees.
Landlord ↔ Tenant lean methodology
- Overall (STATE)
- 90 Strongly Landlord-Friendly
- State South Carolina
- 90 Strongly Landlord-Friendly · R+6
- County
- — inherits STATE
- City
- — inherits STATE
ZIP-level market 29420
- Home prices YoY
- -14.6%
- Rents YoY
- 1.8%
- Active inventory
- 129
- Price-to-rent
- 8.4×
Monthly cashflow live
- Estimated rent
- $1,963 high interval (Pro) →
- Mortgage (P&I)
- −$1,044
- Tax est. 1.5%
- −$249 /mo · $2,985/yr
- Insurance
- −$83
- HOA
- −$0
- Vacancy / Maint / Mgmt
- −$412
- Net cashflow
- $176
Break-even live
UW: 25.0% down · 7.5% · 30yr · 1.5% tax · 5.0% vac · 8.0% maint · 8.0% mgmt
Financing live
Cash to close
- Down payment
- $49,750
- Closing costs
- $5,970
- Reserves months
- —
- Total cash needed
- —
Loan-product check · same deal, 3 products live
Conventional
25% down · 7.5% · 30yr
- Down + closing
- —
- Monthly P&I
- —
- Monthly cashflow
- —
- DSCR
- —
- Eligible?
- —
Personal DTI + credit; lowest rate.
DSCR
20% down · 8.5% · 30yr
- Down + closing
- —
- Monthly P&I
- —
- Monthly cashflow
- —
- DSCR
- —
- Eligible?
- —
No personal income docs; deal must DSCR.
Hard money
10% down · 12.0% · 12mo
- Down + closing
- —
- Monthly P&I
- —
- Monthly cashflow
- —
- DSCR
- —
- Eligible?
- —
Short-term bridge; refi at stabilization.
Rent comps 27 comps
| Address | Beds | Baths | Sqft | Rent | $/sqft | DOM | Units | Dist |
|---|---|---|---|---|---|---|---|---|
| 7911 Angel Ct North Charleston, SC | 3.0 | 1.5 | 988 | $1,750 | $1.77 | 23d | 1 | 0.07mi |
| 3058 Nantuckett Ave North Charleston, SC | 3.0 | 2.0 | 1278 | $1,995 | $1.56 | 14d | 1 | 0.55mi |
| 2430 Woodstock Ave North Charleston, SC | 2.0 | 1.5 | 1100 | $1,350 | $1.23 | 2d | 1 | 0.56mi |
| 2422 Woodstock Ave North Charleston, SC | 2.0 | 1.5 | 1114 | $1,600 | $1.44 | 14d | 1 | 0.57mi |
| 8031 Hyannis Ct North Charleston, SC | 4.0 | 3.0 | 1500 | $2,150 | $1.43 | 18d | 1 | 0.58mi |
| 3001 Cypress Lake Rd North Charleston, SC | 1.0–3.0 | 1.0–2.5 | 1008 | $2,600 | $2.58 | 2d | 26 | 0.61mi |
| 8012 Thelen St North Charleston, SC | 2.0 | 1.5 | 1133 | $1,495 | $1.32 | 14d | 1 | 0.62mi |
| 2245 Greenridge Rd North Charleston, SC | 1.0–3.0 | 1.0–2.0 | 965 | $1,771 | $1.84 | 2d | 19 | 0.66mi |
| 3000 Cypress Lk Rd North Charleston, SC | 1.0–3.0 | 1.0–2.0 | 1121 | $2,343 | $2.09 | 2d | 29 | 0.75mi |
| 7940 Shadow Oak Dr Charleston, SC | 3.0 | 2.5 | 1287 | $1,895 | $1.47 | 14d | 1 | 0.78mi |
| 2225 Greenridge Rd North Charleston, SC | 1.0–2.0 | 1.0–2.0 | 817 | $1,579 | $1.93 | 2d | 14 | 0.82mi |
| 8524 Brookforest Dr Charleston, SC | 3.0 | 2.0 | 1244 | $3,249 | $2.61 | 23d | 1 | 0.84mi |
| 7927 Saint Ives Rd Charleston, SC | 1.0–3.0 | 1.0–2.0 | 969 | $1,731 | $1.79 | 2d | 26 | 0.89mi |
| 7925 St Ives Rd North Charleston, SC | 1.0–2.0 | 1.0–2.0 | 914 | $1,689 | $1.85 | 2d | 10 | 0.89mi |
| 8554 S Waccamaw Ct Charleston, SC | 3.0 | 2.0 | 1028 | $1,950 | $1.90 | 23d | 1 | 0.96mi |
| 2615 Warm Ave North Charleston, SC | 4.0 | 1.0 | 962 | $2,000 | $2.08 | 23d | 1 | 0.97mi |
| 8471 Yadkin Cir Unit M Charleston, SC | 3.0 | 2.5 | 1432 | $2,550 | $1.78 | 23d | 1 | 0.97mi |
| 8483 Yadkin Cir Unit D Charleston, SC | 3.0 | 2.0 | 1414 | $1,800 | $1.27 | 11d | 1 | 0.98mi |
| 3073 Brigham Ct North Charleston, SC | 3.0 | 2.0 | 1252 | $1,850 | $1.48 | 21d | 1 | 0.99mi |
| 3311 Mountainbrook Ave North Charleston, SC | 1.0–3.0 | 1.5 | 1204 | $1,749 | $1.45 | 2d | 12 | 1.28mi |
| 7782 Ginger Ln North Charleston, SC | 3.0 | 1.0 | 1300 | $3,680 | $2.83 | 2d | 1 | 1.28mi |
| 7774 Ginger Ln North Charleston, SC | 3.0 | 1.5 | 1093 | $2,250 | $2.06 | 21d | 1 | 1.31mi |
| 8755 Jenny Lind St Charleston, SC | 1.0–3.0 | 1.0–2.0 | 940 | $1,641 | $1.75 | 18d | 1 | 1.34mi |
| 21 Sabina Ct Hanahan, SC | 3.0 | 2.0 | 1400 | $2,800 | $2.00 | 14d | 1 | 1.35mi |
| 7677 Picardy Pl North Charleston, SC | 3.0 | 1.5 | 1300 | $2,500 | $1.92 | 23d | 1 | 1.36mi |
| 3360 Ashley Phosphate Rd North Charleston, SC | 2.0 | 1.5 | 1100 | $1,395 | $1.27 | 23d | 1 | 1.39mi |
| 7580 Plantation Rd North Charleston, SC | 2.0 | 1.0–2.0 | 870 | $2,251 | $2.59 | 2d | 38 | 1.49mi |
Listing history 15 events
-
2026-06-18days on market $199,000 Active 31 DOM
-
2026-06-17days on market $199,000 Active 30 DOM
-
2026-06-16days on market $199,000 Active 29 DOM
-
2026-06-15days on market $199,000 Active 28 DOM
-
2026-06-10days on market $199,000 Active 23 DOM
-
2026-06-09days on market $199,000 Active 22 DOM
-
2026-06-08days on market $199,000 Active 21 DOM
-
2026-06-07days on market $199,000 Active 20 DOM
-
2026-06-05days on market $199,000 Active 17 DOM
-
2026-06-03days on market $199,000 Active 16 DOM
-
2026-06-01days on market $199,000 Active 14 DOM
-
2026-05-31days on market $199,000 Active 13 DOM
-
2026-05-18$199,000 Active
-
2015-06-03soldstatus $80,000
-
2015-06-03soldstatus $80,000
ⓘ Source: listings_history table (triggers on properties + properties_extension) + one-shot
backfill from property_details.listing_events for pre-trigger history.
Climate risk First Street
- Flood 1/10 Low FEMA zone X (unshaded) · 0% chance over 30 yrs
- Wildfire 3/10 Moderate
- Heat 9/10 Extreme 7 d/yr ≥107°F today · 17 d/yr by 30 yrs out
- Wind 8/10 Severe 99% chance of damaging wind over 30 yrs
- Air quality 2/10 Low 2 unhealthy d/yr today · 2 by 30 yrs out
Nearby sold comps map
Loading sold comps map…
Walkable amenities ~0.75 mi
Loading nearby amenities…
Taxation est. · year 1
- Rental income
- $23,560
- − Mortgage interest
- −$11,147
- − Property taxes
- −$2,985
- − Insurance
- −$995
- − Repairs & maintenance
- −$1,885
- − Management
- −$1,885
- − Depreciation
- −$5,789
- Taxable loss
- −$1,125
- Est. tax savings @ 24.0%
- +$270
- After-tax cash flow
- $2,380/yr
For passive investors: Depreciation is non-cash, so a rental often shows a tax loss while cash-flowing — sheltering income. Rental losses are passive: they offset passive income freely, and up to $25,000/yr can offset ordinary (W-2) income if you actively participate and your MAGI is under $100k (phasing out to $0 by $150k); unused losses carry forward. On sale, claimed depreciation is recaptured at up to 25%, and gains may owe capital-gains tax (a 1031 exchange can defer both). Figures are a year-1 estimate at your 24.0% rate — not tax advice; consult a CPA.
Schools (NCES district)
- District
- Charleston 01
- NCES district ID
- 4501440
- Math proficiency
- 48% ▼ -2.00%
- Reading proficiency
- 53% ▬ 0.00%
- Median HH income
- $52,376
- Composite
- 43.41/100
- National rank
- #3018
- State rank
- #7 of 80 in SC
Livability — North Charleston
- Score
- 66/100
- State rank
- #122
- US rank
- #12222
Category grades
Schools grade is shown separately in the Schools card above.
Census & demographics
- Census place
- North Charleston, SC
- County
- Dorchester County · 182,866 people
- City population
- 108,266
- Metro
- Charleston-North Charleston, SC
- Population (ZIP)
- 23,959
- Household income
- $72,661
- Rent vs Own
- Severe rent burden
- 738.0
Population outlook (Charleston County) Hauer SSP2
- Today (2025)
- 480,562 people
- By 2030
- 525,921 · +9.4%
- By 2040
- 612,189 · +27.4%
- By 2050
- 691,627 · +43.9%
- By 2075
- 847,979 · +76.5%
- By 2100
- 926,482 · +92.8%
Race, ethnicity, and origin ACS 2023
- Neighborhood character
- Diverse neighborhood (Simpson 0.66)
- Race & ethnicity
- White 41% Black 39% Hispanic / Latino 11% Asian 5% Two or more races 3%
- Hispanic origin (detail)
- Mexican 6% Puerto Rican 1%
- Common ancestry
- Slovak 2% Italian 2% Lithuanian 1%
- Foreign-born
- 10% · Canada, China, Vietnam
- Languages at home
- 86% English-only · Spanish 10% Chinese 1% Other Asian/Pacific 1%
Political lean MEDSL · Charleston
- 2024 margin
- Lean D (+5.7) · D 51.9% · R 46.3% · Other 1.8%
- 2008→2024 swing
- -2.7pp toward R · 2008: 8.3pp · 2024: 5.7pp
- All cycles
- 2024: D+5.7 2020: D+12.9 2016: D+7.9 2012: D+2.4 2008: D+8.3
Not yet ingested
- Civics
- —
Market trends
- HPI YoY
- ▼ -46.51%
- Current HPI
- 271.2116
- Rent YoY
- ▲ 1.83%
- Metro
- Charleston-North Charleston, SC
- State GDP YoY
- ▲ 4.51%
- F500 in state
- 2
Industry mix (Fortune 500 HQ in SC)
| Industry | F500 HQs | Revenue |
|---|---|---|
| Packaging | 1 | $7B |
|
||
Price history
+148.8% since first listed3 events — show timeline
- 2026-05-18 Listed $199,000 Charleston Trident MLS
- 2015-06-03 Sold (Public Records) $80,000 Public Records
- 2015-06-03 Sold (Public Records) $80,000 Public Records
Property tax history
-19.1%/yrLatest (2022): $390 · -2.5% YoY. Source: county tax records.
Cash-flow waterfall
monthlySold comps — $/sqft
last 12 mo · ≤1 miLoading sold comps…