333 Rainbow Dr · Lakehills, TX
Flood risk 1/10 · Minimal
- FEMA flood zone
- X (unshaded)
- Chance of flooding over 30 yrs
- 0.0%
- Est. flood insurance / yr
- $507 – $1,088
Fire risk 4/10 · Minor
- Est. fire insurance / yr
- $1,222 – $2,270
Heat risk 7/10 · Major
- Hot days now (above 106°F)
- 7 days/yr
- Hot days in 30 yrs
- 22 days/yr
Wind risk 6/10 · Moderate
- Chance of severe wind over 30 yrs
- 66.0%
Air-quality risk 2/10 · Minimal
- Unhealthy air days now
- 0 days/yr
- Unhealthy air days in 30 yrs
- 1 days/yr
Risk factors via First Street. Map © Google.
Why this score? — see what drove the B- grade
The composite is a weighted blend of 9 inputs, each scored 0–100. Each bar is that input's sub-score; the figure is the points it added to the 100-point composite (weight × sub-score).
- Cash flow +30.0/30.0
- DSCR +10.0/10.0
- 1% rule +9.5/10.0
- ARV discount +7.5/15.0
- Schools +3.1/10.0
- Livability +3.1/5.0
- Rent growth +2.5/5.0
- Condition / age +2.5/5.0
- Appreciation +0.0/10.0
$119,500
🖨 Deal sheet 📄 Offer letter ✓ Due diligence
Listing remarks MLS
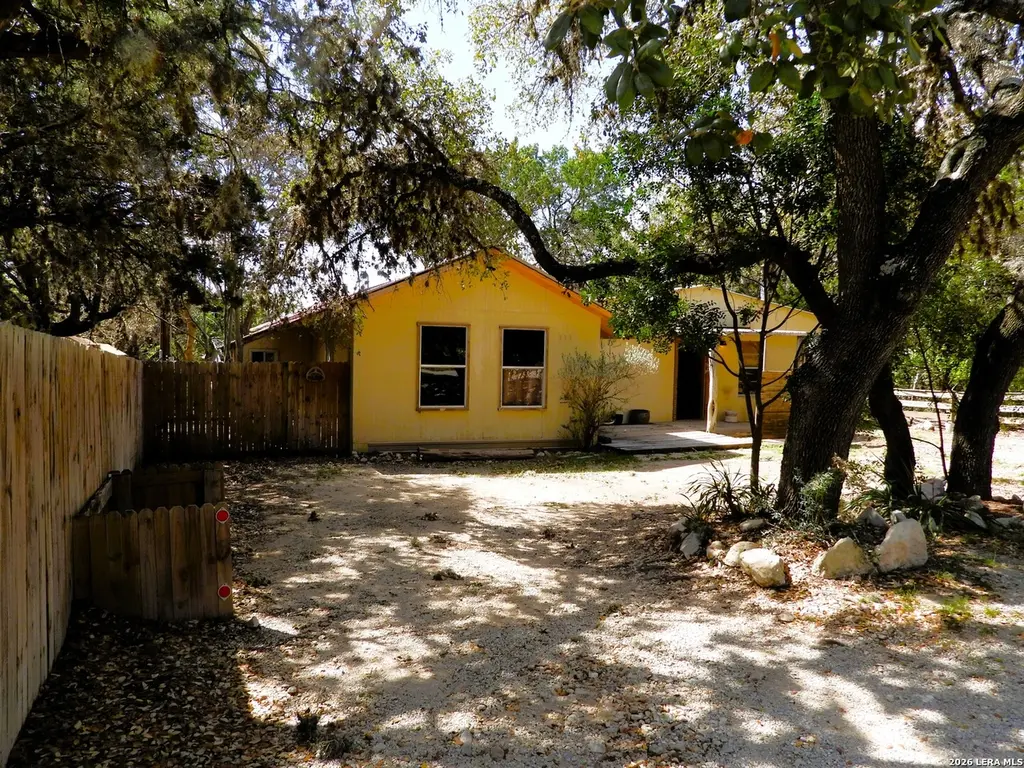
Handyman special with strong upside. Interior needs paint, new flooring, and an HVAC system, while key upgrades are already in place-including a metal roof, PEX plumbing, and updated electrical. The flexible floor plan offers potential for a separate mother-in-law suite or second living area. Situated on a lovely, level lot with a fenced backyard. Excellent investment opportunity with Medina Lake access through Pebble Beach POA parks.
Key facts
- Medina lake access
- Updated electrical
- Metal roof
Tags
Neighborhood map
What this means for you Summary
Snapshot
- This is a 3-bed/2.0-bath single-family listed at $120k.
Deal economics
- At list price, monthly cash flow is $519 ($6k/yr) — positive.
- The deal already cash-flows at list — no discount required.
- Meets the 1% rule at list price ($2k rent vs $120k).
- Recommended offer: $109k (9.0% below list) — sets the bar for market timing.
- Cap rate 11.5% vs local median 2.3% in Lakehills — top-decile yield for the area; either an underpriced asset or a hidden risk that comps aren't pricing in. Stress-test before assuming the spread holds.
Location & tenants
- Location reads 62/100 on livability (#963 in TX) — a middle-class / working-renter tenant base. Strengths: cost of living A+, housing A+, crime B+; Watch: schools D-, amenities F, commute F.
- Bandera ISD (rural): math 30% / reading 41% proficiency, ranked #500 of 826 in TX (top 60%) — families likely to look elsewhere, expect single-tenant / working-renter base with shorter leases.
- Market conditions: 267 active listings in the ZIP; 5 comparable units currently listed for rent nearby; rentals at typical pace (median 20d on market — plan ~3-4 weeks tenant-placement turnaround); 6 units permitted in Bandera County in 2024 (0 in 5+ unit buildings).
Forward outlook
- Local home prices are declining (-3.0%/yr); year-one equity from $826 of loan paydown is wiped out by about $4k of value loss. Plan a longer hold.
- At projected returns (-3.0% appreciation + 3.0% rent growth), your $33k cash investment doubles in ~7 years — after that, you're playing with house money.
Negotiation context
- It's been on market 92 days — a 9% lower offer ($109k) is reasonable based on typical stale-listing flexibility.
Risks & watch-outs
- Climate carrying-cost: major wind risk, 66% chance of damaging wind over 30y; extreme-heat days projected 7→22/yr by 2055 (HVAC capex compounding) — expect insurance premiums to compound above CPI over the hold.
Questions for the listing agent
- It's been on market 92 days. Have you received any prior offers? Is the seller open to a 9% concession, seller financing, or rate buy-down credit?
- What does the HOA fee cover, when was the last increase, and are there any pending special assessments or reserve-fund shortfalls?
- Why hasn't it sold? Are there any deal-killer items the seller is aware of (foundation, flood, title, zoning, code violations)?
- Is there a deadline driving the sale (1031 exchange, divorce, estate, relocation)? That informs how much negotiation room exists.
- Schools are D-rated, which usually means shorter tenancies and higher turnover. Who's the typical renter profile here, and what's been the actual vacancy rate?
- What's the average days-on-market for RENTAL listings here right now (not sales)? A rising rental-DOM trend means longer vacancies and softer asking-rent achievability than the comps imply.
- What's the recent tenant-quality profile in this submarket — average credit score on applications, eviction rate, late-payment / NSF rate, and stable-employment percentage? A property-management company in the area should have these aggregated.
- How much new for-sale + rental construction is in the pipeline within 1–3 miles? Heavy new supply typically softens prices + rents 12–24 months out; constrained supply supports both.
Investment metrics
- 1% rule
- 1.45% ✓
- Cap rate
- 11.51%
- Cash-on-cash
- 18.63%
- DSCR
- 1.83
- GRM
- 5.8
CMA / ARV
- ARV (median comp)
- $276,376
- List price
- $119,500
- Delta
- -56.76%
- Verdict
- UNDERPRICED
- Comps
- 20 within 1.0 mi
Show comp detail 8 sales within ~0.75 mi
| Address | Dist | Beds/Ba | Sqft | Sold | Price | $/sf | Match |
|---|---|---|---|---|---|---|---|
| 148 Lakeshore Rd | 0.30mi | 3/2.0 | 1,715 (-1%) | 11mo | $345,000 | $201 | 76 |
| 427 Black Bass Rd | 0.15mi | 3/2.0 | 1,784 (+3%) | 23mo | $249,000 | $140 | 68 |
| 421 Rainbow | 0.09mi | 3/2.0 | 1,476 (-15%) | 6mo | $285,000 | $193 | 66 |
| 308 Black Bass | 0.14mi | 3/2.0 | 1,524 (-12%) | 13mo | $278,000 | $182 | 63 |
| 400 Black Bass Rd | 0.17mi | 4/2.0 (+1) | 1,608 (-7%) | 16mo | $250,000 | $155 | 62 |
| 140 Water View Dr | 0.24mi | 3/2.0 | 1,568 (-9%) | 15mo | $300,000 | $191 | 61 |
| 496 Black Bass Rd | 0.23mi | 3/2.0 | 1,920 (+11%) | 21mo | $199,900 | $104 | 53 |
| 559 Lookout Dr | 0.41mi | 2/2.0 (-1) | 1,876 (+9%) | 19mo | $350,000 | $187 | 46 |
Match score weights: distance 35% · size 25% · config 20% · recency 20%. Top-matched comps best support the ARV.
Projected returns pro-forma
-3.0% appreciation · 3.0% rent growth · sell at horizon
- IRR
- 10.4%
- Equity multiple
- 1.41×
- Total profit
- $13,756
- Equity at exit
- $17,818
- IRR
- 19.5%
- Equity multiple
- 2.64×
- Total profit
- $54,734
- Equity at exit
- $10,332
Cash invested: $33,460 (down + closing). Projections, not guarantees.
Landlord ↔ Tenant lean methodology
- Overall (STATE)
- 87 Strongly Landlord-Friendly
- State Texas
- 87 Strongly Landlord-Friendly · R+5
- County
- — inherits STATE
- City
- — inherits STATE
ZIP-level market 78063
- Home prices YoY
- -31.6%
- Active inventory
- 267
- Price-to-rent
- 5.8×
Monthly cashflow live
- Estimated rent
- $1,730 high interval (Pro) →
- Mortgage (P&I)
- −$627
- Tax from tax record
- −$167 /mo · $2,002/yr
- Insurance
- −$50
- HOA
- −$4
- Vacancy / Maint / Mgmt
- −$363
- Net cashflow
- $519
Break-even live
UW: 25.0% down · 7.5% · 30yr · 1.5% tax · 5.0% vac · 8.0% maint · 8.0% mgmt
Financing live
Cash to close
- Down payment
- $29,875
- Closing costs
- $3,585
- Reserves months
- —
- Total cash needed
- —
Loan-product check · same deal, 3 products live
Conventional
25% down · 7.5% · 30yr
- Down + closing
- —
- Monthly P&I
- —
- Monthly cashflow
- —
- DSCR
- —
- Eligible?
- —
Personal DTI + credit; lowest rate.
DSCR
20% down · 8.5% · 30yr
- Down + closing
- —
- Monthly P&I
- —
- Monthly cashflow
- —
- DSCR
- —
- Eligible?
- —
No personal income docs; deal must DSCR.
Hard money
10% down · 12.0% · 12mo
- Down + closing
- —
- Monthly P&I
- —
- Monthly cashflow
- —
- DSCR
- —
- Eligible?
- —
Short-term bridge; refi at stabilization.
Rent comps 5 comps
| Address | Beds | Baths | Sqft | Rent | $/sqft | DOM | Units | Dist |
|---|---|---|---|---|---|---|---|---|
| 488 Black Bass Rd Lakehills, TX | 2.0 | 1.0 | 1200 | $1,600 | $1.33 | 1d | 1 | 0.24mi |
| 1923 Pebble Beach Rd Lakehills, TX | 3.0 | 2.0 | 1404 | $1,900 | $1.35 | 1d | 1 | 0.39mi |
| 912 Pebble Beach Rd NW Lakehills, TX | 3.0 | 1.5 | 1820 | $2,000 | $1.10 | 23d | 1 | 0.81mi |
| 13689 Farm to Market Road 1283 Unit 1 Mico, TX | 2.0 | 1.0 | 1175 | $1,450 | $1.23 | 20d | 1 | 1.27mi |
| 254 Kens Rd Pipe Creek, TX | 3.0 | 2.0 | 1560 | $1,500 | $0.96 | 24d | 1 | 1.45mi |
HOA detail
- Monthly dues
- $4 · $48/yr
- Likely covers
- electric
Listing history 15 events
-
2026-06-18days on market $119,500 Active 92 DOM
-
2026-06-17days on market $119,500 Active 91 DOM
-
2026-06-16days on market $119,500 Active 90 DOM
-
2026-06-15statusdays on market $119,500 Active 89 DOM
-
2026-06-13days on market $119,500 Price Change 87 DOM
-
2026-06-09days on market $119,500 Price Change 83 DOM
-
2026-06-07days on market $119,500 Price Change 81 DOM
-
2026-06-04pricestatusdays on market $119,500 Price Change 78 DOM
-
2026-06-03days on market $125,000 Active 77 DOM
-
2026-06-02days on market $125,000 Active 76 DOM
-
2026-06-01days on market $125,000 Active 75 DOM
-
2026-05-31days on market $125,000 Active 74 DOM
-
2026-03-18$125,000 New 438-char remark
Show marketing remark (438 chars)
Handyman special with strong upside. Interior needs paint, new flooring, and an HVAC system, while key upgrades are already in place-including a metal roof, PEX plumbing, and updated electrical. The flexible floor plan offers potential for a separate mother-in-law suite or second living area. Situated on a lovely, level lot with a fenced backyard. Excellent investment opportunity with Medina Lake access through Pebble Beach POA parks.
-
2021-02-02soldstatus
-
2003-12-18soldstatus
ⓘ Source: listings_history table (triggers on properties + properties_extension) + one-shot
backfill from property_details.listing_events for pre-trigger history.
Tax reassessment forecast TX · Resets to sale price
- Current annual tax
- $2,002 · $167/mo
- Projected year-2 tax
- $2,187 · $182/mo
- Expected delta
- +$184/yr (+$15/mo · 9.2%)
ⓘ Screening estimate from a state-policy table — verify with the county assessor before closing.
Climate risk First Street
- Flood 1/10 Low FEMA zone X (unshaded) · 0% chance over 30 yrs
- Wildfire 4/10 Moderate
- Heat 7/10 Severe 7 d/yr ≥106°F today · 22 d/yr by 30 yrs out
- Wind 6/10 Major 66% chance of damaging wind over 30 yrs
- Air quality 2/10 Low 0 unhealthy d/yr today · 1 by 30 yrs out
Nearby sold comps map
Loading sold comps map…
Walkable amenities ~0.75 mi
Loading nearby amenities…
Taxation est. · year 1
- Rental income
- $20,760
- − Mortgage interest
- −$6,694
- − Property taxes
- −$2,002
- − Insurance
- −$598
- − Repairs & maintenance
- −$1,661
- − Management
- −$1,661
- − HOA
- −$48
- − Depreciation
- −$3,476
- Taxable income
- $4,621
- Est. tax owed @ 24.0%
- −$1,109
- After-tax cash flow
- $5,124/yr
For passive investors: Depreciation is non-cash, so a rental often shows a tax loss while cash-flowing — sheltering income. Rental losses are passive: they offset passive income freely, and up to $25,000/yr can offset ordinary (W-2) income if you actively participate and your MAGI is under $100k (phasing out to $0 by $150k); unused losses carry forward. On sale, claimed depreciation is recaptured at up to 25%, and gains may owe capital-gains tax (a 1031 exchange can defer both). Figures are a year-1 estimate at your 24.0% rate — not tax advice; consult a CPA.
Schools (NCES district)
- District
- Bandera ISD
- NCES district ID
- 4809360
- Math proficiency
- 30% ▼ -7.00%
- Reading proficiency
- 41% ▼ -3.00%
- Median HH income
- $48,771
- Composite
- 30.61/100
- National rank
- #6194
- State rank
- #500 of 826 in TX
Livability — Lakehills
- Score
- 62/100
- State rank
- #963
- US rank
- #17024
Category grades
Schools grade is shown separately in the Schools card above.
Census & demographics
- Census place
- Lakehills, TX
- City population
- 10,594
- Population (ZIP)
- 10,594
Population outlook (Bandera County) Hauer SSP2
- Today (2025)
- 22,614 people
- By 2030
- 23,102 · +2.2%
- By 2040
- 23,489 · +3.9%
- By 2050
- 23,264 · +2.9%
- By 2075
- 23,607 · +4.4%
- By 2100
- 22,265 · -1.5%
Race, ethnicity, and origin ACS 2023
- Neighborhood character
- Predominantly White (76%)
- Race & ethnicity
- White 76% Hispanic / Latino 18% Two or more races 15%
- Hispanic origin (detail)
- Mexican 15%
- Common ancestry
- Slovak 5% Romanian 3% Serbian 2%
- Foreign-born
- 5% · Canada
- Languages at home
- 88% English-only · Spanish 9% German/W. Germanic 2%
Political lean MEDSL · Bandera
- 2024 margin
- Solid R (+61.9) · D 18.6% · R 80.5%
- 2008→2024 swing
- -11.5pp toward R · 2008: -50.4pp · 2024: -61.9pp
- All cycles
- 2024: R+61.9 2020: R+59.4 2016: R+63.0 2012: R+59.0 2008: R+50.4
Not yet ingested
- Civics
- —
Market trends
- HPI YoY
- ▼ -87.38%
- Current HPI
- 189.1086
- Rent YoY
- —
- Metro
- —
- State GDP YoY
- ▲ 3.95%
- F500 in state
- 110
Industry mix (Fortune 500 HQ in TX)
| Industry | F500 HQs | Revenue |
|---|---|---|
| Energy | 16 | $1,198B |
|
||
| Technology | 5 | $198B |
|
||
| Engineering / Construction | 4 | $72B |
|
||
| Energy Services | 3 | $60B |
|
||
| Utilities | 3 | $41B |
|
||
| Healthcare | 2 | $330B |
|
||
Price history
3 events — show timeline
- 2026-03-18 Listed $125,000 LERA
- 2021-02-02 Sold (Public Records) — Public Records
- 2003-12-18 Sold (Public Records) — Public Records
Property tax history
+2.3%/yrLatest (2025): $2,002 · +1.1% YoY. Source: county tax records.
Cash-flow waterfall
monthlySold comps — $/sqft
last 12 mo · ≤1 miLoading sold comps…