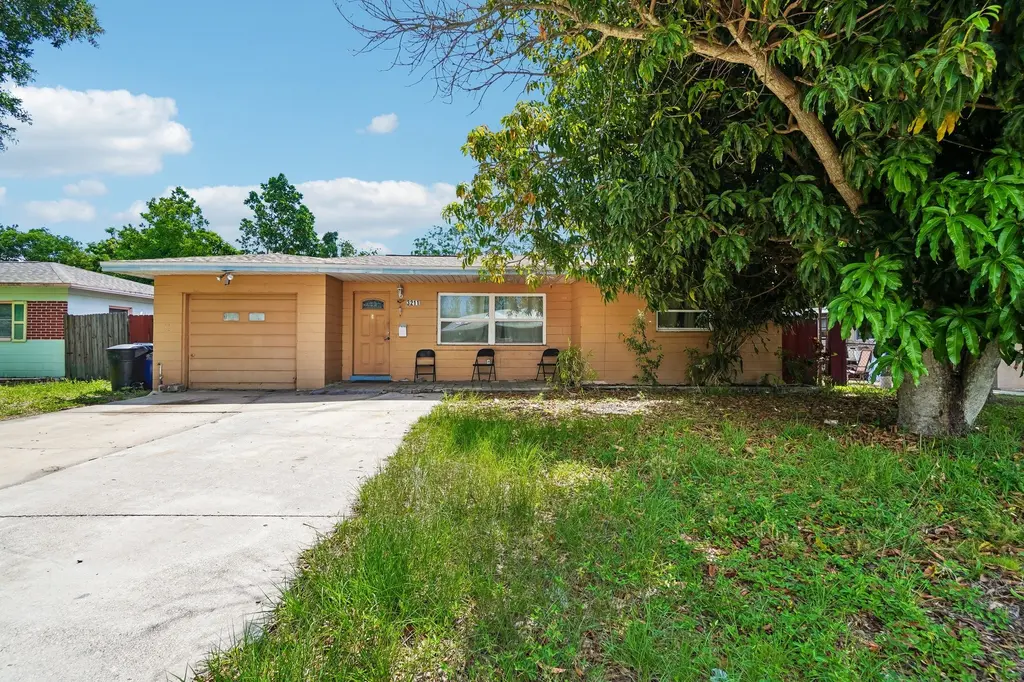
3211 30th St N · St. Petersburg, FL
Flood risk 1/10 · Minimal
- FEMA flood zone
- X (unshaded)
- Chance of flooding over 30 yrs
- 0.0%
- Est. flood insurance / yr
- $507 – $1,088
Fire risk 1/10 · Minimal
- Est. fire insurance / yr
- $947 – $1,759
Heat risk 10/10 · Severe
- Hot days now (above 106°F)
- 7 days/yr
- Hot days in 30 yrs
- 26 days/yr
Wind risk 10/10 · Severe
- Chance of severe wind over 30 yrs
- 99.0%
Air-quality risk 4/10 · Minor
- Unhealthy air days now
- 4 days/yr
- Unhealthy air days in 30 yrs
- 4 days/yr
Risk factors via First Street. Map © Google.
Why this score? — see what drove the D+ grade
The composite is a weighted blend of 9 inputs, each scored 0–100. Each bar is that input's sub-score; the figure is the points it added to the 100-point composite (weight × sub-score).
- ARV discount +15.0/15.0
- Cash flow +14.6/30.0
- DSCR +4.4/10.0
- Schools +4.3/10.0
- 1% rule +3.7/10.0
- Rent growth +2.7/5.0
- Livability +2.5/5.0
- Condition / age +2.5/5.0
- Appreciation +0.0/10.0
$375,000
🖨 Deal sheet (PDF) 📄 Offer letter ✓ Due diligence
Listing remarks
Welcome to this charming 3-bedroom, 2-bath home offering comfort, convenience, and excellent value. Inside, you'll find a spacious layout with plenty of natural light, creating a warm and inviting atmosphere throughout. The home features generously sized bedrooms, functional living spaces, and a floor plan designed for everyday living. The property offers a large yard with plenty of room for outdoor entertaining, gardening, pets, or future improvements. Conveniently located near shopping, dining, schools, parks, and major roadways, this home provides easy access to everything you need while maintaining a neighborhood feel. Whether you're a first-time homebuyer, looking to downsize, or searc
Key facts
- Easy access
- Outdoor entertaining
- Large yard
Tags
Property features AI
Finance
- Other: Lot about 0.19 acres; Living area reported as 2,002 sq ft (appraiser); Building area total reported as 2,622 sq ft (appraiser); Directions: Take I-275 South toward St. Petersburg. Exit at 38th Avenue North. Head west on 38th Ave N. Turn left (south) onto 30th Street N. Continue south to 3211 30th St N, which will be on your left.
Exterior
- Parking: Attached garage (1 car)
- Utilities: Public water; Public sewer; Cable available; Phone available
- Home design: Single family residence; Residential property; One story; Faces west; Homestead
- Construction: Cement siding; Shingle roof; Slab foundation; Built area documented by appraiser
- Exterior features: Lighting; Sidewalk; Asphalt road access
Interior
- Kitchen: Dishwasher; Microwave; Range; Refrigerator
- Bedrooms: 3 bedrooms
- Flooring: Tile; Vinyl
- Bathrooms: 2 full bathrooms
- Heating & cooling: Central heating; Central air
- Interior features: Ceiling fans; Thermostat
- Laundry & utility: Washer hookup; Gas dryer hookup
Neighborhood map
What this means for you Summary
Snapshot
- This is a 3-bed/2.0-bath single-family listed at $375k.
Deal economics
- At list price, monthly cash flow is $87 ($1k/yr) — positive.
- The deal already cash-flows at list — no discount required.
- To meet the 1% rule (rent ≥ 1% of price), the offer needs to be $328k (12.6% below list).
- Recommended offer: $328k (12.6% below list) — sets the bar for 1% rule.
- Cap rate 6.6% vs local median 2.6% in St. Petersburg — top-decile yield for the area; either an underpriced asset or a hidden risk that comps aren't pricing in. Stress-test before assuming the spread holds.
Location & tenants
- Location reads: area grade D — affects rentability + tenant quality, not the cash-flow math above.
- Pinellas (suburban): math 51% / reading 51% proficiency, ranked #31 of 73 in FL (top 42%) — acceptable for families but not a draw, mixed tenant base, ~2y average lease.
- Zoned schools: New Heights Elementary School (math 34% / reading 32%, grade F, #1,773 of 2,144 statewide, top 83%, 615 students, 81% FRL); Tyrone Middle School (math 35% / reading 28%, grade F, #453 of 571 statewide, top 81%, 847 students, 68% FRL); St. Petersburg High School (math 31% / reading 61%, grade D-, #220 of 667 statewide, top 33%, 1,723 students, 39% FRL).
- Zoned-school proficiency averages 37% at this address vs 51% district-wide (-14 pts) — the specific schools serving this property underperform the Pinellas average; the district grade overstates school quality for this exact location.
- Market conditions: Rents flat; 311 active listings in the ZIP; 11 comparable units currently listed for rent nearby; rentals at typical pace (median 17d on market — plan ~3-4 weeks tenant-placement turnaround); 2,676 units permitted in Pinellas County in 2024 (1,422 in 5+ unit buildings).
- At $3,277/mo this rent would consume 53% of the median local household income ($75k/yr) (locally 1076% of renters already pay >50% of income on rent) — very limited rent-growth headroom before tenants either downsize or default.
Forward outlook
- Local home prices are declining (-3.0%/yr); year-one equity from $3k of loan paydown is wiped out by about $11k of value loss. Plan a longer hold.
- Pinellas County population projected at +14% by 2050 — modest demand growth; plan on rents tracking national, not racing it.
Negotiation context
- Only 9 days on market — expect competitive offers; lowballing is unlikely to land.
- Current owner paid $66k; list at $375k implies a 464% gain — meaningful room to come down on a strong offer.
Risks & watch-outs
- Watch-outs: built in 1957 — expect roof / HVAC / electrical / plumbing capex.
- Climate carrying-cost: severe wind risk, 99% chance of damaging wind over 30y; extreme-heat days projected 7→26/yr by 2055 (HVAC capex compounding) — expect insurance premiums to compound above CPI over the hold.
Questions for the listing agent
- Built in 1957 — when were the roof, HVAC, electrical panel, plumbing, and water heater last replaced?
- Is there a deadline driving the sale (1031 exchange, divorce, estate, relocation)? That informs how much negotiation room exists.
- The area grade is low — what's the realistic commute time and amenity access for the typical tenant pool here? Any planned neighborhood developments (good or bad) we should know about?
- What's the average days-on-market for RENTAL listings here right now (not sales)? A rising rental-DOM trend means longer vacancies and softer asking-rent achievability than the comps imply.
- What's the recent tenant-quality profile in this submarket — average credit score on applications, eviction rate, late-payment / NSF rate, and stable-employment percentage? A property-management company in the area should have these aggregated.
- How much new for-sale + rental construction is in the pipeline within 1–3 miles? Heavy new supply typically softens prices + rents 12–24 months out; constrained supply supports both.
Investment metrics
- 1% rule
- 0.87% ✗
- Cap rate
- 6.57%
- Cash-on-cash
- 1.00%
- DSCR
- 1.04
- GRM
- 9.5
CMA / ARV
- ARV (on-the-fly)
- $480,480
- Comps found
- 3
Show comp detail 3 sales within ~0.75 mi
| Address | Dist | Beds/Ba | Sqft | Sold | Price | $/sf | Match |
|---|---|---|---|---|---|---|---|
| 2890 40th Ave N | 0.46mi | 3/2.0 | 2,059 (+3%) | 14mo | $495,000 | $240 | 62 |
| 2508 42nd Ave N | 0.69mi | 4/2.0 (+1) | 1,718 (-14%) | 8mo | $395,000 | $230 | 32 |
| 3421 38th St N | 0.70mi | 3/2.0 | 1,749 (-13%) | 20mo | $465,000 | $266 | 30 |
Match score weights: distance 35% · size 25% · config 20% · recency 20%. Top-matched comps best support the ARV.
Projected returns pro-forma
-3.0% appreciation · 0.67% rent growth · sell at horizon
- IRR
- -17.3%
- Equity multiple
- 0.40×
- Total profit
- $-62,717
- Equity at exit
- $55,914
- IRR
- -14.1%
- Equity multiple
- 0.27×
- Total profit
- $-76,877
- Equity at exit
- $32,423
Cash invested: $105,000 (down + closing). Projections, not guarantees.
Landlord ↔ Tenant lean methodology
- Overall (STATE)
- 87 Strongly Landlord-Friendly
- State Florida
- 87 Strongly Landlord-Friendly · R+3
- County
- — inherits STATE
- City
- — inherits STATE
ZIP-level market 33713
- Rents YoY
- 0.7%
- Active inventory
- 311
- Price-to-rent
- 9.5×
Monthly cashflow live
- Estimated rent
- $3,277 high interval (Pro) →
- Mortgage (P&I)
- −$1,967
- Tax from tax record
- −$379 /mo · $4,548/yr
- Insurance
- −$156
- HOA
- −$0
- Vacancy / Maint / Mgmt
- −$688
- Net cashflow
- $87
Break-even live
Sensitivity live
| Price | -10% $300 | -5% $194 | +0% $87 | +5% $-19 | +10% $-125 |
|---|---|---|---|---|---|
| Rent | -10% $-172 | -5% $-42 | +0% $87 | +5% $217 | +10% $346 |
| Rate | -1.0pp $276 | -0.5pp $183 | base $87 | +0.5pp $-10 | +1.0pp $-109 |
UW: 25.0% down · 7.5% · 30yr · 1.5% tax · 5.0% vac · 8.0% maint · 8.0% mgmt
Financing live
Cash to close
- Down payment
- $93,750
- Closing costs
- $11,250
- Reserves months
- —
- Total cash needed
- —
Loan-product check · same deal, 3 products live
Conventional
25% down · 7.5% · 30yr
- Down + closing
- —
- Monthly P&I
- —
- Monthly cashflow
- —
- DSCR
- —
- Eligible?
- —
Personal DTI + credit; lowest rate.
DSCR
20% down · 8.5% · 30yr
- Down + closing
- —
- Monthly P&I
- —
- Monthly cashflow
- —
- DSCR
- —
- Eligible?
- —
No personal income docs; deal must DSCR.
Hard money
10% down · 12.0% · 12mo
- Down + closing
- —
- Monthly P&I
- —
- Monthly cashflow
- —
- DSCR
- —
- Eligible?
- —
Short-term bridge; refi at stabilization.
Rent comps 11 comps
| Address | Beds | Baths | Sqft | Rent | $/sqft | DOM | Units | Dist |
|---|---|---|---|---|---|---|---|---|
| 2700 26th St N Saint Petersburg, FL | 4.0 | 2.0 | 1608 | $2,250 | $1.40 | 16d | 1 | 0.45mi |
| 2820 23rd St N Saint Petersburg, FL | 4.0 | 2.0 | 1615 | $3,037 | $1.88 | 19d | 1 | 0.66mi |
| 3750 28th Ave N Saint Petersburg, FL | 3.0 | 2.0 | 1512 | $2,830 | $1.87 | 26d | 1 | 0.75mi |
| 4116 Yardley Ave N Saint Petersburg, FL | 3.0 | 2.0 | 1680 | $4,150 | $2.47 | 6d | 1 | 1.15mi |
| 5246 Neil Dr Saint Petersburg, FL | 3.0 | 3.0 | 1713 | $3,450 | $2.01 | 23d | 1 | 1.25mi |
| 1171 25th Ln N Saint Petersburg, FL | 3.0 | 3.5 | 1990 | $4,500 | $2.26 | 4d | 1 | 1.30mi |
| 1162 25th Way N Saint Petersburg, FL | 3.0 | 2.5 | 2205 | $4,500 | $2.04 | 9d | 1 | 1.31mi |
| 1803 42nd Way N Saint Petersburg, FL | 2.0 | 2.0 | 1421 | $4,200 | $2.96 | 26d | 1 | 1.36mi |
| 2620 13th St N Saint Petersburg, FL | 3.0 | 4.0 | 2342 | $4,400 | $1.88 | 26d | 1 | 1.43mi |
| 1156 37th Ave N Saint Petersburg, FL | 3.0 | 3.0 | 2178 | $3,600 | $1.65 | 12d | 1 | 1.43mi |
| 3301 9th Ave N Saint Petersburg, FL | 3.0 | 2.0 | 1514 | $3,500 | $2.31 | 6d | 1 | 1.45mi |
Listing history 7 events
-
2026-06-21days on market $375,000 Active 9 DOM
-
2026-06-18days on market $375,000 Active 6 DOM
-
2026-06-17days on market $375,000 Active 5 DOM
-
2026-06-16days on market $375,000 Active 4 DOM
-
2026-06-15days on market $375,000 Active 3 DOM
-
2026-06-13remarks 699-char remark
-
2026-06-13$375,000 Active 1 DOM
ⓘ Source: listings_history table (triggers on properties + properties_extension) + one-shot
backfill from property_details.listing_events for pre-trigger history.
Tax reassessment forecast FL · Resets to sale price
- Current annual tax
- $4,548 · $379/mo
- Projected year-2 tax
- $4,548 · $379/mo
- Expected delta
- $0/yr ($0/mo · 0.0%)
ⓘ Screening estimate from a state-policy table — verify with the county assessor before closing.
Climate risk First Street
- Flood 1/10 Low FEMA zone X (unshaded) · 0% chance over 30 yrs
- Wildfire 1/10 Low
- Heat 10/10 Extreme 7 d/yr ≥106°F today · 26 d/yr by 30 yrs out
- Wind 10/10 Extreme 99% chance of damaging wind over 30 yrs
- Air quality 4/10 Moderate 4 unhealthy d/yr today · 4 by 30 yrs out
Nearby sold comps map
Loading sold comps map…
Walkable amenities ~0.75 mi
Loading nearby amenities…
Taxation est. · year 1
- Rental income
- $39,328
- − Mortgage interest
- −$21,006
- − Property taxes
- −$4,548
- − Insurance
- −$1,875
- − Repairs & maintenance
- −$3,146
- − Management
- −$3,146
- − Depreciation
- −$10,909
- Taxable loss
- −$5,302
- Est. tax savings @ 24.0%
- +$1,272
- After-tax cash flow
- $2,321/yr
For passive investors: Depreciation is non-cash, so a rental often shows a tax loss while cash-flowing — sheltering income. Rental losses are passive: they offset passive income freely, and up to $25,000/yr can offset ordinary (W-2) income if you actively participate and your MAGI is under $100k (phasing out to $0 by $150k); unused losses carry forward. On sale, claimed depreciation is recaptured at up to 25%, and gains may owe capital-gains tax (a 1031 exchange can defer both). Figures are a year-1 estimate at your 24.0% rate — not tax advice; consult a CPA.
Schools (NCES district)
- District
- Pinellas
- NCES district ID
- 1201560
- Math proficiency
- 51% ▼ -5.00%
- Reading proficiency
- 51% ▼ -3.00%
- Median HH income
- $46,270
- Composite
- 43.27/100
- National rank
- #3046
- State rank
- #31 of 73 in FL
Livability — St. Petersburg
No livability data for this city. (Only ~50 U.S. cities are tracked.)
Census & demographics
- Census place
- St. Petersburg, FL
- County
- Pinellas County · 939,478 people
- City population
- 249,151
- Metro
- Tampa-St. Petersburg-Clearwater, FL
- Population (ZIP)
- 31,729
- Household income
- $74,707
- Rent vs Own
- Severe rent burden
- 1076.0
Population outlook (Pinellas County) Hauer SSP2
- Today (2025)
- 1,027,532 people
- By 2030
- 1,063,586 · +3.5%
- By 2040
- 1,125,020 · +9.5%
- By 2050
- 1,168,637 · +13.7%
- By 2075
- 1,265,188 · +23.1%
- By 2100
- 1,260,357 · +22.7%
Race, ethnicity, and origin ACS 2023
- Neighborhood character
- Predominantly White (71%)
- Race & ethnicity
- White 71% Hispanic / Latino 13% Two or more races 9% Black 7% Asian 6%
- Hispanic origin (detail)
- Mexican 3% Puerto Rican 2% Cuban 3%
- Common ancestry
- Romanian 3% Lithuanian 2% Slovak 2%
- Foreign-born
- 12% · Canada, Vietnam
- Languages at home
- 84% English-only · Spanish 9% Other Asian/Pacific 2% Vietnamese 2%
Political lean MEDSL · Pinellas
- 2024 margin
- Lean R (+5.2) · D 46.9% · R 52.1%
- 2008→2024 swing
- -13.5pp toward R · 2008: 8.3pp · 2024: -5.2pp
- All cycles
- 2024: R+5.2 2020: D+0.2 2016: R+1.1 2012: D+5.6 2008: D+8.3
Not yet ingested
- Civics
- —
Market trends
- HPI YoY
- ▼ -439.69%
- Current HPI
- 478.8317
- Rent YoY
- ▲ 0.67%
- Metro
- Tampa-St. Petersburg-Clearwater, FL
- State GDP YoY
- ▲ 3.28%
- F500 in state
- 36
Industry mix (Fortune 500 HQ in FL)
| Industry | F500 HQs | Revenue |
|---|---|---|
| Industrial Technology | 2 | $29B |
|
||
| Insurance | 2 | $17B |
|
||
| Retail | 1 | $60B |
|
||
| Technology Distribution | 1 | $58B |
|
||
| Homebuilding | 1 | $35B |
|
||
| Technology Manufacturing | 1 | $35B |
|
||
Price history
+463.9% since first listed2 events — show timeline
- 2026-06-12 Listed $375,000 Stellar MLS as Distributed by MLS Grid
- 1998-04-17 Sold (Public Records) $66,500 Public Records
Property tax history
+3.5%/yrLatest (2025): $4,548 · +169.5% YoY. Source: county tax records.
Cash-flow waterfall
monthlySold comps — $/sqft
last 12 mo · ≤1 miLoading sold comps…