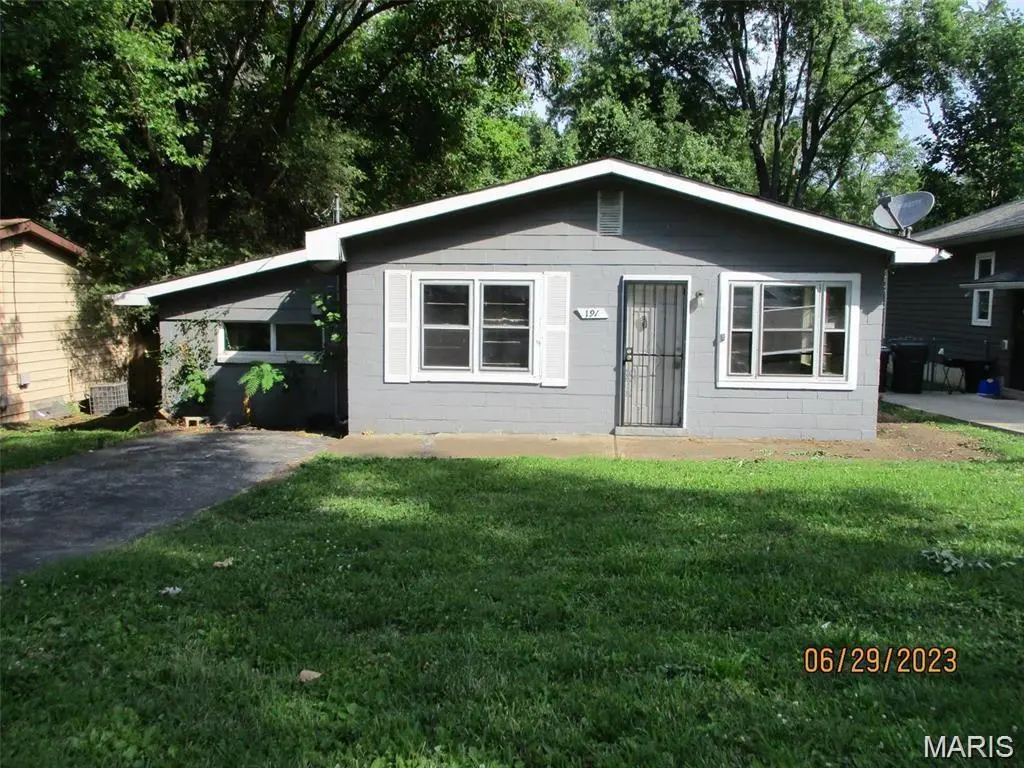
191 Bascom Dr · Hazelwood, MO
Flood risk 1/10 · Minimal
- FEMA flood zone
- X (unshaded)
- Chance of flooding over 30 yrs
- 0.0%
- Est. flood insurance / yr
- $507 – $1,088
Fire risk 1/10 · Minimal
- Est. fire insurance / yr
- $1,054 – $1,958
Heat risk 4/10 · Minor
- Hot days now (above 106°F)
- 7 days/yr
- Hot days in 30 yrs
- 19 days/yr
Wind risk 2/10 · Minimal
- Chance of severe wind over 30 yrs
- 1.0%
Air-quality risk 3/10 · Minor
- Unhealthy air days now
- 3 days/yr
- Unhealthy air days in 30 yrs
- 5 days/yr
Risk factors via First Street. Map © Google.
Why this score? — see what drove the C+ grade
The composite is a weighted blend of 9 inputs, each scored 0–100. Each bar is that input's sub-score; the figure is the points it added to the 100-point composite (weight × sub-score).
- Cash flow +27.1/30.0
- DSCR +9.4/10.0
- ARV discount +8.2/15.0
- 1% rule +6.5/10.0
- Rent growth +4.8/5.0
- Livability +3.1/5.0
- Condition / age +2.5/5.0
- Schools +1.2/10.0
- Appreciation +0.0/10.0
$125,000
🖨 Deal sheet 📄 Offer letter ✓ Due diligence
Listing remarks MLS
HIGHEST AND BEST IS DUE MONDAY JULY 17@10 AM. 3 bed 1 bath on quiet street.Property selling AS IS with NO contingencies. CASH ONLY. Buyer must complete all DUE Diligence before submitting offer. Seller has never occupied property. Seller to make no inspection or repairs. Property has to be on market 7 days before seller will review any offers. Seller reserves the right to accept offer at any time. Buyer to verify schools and utilities.
Key facts
- 6,250 sq ft lot
- Built 1952
- Listed 13 days
Property features AI
Finance
- Financial info: Lease considered
Exterior
- Utilities: Public water; Public sewer; Electricity connected; Natural gas connected
- Home design: Single-family residence; One level
- Construction: Block and concrete construction
- Exterior features: Level lot; Back yard with chain link fencing
Interior
- Kitchen: Kitchen on main level
- Bedrooms: Three bedrooms on the main level
- Bathrooms: One full bathroom (main level)
- Heating & cooling: Forced air heating (natural gas); Central air conditioning (electric)
- Interior features: Family room; Five total rooms
Neighborhood map
What this means for you Summary
Snapshot
- This is a 3-bed/1.0-bath single-family listed at $125k.
Deal economics
- At list price, monthly cash flow is $354 ($4k/yr) — positive.
- The deal already cash-flows at list — no discount required.
- Meets the 1% rule at list price ($1k rent vs $125k).
- Cap rate 9.7% vs local median 7.2% in Hazelwood — top-decile yield for the area; either an underpriced asset or a hidden risk that comps aren't pricing in. Stress-test before assuming the spread holds.
Location & tenants
- Location reads 62/100 on livability (#395 in MO) — a middle-class / working-renter tenant base. Strengths: cost of living A+, housing A+; Watch: crime F, amenities F, commute F.
- Ferguson-Florissant R-II (suburban): math 7% / reading 20% proficiency, ranked #311 of 324 in MO (top 96%) — low school quality limits family demand, transient renter base, plan for 1-2y turnover; 70% free/reduced lunch — lower-income household profile, screen leases tightly.
- Zoned schools: Walnut Grove Elem. (342 students, 99% FRL); Mccluer High (math 0% / reading 17%, grade F, #511 of 521 statewide, top 98%, 1,181 students, 100% FRL) — zoned schools average 99% FRL vs 70% district-wide (30 pts higher); higher-poverty schools than district average — tighter screening recommended.
- Market conditions: Rents rising fast (+9.0%/yr); 162 active listings in the ZIP; 40 comparable units currently listed for rent nearby; rentals at typical pace (median 24d on market — plan ~3-4 weeks tenant-placement turnaround); 920 units permitted in St. Louis County in 2024 (250 in 5+ unit buildings).
- This rent runs 33% of the median local income ($52k/yr) — at the standard rent-burdened threshold; future hikes will face affordability resistance.
Forward outlook
- Local home prices are declining (-3.0%/yr); year-one equity from $864 of loan paydown is wiped out by about $4k of value loss. Plan a longer hold.
- At projected returns (-3.0% appreciation + 8.0% rent growth), your $35k cash investment doubles in ~7 years — after that, you're playing with house money.
Negotiation context
- Only 13 days on market — expect competitive offers; lowballing is unlikely to land.
- Current owner paid $48k; list at $125k implies a 161% gain — meaningful room to come down on a strong offer.
Risks & watch-outs
- Watch-outs: built in 1952 — expect roof / HVAC / electrical / plumbing capex.
Questions for the listing agent
- Built in 1952 — when were the roof, HVAC, electrical panel, plumbing, and water heater last replaced?
- Is there a deadline driving the sale (1031 exchange, divorce, estate, relocation)? That informs how much negotiation room exists.
- Schools are D-rated, which usually means shorter tenancies and higher turnover. Who's the typical renter profile here, and what's been the actual vacancy rate?
- Crime grade is F in this area — have there been break-ins, vandalism, or insurance claims at this property in the last 3 years? What carrier currently insures it and at what premium?
- What's the average days-on-market for RENTAL listings here right now (not sales)? A rising rental-DOM trend means longer vacancies and softer asking-rent achievability than the comps imply.
- What's the recent tenant-quality profile in this submarket — average credit score on applications, eviction rate, late-payment / NSF rate, and stable-employment percentage? A property-management company in the area should have these aggregated.
- How much new for-sale + rental construction is in the pipeline within 1–3 miles? Heavy new supply typically softens prices + rents 12–24 months out; constrained supply supports both.
Investment metrics
- 1% rule
- 1.15% ✓
- Cap rate
- 9.69%
- Cash-on-cash
- 12.12%
- DSCR
- 1.54
- GRM
- 7.2
CMA / ARV
- ARV (on-the-fly)
- $126,973
- Comps found
- 12
Show comp detail 12 sales within ~0.75 mi
| Address | Dist | Beds/Ba | Sqft | Sold | Price | $/sf | Match |
|---|---|---|---|---|---|---|---|
| 6801 Knoll Ave | 0.23mi | 3/1.0 | 1,224 (-6%) | 1mo | $104,900 | $86 | 77 |
| 18 White Dr | 0.36mi | 3/1.0 | 1,340 (+2%) | 2mo | $165,000 | $123 | 77 |
| 6604 Graybirch Dr | 0.54mi | 3/2.0 | 1,288 (-2%) | 1mo | $124,900 | $97 | 68 |
| 8418 Midwood Ave | 0.54mi | 3/2.0 | 1,288 (-2%) | 2mo | $125,000 | $97 | 67 |
| 8443 Red Fir Dr | 0.60mi | 3/2.0 | 1,288 (-2%) | 2mo | $32,000 | $25 | 64 |
| 8302 Woodhurst Dr | 0.33mi | 3/1.0 | 1,120 (-14%) | 1mo | $99,900 | $89 | 60 |
| 8406 January Ave | 0.72mi | 3/2.0 | 1,288 (-2%) | 2mo | $160,000 | $124 | 58 |
| 6837 Saint Olaf Dr | 0.60mi | 3/1.0 | 1,140 (-13%) | 2mo | $120,000 | $105 | 49 |
| 8301 Pepperidge Dr | 0.57mi | 3/1.0 | 1,120 (-14%) | 1mo | $139,900 | $125 | 49 |
| 8513 Midwood Ave | 0.67mi | 3/2.0 | 1,176 (-10%) | 0mo | $94,900 | $81 | 47 |
| 1815 S New Florissant Rd | 0.58mi | 3/1.0 | 1,123 (-14%) | 2mo | $162,500 | $145 | 47 |
| 6937 Berkridge Ct | 0.71mi | 3/1.0 | 1,123 (-14%) | 2mo | $74,000 | $66 | 41 |
Match score weights: distance 35% · size 25% · config 20% · recency 20%. Top-matched comps best support the ARV.
Projected returns pro-forma
-3.0% appreciation · 8.0% rent growth · sell at horizon
- IRR
- 6.8%
- Equity multiple
- 1.28×
- Total profit
- $9,856
- Equity at exit
- $18,638
- IRR
- 20.0%
- Equity multiple
- 3.06×
- Total profit
- $72,149
- Equity at exit
- $10,808
Cash invested: $35,000 (down + closing). Projections, not guarantees.
Landlord ↔ Tenant lean methodology
- Overall (STATE)
- 81 Strongly Landlord-Friendly
- State Missouri
- 81 Strongly Landlord-Friendly · R+10
- County
- — inherits STATE
- City
- — inherits STATE
ZIP-level market 63135
- Rents YoY
- 9.0%
- Active inventory
- 162
- Price-to-rent
- 7.2×
Monthly cashflow live
- Estimated rent
- $1,442 high interval (Pro) →
- Mortgage (P&I)
- −$656
- Tax from tax record
- −$78 /mo · $934/yr
- Insurance
- −$52
- HOA
- −$0
- Vacancy / Maint / Mgmt
- −$303
- Net cashflow
- $354
Break-even live
UW: 25.0% down · 7.5% · 30yr · 1.5% tax · 5.0% vac · 8.0% maint · 8.0% mgmt
Financing live
Cash to close
- Down payment
- $31,250
- Closing costs
- $3,750
- Reserves months
- —
- Total cash needed
- —
Loan-product check · same deal, 3 products live
Conventional
25% down · 7.5% · 30yr
- Down + closing
- —
- Monthly P&I
- —
- Monthly cashflow
- —
- DSCR
- —
- Eligible?
- —
Personal DTI + credit; lowest rate.
DSCR
20% down · 8.5% · 30yr
- Down + closing
- —
- Monthly P&I
- —
- Monthly cashflow
- —
- DSCR
- —
- Eligible?
- —
No personal income docs; deal must DSCR.
Hard money
10% down · 12.0% · 12mo
- Down + closing
- —
- Monthly P&I
- —
- Monthly cashflow
- —
- DSCR
- —
- Eligible?
- —
Short-term bridge; refi at stabilization.
Rent comps 40 comps
| Address | Beds | Baths | Sqft | Rent | $/sqft | DOM | Units | Dist |
|---|---|---|---|---|---|---|---|---|
| 153 Bascom Dr Saint Louis, MO | 3.0 | 1.0 | 1076 | $1,195 | $1.11 | 19d | 1 | 0.10mi |
| 171 Elbring Dr Saint Louis, MO | 3.0 | 1.5 | 1008 | $1,395 | $1.38 | 12d | 1 | 0.11mi |
| 6867 Thurston Ave Saint Louis, MO | 3.0 | 2.0 | 1243 | $1,580 | $1.27 | 43d | 1 | 0.15mi |
| 46 Bascom Dr Saint Louis, MO | 2.0 | 1.0 | 932 | $1,175 | $1.26 | 43d | 1 | 0.23mi |
| 107 Anistasia Dr Saint Louis, MO | 2.0 | 2.0 | 1030 | $1,400 | $1.36 | 23d | 1 | 0.27mi |
| 260 Sadonia Ave Saint Louis, MO | 3.0 | 2.0 | 1088 | $1,623 | $1.49 | 20d | 1 | 0.29mi |
| 263 Sadonia Ave Saint Louis, MO | 3.0 | 2.0 | 888 | $1,350 | $1.52 | 43d | 1 | 0.31mi |
| 1275 N Florissant Rd Saint Louis, MO | 2.0 | 1.0 | 1008 | $1,275 | $1.26 | 23d | 1 | 0.33mi |
| 11 Anistasia Dr Saint Louis, MO | 3.0 | 1.5 | 1120 | $1,345 | $1.20 | 23d | 1 | 0.38mi |
| 1131 N Florissant Rd Saint Louis, MO | 3.0 | 1.0 | 1580 | $1,390 | $0.88 | 23d | 1 | 0.40mi |
| 8330 Woodhurst Dr Saint Louis, MO | 3.0 | 1.0 | 1120 | $1,000 | $0.89 | 7d | 1 | 0.42mi |
| 6625 Thurston Ave Saint Louis, MO | 2.0 | 1.0 | 939 | $1,300 | $1.38 | 43d | 1 | 0.43mi |
| 6625 Thurston Ave Saint Louis, MO | 2.0 | 1.0 | 939 | $1,400 | $1.49 | 23d | 1 | 0.43mi |
| 36 Connolly Dr Saint Louis, MO | 3.0 | 1.0 | 1024 | $1,149 | $1.12 | 23d | 1 | 0.43mi |
| 7025 Richwood Ln Hazelwood, MO | 3.0 | 1.0 | 936 | $1,375 | $1.47 | 17d | 1 | 0.45mi |
| 221 Barto Dr Saint Louis, MO | 3.0 | 2.0 | 958 | $1,295 | $1.35 | 20d | 1 | 0.53mi |
| 8412 Chalons Ct Saint Louis, MO | 3.0 | 1.0 | 1380 | $1,370 | $0.99 | 23d | 1 | 0.54mi |
| 8418 Bayberry Dr Saint Louis, MO | 3.0 | 2.0 | 1288 | $1,350 | $1.05 | 21d | 1 | 0.55mi |
| 541 Hentschel Pl Saint Louis, MO | 2.0 | 1.0 | 1305 | $1,500 | $1.15 | 4d | 1 | 0.60mi |
| 8437 January Ave Saint Louis, MO | 3.0 | 2.0 | 1288 | $1,350 | $1.05 | 43d | 1 | 0.75mi |
| 1455 S New Florissant Rd Florissant, MO | 4.0 | 1.0 | 1584 | $1,721 | $1.09 | 43d | 1 | 0.76mi |
| 6452 Evergreen Blvd Saint Louis, MO | 3.0 | 2.0 | 1288 | $1,500 | $1.16 | 23d | 1 | 0.76mi |
| 5 Santa Cruz Dr Florissant, MO | 2.0 | 1.0 | 1410 | $1,411 | $1.00 | 16d | 1 | 0.77mi |
| 1465 W Duchesne Dr Florissant, MO | 3.0 | 1.0 | 896 | $1,500 | $1.67 | 43d | 1 | 0.83mi |
| 8439 Alder Ave Saint Louis, MO | 3.0 | 1.5 | 1176 | $1,425 | $1.21 | 23d | 1 | 0.83mi |
| 1250 S New Florissant Rd Florissant, MO | 2.0 | 1.0 | 1150 | $1,500 | $1.30 | 14d | 1 | 0.90mi |
| 6698 Amora Ave Berkeley, MO | 2.0–3.0 | 1.5 | 1625 | $1,500 | $0.92 | 43d | 1 | 0.92mi |
| 8507 Tally Ho Dr Hazelwood, MO | 2.0 | 1.5 | 1478 | $1,300 | $0.88 | 43d | 5 | 0.93mi |
| 1180 S New Florissant Rd Florissant, MO | 3.0 | 1.0 | 925 | $1,225 | $1.32 | 23d | 1 | 0.97mi |
| 17 Valley Dr Florissant, MO | 2.0 | 2.0 | 1356 | $1,525 | $1.12 | 43d | 1 | 1.04mi |
| 6156 Wulff Dr Saint Louis, MO | 3.0 | 2.0 | 960 | $1,425 | $1.48 | 10d | 1 | 1.07mi |
| 6044 Cascade Dr Saint Louis, MO | 2.0 | 1.0 | 984 | $1,150 | $1.17 | 7d | 1 | 1.11mi |
| 60 Mayme Dr Saint Louis, MO | 3.0 | 1.0 | 960 | $1,285 | $1.34 | 43d | 1 | 1.23mi |
| 410 Robert Ave Ferguson, MO | 4.0 | 2.0 | 1471 | $2,000 | $1.36 | 11d | 1 | 1.24mi |
| 910 Disco Dr Saint Louis, MO | 3.0 | 1.0 | 924 | $1,260 | $1.36 | 16d | 1 | 1.28mi |
| 297 Saint Eugene Ln Florissant, MO | 2.0 | 1.0 | 1100 | $1,100 | $1.00 | 43d | 1 | 1.35mi |
| 3585 Pershall Rd Unit Savana Ferguson, MO | 2.0 | 1.5 | 1518 | $1,375 | $0.91 | 43d | 1 | 1.35mi |
| 3585 Pershall Rd Ferguson, MO | 2.0 | 2.0 | 1388 | $1,400 | $1.01 | 43d | 1 | 1.35mi |
| 3585 Pershall Rd Unit Moor Ferguson, MO | 3.0 | 2.0 | 1577 | $1,500 | $0.95 | 43d | 1 | 1.35mi |
| 805 Robinwood Dr Florissant, MO | 3.0 | 1.5 | 1729 | $1,571 | $0.91 | 20d | 1 | 1.36mi |
Listing history 13 events
-
2026-06-17status $125,000 Pending 13 DOM
-
2026-06-17days on market $125,000 Active 13 DOM
-
2026-06-16days on market $125,000 Active 12 DOM
-
2026-06-15days on market $125,000 Active 11 DOM
-
2026-06-13days on market $125,000 Active 9 DOM
-
2026-06-13days on market $125,000 Active 8 DOM
-
2026-06-09days on market $125,000 Active 5 DOM
-
2026-06-08days on market $125,000 Active 4 DOM
-
2026-06-07days on market $125,000 Active 3 DOM
-
2026-06-05statusdays on market $125,000 Active 1 DOM
-
2026-06-03days on market $125,000 Coming Soon 2 DOM
-
2026-06-02remarks 687-char remark
-
2026-06-02$125,000 Coming Soon 1 DOM
ⓘ Source: listings_history table (triggers on properties + properties_extension) + one-shot
backfill from property_details.listing_events for pre-trigger history.
Tax reassessment forecast MO · Resets to sale price
- Current annual tax
- $934 · $78/mo
- Projected year-2 tax
- $1,212 · $101/mo
- Expected delta
- +$279/yr (+$23/mo · 29.9%)
ⓘ Screening estimate from a state-policy table — verify with the county assessor before closing.
Climate risk First Street
- Flood 1/10 Low FEMA zone X (unshaded) · 0% chance over 30 yrs
- Wildfire 1/10 Low
- Heat 4/10 Moderate 7 d/yr ≥106°F today · 19 d/yr by 30 yrs out
- Wind 2/10 Low 100% chance of damaging wind over 30 yrs
- Air quality 3/10 Moderate 3 unhealthy d/yr today · 5 by 30 yrs out
Nearby sold comps map
Loading sold comps map…
Walkable amenities ~0.75 mi
Loading nearby amenities…
Taxation est. · year 1
- Rental income
- $17,301
- − Mortgage interest
- −$7,002
- − Property taxes
- −$934
- − Insurance
- −$625
- − Repairs & maintenance
- −$1,384
- − Management
- −$1,384
- − Depreciation
- −$3,636
- Taxable income
- $2,336
- Est. tax owed @ 24.0%
- −$561
- After-tax cash flow
- $3,682/yr
For passive investors: Depreciation is non-cash, so a rental often shows a tax loss while cash-flowing — sheltering income. Rental losses are passive: they offset passive income freely, and up to $25,000/yr can offset ordinary (W-2) income if you actively participate and your MAGI is under $100k (phasing out to $0 by $150k); unused losses carry forward. On sale, claimed depreciation is recaptured at up to 25%, and gains may owe capital-gains tax (a 1031 exchange can defer both). Figures are a year-1 estimate at your 24.0% rate — not tax advice; consult a CPA.
Schools (NCES district)
- District
- Ferguson-Florissant R-II
- NCES district ID
- 2912010
- Math proficiency
- 7% ▼ -9.00%
- Reading proficiency
- 20% ▼ -6.00%
- Median HH income
- $44,610
- Composite
- 11.96/100
- National rank
- #9666
- State rank
- #311 of 324 in MO
Livability — Hazelwood
- Score
- 62/100
- State rank
- #395
- US rank
- #16956
Category grades
Schools grade is shown separately in the Schools card above.
Census & demographics
- Census place
- Hazelwood, MO
- County
- Saint Louis County · 888,823 people
- City population
- 17,813
- Metro
- St. Louis, MO-IL
- Population (ZIP)
- 18,381
- Household income
- $52,328
- Rent vs Own
- Severe rent burden
- 957.0
Population outlook (St. Louis County) Hauer SSP2
- Today (2025)
- 1,025,227 people
- By 2030
- 1,028,023 · +0.3%
- By 2040
- 1,020,940 · -0.4%
- By 2050
- 1,007,280 · -1.8%
- By 2075
- 987,277 · -3.7%
- By 2100
- 921,984 · -10.1%
Race, ethnicity, and origin ACS 2023
- Neighborhood character
- Predominantly Black (66%)
- Race & ethnicity
- Black 66% White 28% Two or more races 3% Hispanic / Latino 2%
- Common ancestry
- Lithuanian 1% Iranian 1% Romanian 1%
- Foreign-born
- 1% · Canada
- Languages at home
- 95% English-only · Spanish 4%
Political lean MEDSL · St. Louis
- 2024 margin
- Strong D (+23.4) · D 60.8% · R 37.4% · Other 1.7%
- 2008→2024 swing
- +3.5pp toward D · 2008: 19.9pp · 2024: 23.4pp
- All cycles
- 2024: D+23.4 2020: D+24.0 2016: D+16.2 2012: D+13.7 2008: D+19.9
Not yet ingested
- Civics
- —
Market trends
- HPI YoY
- ▼ -152.56%
- Current HPI
- 138.6781
- Rent YoY
- ▲ 9.03%
- Metro
- St. Louis, MO-IL
- State GDP YoY
- ▲ 1.84%
- F500 in state
- 20
Industry mix (Fortune 500 HQ in MO)
| Industry | F500 HQs | Revenue |
|---|---|---|
| Healthcare | 1 | $163B |
|
||
| Insurance | 1 | $21B |
|
||
| Industrial Technology | 1 | $17B |
|
||
| Retail | 1 | $16B |
|
||
| Industrial Distribution | 1 | $10B |
|
||
| Utilities | 1 | $9B |
|
||
Price history
+262.3% since first listed8 events — show timeline
- 2026-06-01 Coming Soon $125,000 MARIS as Distributed by MLS Grid
- 2023-08-22 Sold (MLS) — MARIS as Distributed by MLS Grid
- 2023-08-01 Pending — MARIS as Distributed by MLS Grid
- 2023-07-06 Listed $48,500 MARIS as Distributed by MLS Grid
- 2022-02-23 Sold (Public Records) $47,852 Public Records
- 2013-09-19 Sold (Public Records) $365,000 Public Records
- 2005-08-05 Sold (Public Records) $317,500 Public Records
- 2000-12-15 Sold (Public Records) $34,500 Public Records
Property tax history
+9.5%/yrLatest (2022): $934 · +0.5% YoY. Source: county tax records.
Cash-flow waterfall
monthlySold comps — $/sqft
last 12 mo · ≤1 miLoading sold comps…