128 1/2 Main · Augusta, KS
Flood risk 1/10 · Minimal
- FEMA flood zone
- X (unshaded)
- Chance of flooding over 30 yrs
- 0.0%
- Est. flood insurance / yr
- $507 – $1,088
Fire risk 7/10 · Major
- Est. fire insurance / yr
- $1,154 – $2,142
Heat risk 5/10 · Moderate
- Hot days now (above 106°F)
- 7 days/yr
- Hot days in 30 yrs
- 18 days/yr
Wind risk 2/10 · Minimal
- Chance of severe wind over 30 yrs
- —
Air-quality risk 2/10 · Minimal
- Unhealthy air days now
- 2 days/yr
- Unhealthy air days in 30 yrs
- 2 days/yr
Risk factors via First Street. Map © Google.
Why this score? — see what drove the B- grade
The composite is a weighted blend of 9 inputs, each scored 0–100. Each bar is that input's sub-score; the figure is the points it added to the 100-point composite (weight × sub-score).
- Cash flow +30.0/30.0
- 1% rule +10.0/10.0
- DSCR +10.0/10.0
- ARV discount +7.5/15.0
- Livability +3.1/5.0
- Schools +2.8/10.0
- Rent growth +2.5/5.0
- Condition / age +1.0/5.0
- Appreciation +0.0/10.0
$31,000
🖨 Deal sheet 📄 Offer letter ✓ Due diligence
Key facts
- 9,147 sq ft lot
- Built 1920
- Listed 6 days
Property features AI
Exterior
- Utilities: Natural gas available; Public water; Sewer available
- Home design: Single-family onsite built
- Construction: Cellar foundation
- Exterior features: One-level layout; Composition roof
Interior
- Bathrooms: 1 full bathroom
- Heating & cooling: Central air conditioning; Forced air heating
- Interior features: Cellar basement
- Laundry & utility: No laundry hookups listed
Neighborhood map
What this means for you Summary
Snapshot
- This is a 1-bed/1.0-bath single-family listed at $31k. Condition is rated poor.
Deal economics
- At list price, monthly cash flow is $578 ($7k/yr) — positive.
- The deal already cash-flows at list — no discount required.
- Meets the 1% rule at list price ($1k rent vs $31k).
Location & tenants
- Location reads 61/100 on livability (#413 in KS) — a middle-class / working-renter tenant base. Strengths: cost of living A+, housing A+; Watch: employment D+, amenities F, commute F.
- Augusta (town): math 28% / reading 36% proficiency, ranked #87 of 169 in KS (top 52%) — families likely to look elsewhere, expect single-tenant / working-renter base with shorter leases.
- Zoned schools: Garfield Elem (math 47% / reading 57%, grade C-, #131 of 684 statewide, top 23%, 259 students, 44% FRL); Augusta Middle School (math 20% / reading 31%, grade F, #104 of 219 statewide, top 49%, 453 students, 44% FRL); Augusta Sr High (math 22% / reading 27%, grade F, #105 of 327 statewide, top 49%, 634 students, 38% FRL).
- Market conditions: 103 active listings in the ZIP; 235 units permitted in Butler County in 2024 (0 in 5+ unit buildings).
Forward outlook
- Local home prices are declining (-3.0%/yr); year-one equity from $214 of loan paydown is wiped out by about $930 of value loss. Plan a longer hold.
- At projected returns (-3.0% appreciation + 3.0% rent growth), your $9k cash investment doubles in ~2 years — after that, you're playing with house money.
Negotiation context
- Only 6 days on market — expect competitive offers; lowballing is unlikely to land.
Risks & watch-outs
- Watch-outs: built in 1920 — expect roof / HVAC / electrical / plumbing capex.
- Climate carrying-cost: major wildfire risk; extreme-heat days projected 7→18/yr by 2055 (HVAC capex compounding) — expect insurance premiums to compound above CPI over the hold.
Questions for the listing agent
- Have any recent inspections been done? Can we get a copy of the seller's disclosures and any deferred-maintenance estimates?
- Built in 1920 — when were the roof, HVAC, electrical panel, plumbing, and water heater last replaced?
- Is there a deadline driving the sale (1031 exchange, divorce, estate, relocation)? That informs how much negotiation room exists.
- What's the average days-on-market for RENTAL listings here right now (not sales)? A rising rental-DOM trend means longer vacancies and softer asking-rent achievability than the comps imply.
- What's the recent tenant-quality profile in this submarket — average credit score on applications, eviction rate, late-payment / NSF rate, and stable-employment percentage? A property-management company in the area should have these aggregated.
- How much new for-sale + rental construction is in the pipeline within 1–3 miles? Heavy new supply typically softens prices + rents 12–24 months out; constrained supply supports both.
Investment metrics
- 1% rule
- 3.23% ✓
- Cap rate
- 28.65%
- Cash-on-cash
- 79.86%
- DSCR
- 4.55
- GRM
- 2.6
CMA / ARV
No comps found within radius.
Projected returns pro-forma
-3.0% appreciation · 3.0% rent growth · sell at horizon
- IRR
- 80.0%
- Equity multiple
- 4.66×
- Total profit
- $31,781
- Equity at exit
- $4,622
- IRR
- 83.5%
- Equity multiple
- 9.65×
- Total profit
- $75,109
- Equity at exit
- $2,680
Cash invested: $8,680 (down + closing). Projections, not guarantees.
Landlord ↔ Tenant lean methodology
- Overall (STATE)
- 83 Strongly Landlord-Friendly
- State Kansas
- 83 Strongly Landlord-Friendly · R+10
- County
- — inherits STATE
- City
- — inherits STATE
ZIP-level market 67060
- Home prices YoY
- -23.0%
- Active inventory
- 103
- Price-to-rent
- 2.6×
Monthly cashflow live
- Estimated rent
- $1,002 medium interval (Pro) →
- Mortgage (P&I)
- −$163
- Tax est. 1.5%
- −$39 /mo · $465/yr
- Insurance
- −$13
- HOA
- −$0
- Vacancy / Maint / Mgmt
- −$210
- Net cashflow
- $578
Break-even live
UW: 25.0% down · 7.5% · 30yr · 1.5% tax · 5.0% vac · 8.0% maint · 8.0% mgmt
Financing live
Cash to close
- Down payment
- $7,750
- Closing costs
- $930
- Reserves months
- —
- Total cash needed
- —
Loan-product check · same deal, 3 products live
Conventional
25% down · 7.5% · 30yr
- Down + closing
- —
- Monthly P&I
- —
- Monthly cashflow
- —
- DSCR
- —
- Eligible?
- —
Personal DTI + credit; lowest rate.
DSCR
20% down · 8.5% · 30yr
- Down + closing
- —
- Monthly P&I
- —
- Monthly cashflow
- —
- DSCR
- —
- Eligible?
- —
No personal income docs; deal must DSCR.
Hard money
10% down · 12.0% · 12mo
- Down + closing
- —
- Monthly P&I
- —
- Monthly cashflow
- —
- DSCR
- —
- Eligible?
- —
Short-term bridge; refi at stabilization.
Listing history 5 events
-
2026-06-18days on market $31,000 Active 6 DOM
-
2026-06-17days on market $31,000 Active 5 DOM
-
2026-06-16days on market $31,000 Active 4 DOM
-
2026-06-15days on market $31,000 Active 3 DOM
-
2026-06-13$31,000 Active 1 DOM
ⓘ Source: listings_history table (triggers on properties + properties_extension) + one-shot
backfill from property_details.listing_events for pre-trigger history.
Climate risk First Street
- Flood 1/10 Low FEMA zone X (unshaded) · 0% chance over 30 yrs
- Wildfire 7/10 Severe
- Heat 5/10 Major 7 d/yr ≥106°F today · 18 d/yr by 30 yrs out
- Wind 2/10 Low
- Air quality 2/10 Low 2 unhealthy d/yr today · 2 by 30 yrs out
Nearby sold comps map
Loading sold comps map…
Walkable amenities ~0.75 mi
Loading nearby amenities…
Taxation est. · year 1
- Rental income
- $12,028
- − Mortgage interest
- −$1,736
- − Property taxes
- −$465
- − Insurance
- −$155
- − Repairs & maintenance
- −$962
- − Management
- −$962
- − Depreciation
- −$902
- Taxable income
- $6,845
- Est. tax owed @ 24.0%
- −$1,643
- After-tax cash flow
- $5,289/yr
For passive investors: Depreciation is non-cash, so a rental often shows a tax loss while cash-flowing — sheltering income. Rental losses are passive: they offset passive income freely, and up to $25,000/yr can offset ordinary (W-2) income if you actively participate and your MAGI is under $100k (phasing out to $0 by $150k); unused losses carry forward. On sale, claimed depreciation is recaptured at up to 25%, and gains may owe capital-gains tax (a 1031 exchange can defer both). Figures are a year-1 estimate at your 24.0% rate — not tax advice; consult a CPA.
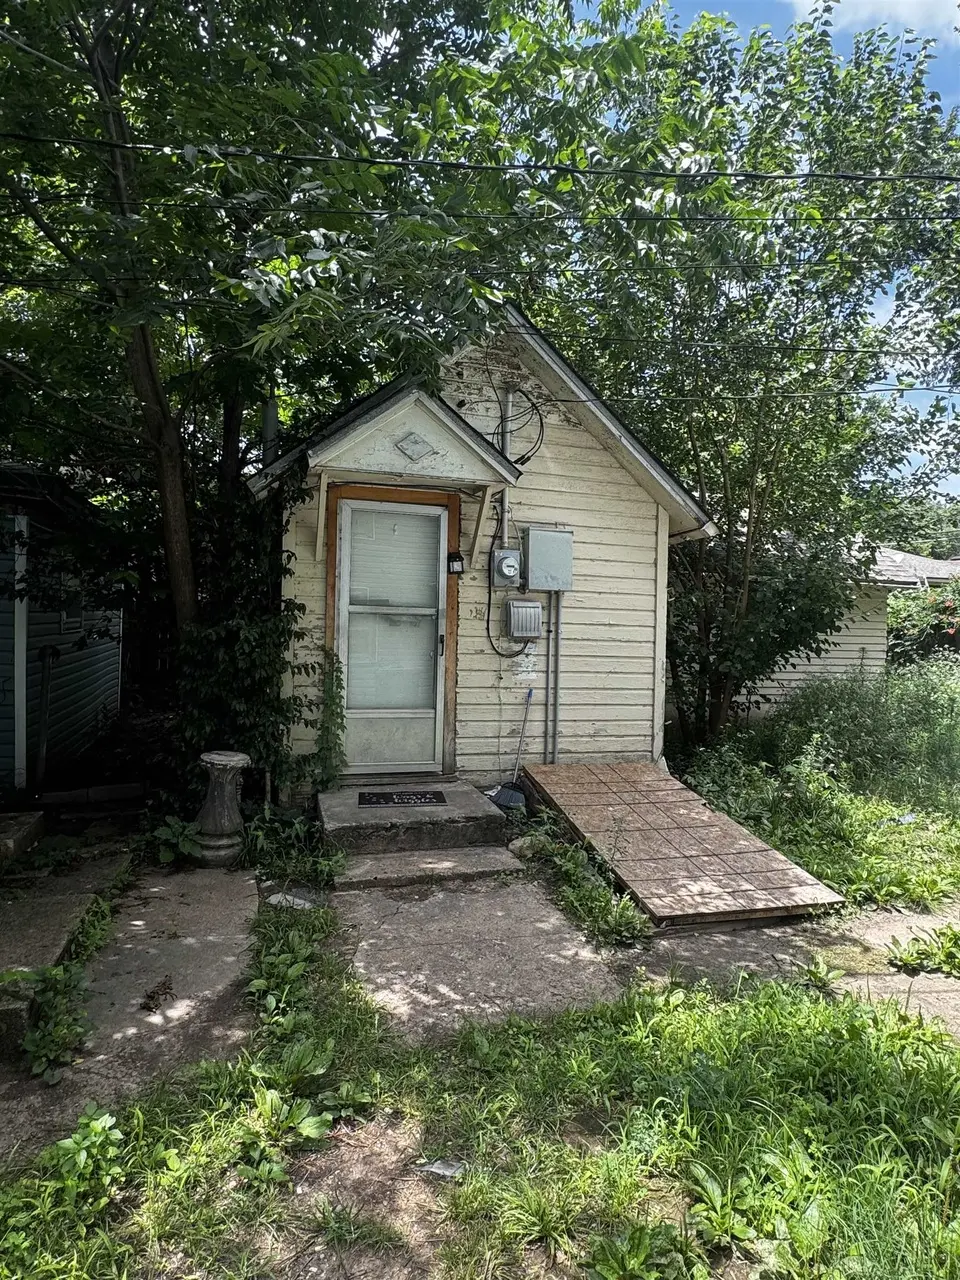
Condition & rehab AI · 1 photo
This property requires extensive repairs and maintenance, including structural repairs, landscaping, and HVAC updates. Significant improvements in these areas would significantly increase its resale and rental value.
Repairs flagged
- Major exterior siding — Significant peeling and damage
- Major roof — Overgrown vegetation suggests potential issues
- Major HVAC/mechanicals — No visible condition, but vegetation suggests potential issues
- Major landscaping — Overgrown vegetation and unkempt appearance
Value-add opportunities
- Both landscaping and curb appeal — Improved appearance attracts buyers and renters
- Both HVAC/mechanicals — Functional HVAC improves comfort and energy efficiency
- Both exterior siding and roof — Structural repairs enhance safety and curb appeal
Renovation cost estimate screening
| Repair item | Severity | Est. cost |
|---|---|---|
| exterior siding · Significant peeling and damage | Major | $15,000–50,000 |
| roof · Overgrown vegetation suggests potential issues | Major | $15,000–50,000 |
| HVAC/mechanicals · No visible condition, but vegetation suggests potential issues | Major | $15,000–50,000 |
| landscaping · Overgrown vegetation and unkempt appearance | Major | $15,000–50,000 |
| Total estimated repair cost · 4 items | $60,000–200,000 |
Value-add ROI direction
- Both landscaping and curb appeal — Improved appearance attracts buyers and renters ↑
- Both HVAC/mechanicals — Functional HVAC improves comfort and energy efficiency ↑
- Both exterior siding and roof — Structural repairs enhance safety and curb appeal ↑
ⓘ Cost ranges are severity-bucket heuristics (US national rule-of-thumb). Get contractor quotes + a written scope before underwriting a rehab budget.
Schools (NCES district)
- District
- Augusta
- NCES district ID
- 2003630
- Math proficiency
- 28% ▼ -4.00%
- Reading proficiency
- 36% ▲ 1.00%
- Median HH income
- $48,893
- Composite
- 27.73/100
- National rank
- #6902
- State rank
- #87 of 169 in KS
Livability — Augusta
- Score
- 61/100
- State rank
- #413
- US rank
- #18057
Category grades
Schools grade is shown separately in the Schools card above.
Census & demographics
- Census place
- Augusta, KS
- Population (ZIP)
- 14,004
Population outlook (Butler County) Hauer SSP2
- Today (2025)
- 69,002 people
- By 2030
- 69,822 · +1.2%
- By 2040
- 70,461 · +2.1%
- By 2050
- 69,940 · +1.4%
- By 2075
- 68,666 · -0.5%
- By 2100
- 63,071 · -8.6%
Race, ethnicity, and origin ACS 2023
- Neighborhood character
- Predominantly White (84%)
- Race & ethnicity
- White 84% Hispanic / Latino 8% Two or more races 6% Pacific Islander 2% Black 1%
- Hispanic origin (detail)
- Mexican 5%
- Common ancestry
- Lithuanian 2% Italian 2% Slovak 2%
- Foreign-born
- 3% · Canada
- Languages at home
- 96% English-only · Spanish 2% Other Asian/Pacific 2%
Political lean MEDSL · Butler
- 2024 margin
- Solid R (+41.2) · D 28.4% · R 69.6% · Other 2.0%
- 2008→2024 swing
- -8.9pp toward R · 2008: -32.3pp · 2024: -41.2pp
- All cycles
- 2024: R+41.2 2020: R+41.5 2016: R+45.4 2012: R+41.8 2008: R+32.3
Not yet ingested
- Civics
- —
Market trends
- HPI YoY
- ▼ -72.95%
- Current HPI
- 244.4809
- Rent YoY
- —
- Metro
- —
- State GDP YoY
- —
- F500 in state
- 0
Price history
1 event — show timeline
- 2026-06-12 Listed $31,000 SCKMLS as Distributed by MLS Grid
Cash-flow waterfall
monthlySold comps — $/sqft
last 12 mo · ≤1 miLoading sold comps…