 Multi-family
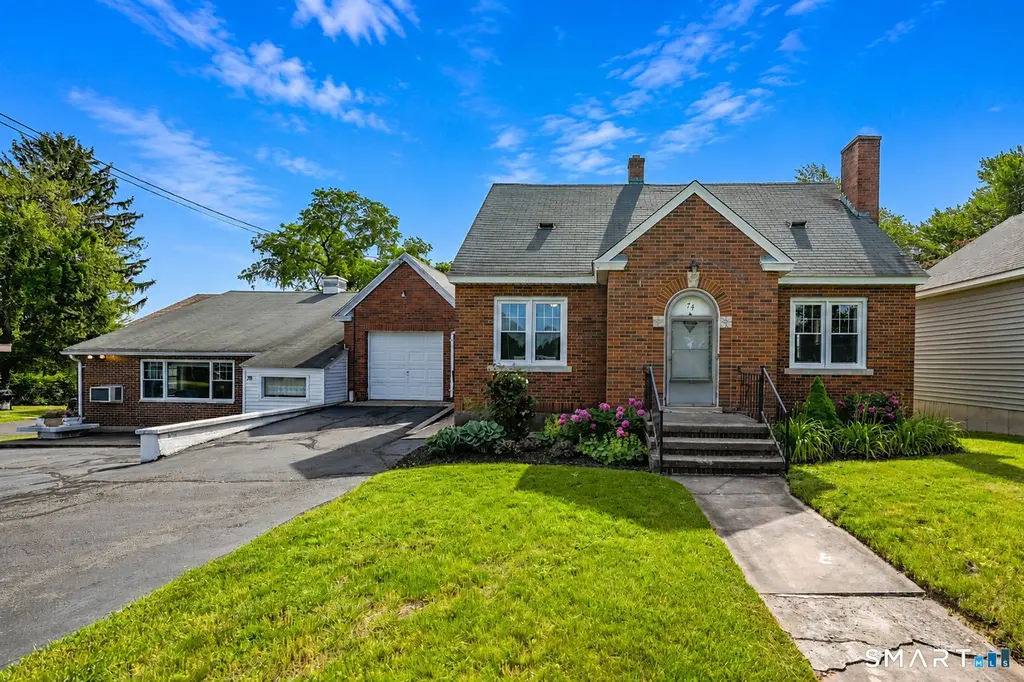
74 Johnson St · Middletown, CT
Flood risk No data
- FEMA flood zone
- —
- Chance of flooding over 30 yrs
- —
- Est. flood insurance / yr
- —
Fire risk No data
- Est. fire insurance / yr
- —
Heat risk No data
- Hot days now (above threshold)
- —
- Hot days in 30 yrs
- —
Wind risk No data
- Chance of severe wind over 30 yrs
- —
Air-quality risk No data
- Unhealthy air days now
- —
- Unhealthy air days in 30 yrs
- —
Risk factors via First Street. Map © Google.
Why this score? — see what drove the C- grade
The composite is a weighted blend of 9 inputs, each scored 0–100. Each bar is that input's sub-score; the figure is the points it added to the 100-point composite (weight × sub-score).
- Cash flow +19.9/30.0
- ARV discount +9.6/15.0
- DSCR +6.3/10.0
- 1% rule +5.3/10.0
- Livability +4.0/5.0
- Schools +3.0/10.0
- Rent growth +2.6/5.0
- Condition / age +2.5/5.0
- Appreciation +0.0/10.0
$375,000
🖨 Deal sheet 📄 Offer letter ✓ Due diligence
Multi-family units
County records classify this as Multi-Family (2-4 Unit). Listing-text estimate: 1 unit. estimate disagrees with records
Listing remarks MLS
Two separate brick houses (Cape-style and Ranch-style on one lot) classified as a two-family - ideal in-law set-up as well. Cape-style dwelling offers a front-to-back living rm / dining rm combination w/ hardwood flooring + remodeled half-bath on 1st floor & remodeled full bath on 2nd floor. Newer oil furnace & newer electric hot water heater (2011). Adjacent ranch-style dwelling - also in good condition offers a spacious eat-in kitchen + adjacent living rm/dining combination. 2 bedrooms (w/ a large Master bedroom) & full bath (2 showers: one w/ handicap access). Enclosed porches in both dwellings. 1-car garage plus large storage shed. New thermal windows throughout in both dwellings.
Key facts
- 8,712 sq ft lot
- Garage
- Built 1948
Property features AI
Exterior
- Parking: Attached garage (1-car)
- Utilities: Public water connected; Public sewer connected
- Home design: Multi-family property (2-family)
- Construction: Frame construction; Concrete foundation; Asphalt shingle gable roof
- Exterior features: Brick siding; Breezeway; Shed; Sloping lot
Interior
- Bedrooms: 5 bedrooms (total)
- Bathrooms: 2 full bathrooms; 1 half bathroom
- Heating & cooling: Hot water heating; Oil-fired heat (tank located in basement); Domestic hot water
- Interior features: One fireplace; Full, unfinished basement
- Laundry & utility: Washer and dryer provided in all units
Neighborhood map
What this means for you Summary
Snapshot
- This is a 5-bed/2.5-bath multifamily listed at $375k.
Deal economics
- At list price, monthly cash flow is $451 ($5k/yr) — positive.
- The deal already cash-flows at list — no discount required.
- Meets the 1% rule at list price ($4k rent vs $375k).
- Cap rate 7.7% vs local median 3.7% in Middletown — top-decile yield for the area; either an underpriced asset or a hidden risk that comps aren't pricing in. Stress-test before assuming the spread holds.
Location & tenants
- Location reads 81/100 on livability (#17 in CT, #1,390 nationally) — a professional / high-income tenant draw. Strengths: crime A+, amenities A+, health & safety A+; Watch: commute F.
- Middletown School District (urban): math 24% / reading 44% proficiency, ranked #113 of 153 in CT (top 74%) — families likely to look elsewhere, expect single-tenant / working-renter base with shorter leases.
- Zoned schools: Middletown High School (math 25% / reading 52%, grade F, #111 of 194 statewide, top 57%, 1,214 students, 49% FRL).
- Market conditions: Rents flat; 143 active listings in the ZIP; solid renter incomes; 278 units permitted in Lower Connecticut River Valley Planning Region in 2024 (89 in 5+ unit buildings).
- At $3,848/mo this rent would consume 58% of the median local household income ($79k/yr) (locally 2196% of renters already pay >50% of income on rent) — very limited rent-growth headroom before tenants either downsize or default.
Forward outlook
- Local home prices are declining (-3.0%/yr); year-one equity from $3k of loan paydown is wiped out by about $11k of value loss. Plan a longer hold.
Negotiation context
- Only 3 days on market — expect competitive offers; lowballing is unlikely to land.
- 10 sale attempts since 20y ago; this cycle's ask is 72% above the opening price — seller raised mid-cycle; expect resistance to lowballs.
- Current owner paid $225k; list at $375k implies a 67% gain — meaningful room to come down on a strong offer.
Risks & watch-outs
- Watch-outs: built in 1948 — expect roof / HVAC / electrical / plumbing capex.
Questions for the listing agent
- Built in 1948 — when were the roof, HVAC, electrical panel, plumbing, and water heater last replaced?
- Is there a deadline driving the sale (1031 exchange, divorce, estate, relocation)? That informs how much negotiation room exists.
- What's the average days-on-market for RENTAL listings here right now (not sales)? A rising rental-DOM trend means longer vacancies and softer asking-rent achievability than the comps imply.
- What's the recent tenant-quality profile in this submarket — average credit score on applications, eviction rate, late-payment / NSF rate, and stable-employment percentage? A property-management company in the area should have these aggregated.
- How much new apartment / multifamily construction is in the pipeline within 1–3 miles? Heavy new supply (>2% of stock underway) typically softens rents 12–24 months out; light construction supports rent growth.
Investment metrics
- 1% rule
- 1.03% ✓
- Cap rate
- 7.74%
- Cash-on-cash
- 5.16%
- DSCR
- 1.23
- GRM
- 8.1
CMA / ARV
- ARV (on-the-fly)
- $393,024
- Comps found
- 12
Show comp detail 12 sales within ~0.75 mi
| Address | Dist | Beds/Ba | Sqft | Sold | Price | $/sf | Match |
|---|---|---|---|---|---|---|---|
| 634 High St | 0.05mi | 5/3.0 | 2,947 (+4%) | 7mo | $440,000 | $149 | 84 |
| 40 Rome Ave | 0.27mi | 5/3.0 | 2,870 (+1%) | 6mo | $388,000 | $135 | 79 |
| 233 Pearl St | 0.35mi | 5/2.0 | 3,004 (+6%) | 11mo | $295,000 | $98 | 63 |
| 394 High St | 0.55mi | 5/2.0 | 2,953 (+4%) | 7mo | $387,000 | $131 | 61 |
| 24 Saint Johns St | 0.39mi | 6/3.0 (+1) | 2,640 (-7%) | 3mo | $411,000 | $156 | 60 |
| 23 Portland St | 0.40mi | 6/3.0 (+1) | 2,622 (-8%) | 8mo | $320,000 | $122 | 54 |
| 132 Grand St | 0.39mi | 6/3.0 (+1) | 3,226 (+13%) | 3mo | $455,000 | $141 | 50 |
| 24 Bacon Ave | 0.38mi | 6/3.0 (+1) | 2,606 (-8%) | 13mo | $355,000 | $136 | 50 |
| 35 Clinton Ave | 0.34mi | 6/3.0 (+1) | 2,480 (-13%) | 10mo | $407,000 | $164 | 47 |
| 48 Jackson St | 0.66mi | 6/3.0 (+1) | 2,769 (-3%) | 13mo | $475,000 | $172 | 46 |
| 171 Lincoln St | 0.56mi | 6/2.0 (+1) | 3,121 (+10%) | 11mo | $430,000 | $138 | 42 |
| 195 Liberty St | 0.52mi | 6/2.0 (+1) | 2,434 (-14%) | 7mo | $291,000 | $120 | 39 |
Match score weights: distance 35% · size 25% · config 20% · recency 20%. Top-matched comps best support the ARV.
Projected returns pro-forma
-3.0% appreciation · 0.22% rent growth · sell at horizon
- IRR
- -11.5%
- Equity multiple
- 0.60×
- Total profit
- $-42,434
- Equity at exit
- $55,914
- IRR
- -6.9%
- Equity multiple
- 0.62×
- Total profit
- $-40,353
- Equity at exit
- $32,423
Cash invested: $105,000 (down + closing). Projections, not guarantees.
Landlord ↔ Tenant lean methodology
- Overall (STATE)
- 27 Tenant-Leaning
- State Connecticut
- 27 Tenant-Leaning · D+7
- County
- — inherits STATE
- City
- — inherits STATE
ZIP-level market 06457
- Rents YoY
- 0.2%
- Active inventory
- 143
- Price-to-rent
- 16.9×
Monthly cashflow live
- Estimated rent
- $3,848 high interval (Pro) →
- Mortgage (P&I)
- −$1,967
- Tax from tax record
- −$466 /mo · $5,589/yr
- Insurance
- −$156
- HOA
- −$0
- Vacancy / Maint / Mgmt
- −$808
- Net cashflow
- $451
Break-even live
2-unit breakdown (identical units grouped — click to expand)
| Units | Beds | Baths | Est. rent |
|---|---|---|---|
| 1× unit | 2 | 1.5 | $1,849 |
| 1× unit | 3 | 1.5 | $1,999 |
| Total (2 units) | $3,848 | ||
UW: 25.0% down · 7.5% · 30yr · 1.5% tax · 5.0% vac · 8.0% maint · 8.0% mgmt
Financing live
Cash to close
- Down payment
- $93,750
- Closing costs
- $11,250
- Reserves months
- —
- Total cash needed
- —
Loan-product check · same deal, 3 products live
Conventional
25% down · 7.5% · 30yr
- Down + closing
- —
- Monthly P&I
- —
- Monthly cashflow
- —
- DSCR
- —
- Eligible?
- —
Personal DTI + credit; lowest rate.
DSCR
20% down · 8.5% · 30yr
- Down + closing
- —
- Monthly P&I
- —
- Monthly cashflow
- —
- DSCR
- —
- Eligible?
- —
No personal income docs; deal must DSCR.
Hard money
10% down · 12.0% · 12mo
- Down + closing
- —
- Monthly P&I
- —
- Monthly cashflow
- —
- DSCR
- —
- Eligible?
- —
Short-term bridge; refi at stabilization.
Listing history 6 events
-
2026-06-15statusdays on market $375,000 Under Contract 3 DOM
-
2026-06-13days on market $375,000 Active 2 DOM
-
2026-06-13statusdays on market $375,000 Active 1 DOM
-
2026-06-10days on market $375,000 Coming Soon 2 DOM
-
2026-06-08remarks 699-char remark
-
2026-06-08$375,000 Coming Soon 1 DOM
ⓘ Source: listings_history table (triggers on properties + properties_extension) + one-shot
backfill from property_details.listing_events for pre-trigger history.
Tax reassessment forecast CT · Partial reset (capped growth)
- Current annual tax
- $5,589 · $466/mo
- Projected year-2 tax
- $6,807 · $567/mo
- Expected delta
- +$1,218/yr (+$102/mo · 21.8%)
ⓘ Screening estimate from a state-policy table — verify with the county assessor before closing.
Nearby sold comps map
Loading sold comps map…
Walkable amenities ~0.75 mi
Loading nearby amenities…
Taxation est. · year 1
- Rental income
- $46,176
- − Mortgage interest
- −$21,006
- − Property taxes
- −$5,589
- − Insurance
- −$1,875
- − Repairs & maintenance
- −$3,694
- − Management
- −$3,694
- − Depreciation
- −$10,909
- Taxable loss
- −$591
- Est. tax savings @ 24.0%
- +$142
- After-tax cash flow
- $5,558/yr
For passive investors: Depreciation is non-cash, so a rental often shows a tax loss while cash-flowing — sheltering income. Rental losses are passive: they offset passive income freely, and up to $25,000/yr can offset ordinary (W-2) income if you actively participate and your MAGI is under $100k (phasing out to $0 by $150k); unused losses carry forward. On sale, claimed depreciation is recaptured at up to 25%, and gains may owe capital-gains tax (a 1031 exchange can defer both). Figures are a year-1 estimate at your 24.0% rate — not tax advice; consult a CPA.
Schools (NCES district)
- District
- Middletown School District
- NCES district ID
- 0902490
- Math proficiency
- 24% ▼ -15.00%
- Reading proficiency
- 44% ▼ -8.00%
- Median HH income
- $60,733
- Composite
- 30.47/100
- National rank
- #6224
- State rank
- #113 of 153 in CT
Livability — Middletown
- Score
- 81/100
- State rank
- #17
- US rank
- #1390
Category grades
Schools grade is shown separately in the Schools card above.
Census & demographics
- Census place
- Middletown, CT
- County
- Middlesex County · 63,941 people
- City population
- 46,720
- Metro
- Hartford-East Hartford-Middletown, CT
- Population (ZIP)
- 46,720
- Household income
- $79,463
- Rent vs Own
- Severe rent burden
- 2196.0
Population outlook (Lower Connecticut River Valley County) Hauer SSP2
- By 2040
- 188,651
Race, ethnicity, and origin ACS 2023
- Neighborhood character
- Majority White (65%)
- Race & ethnicity
- White 65% Black 13% Hispanic / Latino 12% Two or more races 9% Asian 5%
- Hispanic origin (detail)
- Mexican 1% Puerto Rican 7%
- Common ancestry
- Romanian 9% Lithuanian 5% Slovak 2%
- Foreign-born
- 12% · Canada, China
- Languages at home
- 82% English-only · Spanish 6% Other Indo-European 4% Russian/Polish/Slavic 2%
Political lean MEDSL · Lower Connecticut River Valley
- 2024 margin
- D (+13.4) · D 55.9% · R 42.4% · Other 1.7%
- All cycles
- 2024: D+13.4
Not yet ingested
- Civics
- —
Market trends
- HPI YoY
- ▼ -470.20%
- Current HPI
- 255.1597
- Rent YoY
- ▲ 0.22%
- Metro
- Hartford-East Hartford-Middletown, CT
- State GDP YoY
- ▲ 1.06%
- F500 in state
- 38
Industry mix (Fortune 500 HQ in CT)
| Industry | F500 HQs | Revenue |
|---|---|---|
| Industrial Machinery | 4 | $38B |
|
||
| Insurance | 3 | $71B |
|
||
| Financial Services | 2 | $25B |
|
||
| Transportation / Logistics | 2 | $18B |
|
||
| Healthcare | 1 | $247B |
|
||
| Telecommunications | 1 | $55B |
|
||
Price history
+13.6% since first listed24 events — show timeline
- 2026-06-08 Coming Soon $375,000 Smart MLS
- 2018-12-03 Sold (Public Records) $225,200 Public Records
- 2018-11-29 Sold (MLS) $228,700 Smart MLS
- 2018-10-04 Listing Removed — Smart MLS
- 2018-10-04 Listing Removed — Smart MLS
- 2018-10-01 Relisted — Smart MLS
- 2018-10-01 Relisted — Smart MLS
- 2018-09-24 Contingent — Smart MLS
- 2018-09-24 Contingent — Smart MLS
- 2018-09-14 Listed $217,900 Smart MLS
- 2018-09-14 Listed $217,900 Smart MLS
- 2010-06-17 Sold (Public Records) $200,800 Public Records
- 2010-06-17 Sold (MLS) $200,800 Smart MLS
- 2010-03-29 Listed $215,000 Smart MLS
- 2010-02-06 Listing Removed — Smart MLS
- 2010-02-06 Listing Removed — Smart MLS
- 2009-04-05 Listed $264,900 Smart MLS
- 2009-04-05 Listed $264,900 Smart MLS
- 2008-11-06 Listing Removed — Smart MLS
- 2008-11-06 Listing Removed — Smart MLS
- 2008-02-04 Listed $299,900 Smart MLS
- 2008-02-04 Listed $299,900 Smart MLS
- 2006-11-25 Listing Removed — Smart MLS
- 2006-08-25 Listed $330,000 Smart MLS
Property tax history
-2.0%/yrLatest (2022): $5,589 · +0.0% YoY. Source: county tax records.
Cash-flow waterfall
monthlySold comps — $/sqft
last 12 mo · ≤1 miLoading sold comps…