29127 Dandelion Sky Dr · Houston, TX
Flood risk 1/10 · Minimal
- FEMA flood zone
- X (unshaded)
- Chance of flooding over 30 yrs
- 0.0%
- Est. flood insurance / yr
- $507 – $1,088
Fire risk 6/10 · Moderate
- Est. fire insurance / yr
- $1,222 – $2,270
Heat risk 8/10 · Major
- Hot days now (above 111°F)
- 7 days/yr
- Hot days in 30 yrs
- 21 days/yr
Wind risk 9/10 · Severe
- Chance of severe wind over 30 yrs
- 99.0%
Air-quality risk 2/10 · Minimal
- Unhealthy air days now
- 1 days/yr
- Unhealthy air days in 30 yrs
- 1 days/yr
Risk factors via First Street. Map © Google.
Why this score? — see what drove the D grade
The composite is a weighted blend of 9 inputs, each scored 0–100. Each bar is that input's sub-score; the figure is the points it added to the 100-point composite (weight × sub-score).
- ARV discount +10.4/15.0
- Cash flow +9.6/30.0
- Condition / age +4.0/5.0
- Livability +3.7/5.0
- 1% rule +3.2/10.0
- Appreciation +2.9/10.0
- Schools +2.9/10.0
- DSCR +2.7/10.0
- Rent growth +1.6/5.0
$234,900
🖨 Deal sheet (PDF) 📄 Offer letter ✓ Due diligence
Listing remarks MLS
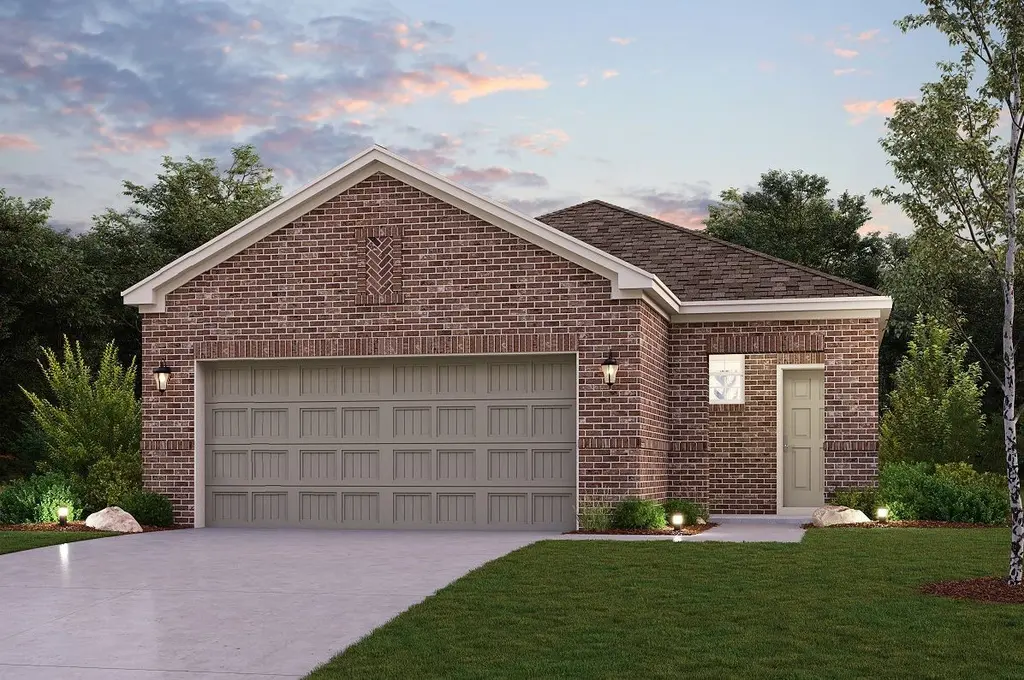
The Aspen - With 1388 Square feet, the Aspen plan is a 3 bedroom/2 bath and offers ample space. 42" cabinets, stainless steel appliances, Whirlpool 5 burner gas range, microwave oven, and dishwasher are some of the features this home offers. Wait until you see the luxurious 5' tiled walk-in shower in the primary bedroom! With ceiling fans in the primary bedroom and great room, you'll stay cool and comfortable all year round. The tankless water heater, garage door opener, blinds, and keyless entry add extra convenience to your daily life.
Key facts
- Tiled walk-in shower
- Microwave oven
- Dishwasher
Tags
Neighborhood map
What this means for you Summary
Snapshot
- This is a 3-bed/2.0-bath single-family listed at $235k. Condition is rated good.
Deal economics
- At list price, monthly cash flow is $-160 ($-2k/yr) — negative.
- To cash-flow at today's rent, offer at most $212k (9.9% below list).
- To meet the 1% rule (rent ≥ 1% of price), the offer needs to be $192k (18.5% below list).
- Recommended offer: $192k (18.5% below list) — sets the bar for 1% rule.
- Cap rate 5.5% vs local median 3.2% in Houston — top-decile yield for the area; either an underpriced asset or a hidden risk that comps aren't pricing in. Stress-test before assuming the spread holds.
Location & tenants
- Location reads 74/100 on livability (#184 in TX, #4,771 nationally) — a middle-class / working-renter tenant base. Strengths: amenities A+, cost of living A+, housing A+; Watch: crime F.
- Waller ISD (rural): math 30% / reading 35% proficiency, ranked #532 of 826 in TX (top 64%) — families likely to look elsewhere, expect single-tenant / working-renter base with shorter leases.
- Zoned schools: Evelyn Turlington El (math 46% / reading 45%, grade D-, #1,112 of 4,322 statewide, top 26%, 1,084 students, 69% FRL); Waller J H (math 21% / reading 28%, grade F, #1,279 of 1,662 statewide, top 78%, 899 students, 69% FRL); Waller H S (math 25% / reading 40%, grade F, #1,029 of 1,632 statewide, top 64%, 2,639 students, 62% FRL).
- Market conditions: Rents falling (-3.8%/yr); 1196 active listings in the ZIP; 1 comparable units currently listed for rent nearby; solid renter incomes; 29,883 units permitted in Harris County in 2024 (8,621 in 5+ unit buildings).
Forward outlook
- Local home prices are declining (-3.0%/yr); year-one equity from $2k of loan paydown is wiped out by about $7k of value loss. Plan a longer hold.
- Harris County population projected at +47% by 2050 — long-run rental-demand tailwind backs the buy-and-hold thesis.
Negotiation context
- It's been on market 166 days — a 12% lower offer ($207k) is reasonable based on typical stale-listing flexibility.
- 2 sale attempts; this cycle's ask has dropped $19k (7%) from the opening price — seller is motivated, your offer sets the floor, not the list.
Risks & watch-outs
- Climate carrying-cost: severe wind risk, 99% chance of damaging wind over 30y; major wildfire risk; extreme-heat days projected 7→21/yr by 2055 (HVAC capex compounding) — expect insurance premiums to compound above CPI over the hold.
Questions for the listing agent
- What do current leases actually rent for vs. the listed asking? Can we see a recent rent roll and the last 12 months of T-12 income?
- It's been on market 166 days. Have you received any prior offers? Is the seller open to a 18% concession, seller financing, or rate buy-down credit?
- What does the HOA fee cover, when was the last increase, and are there any pending special assessments or reserve-fund shortfalls?
- Why hasn't it sold? Are there any deal-killer items the seller is aware of (foundation, flood, title, zoning, code violations)?
- Is there a deadline driving the sale (1031 exchange, divorce, estate, relocation)? That informs how much negotiation room exists.
- Schools are D-rated, which usually means shorter tenancies and higher turnover. Who's the typical renter profile here, and what's been the actual vacancy rate?
- Crime grade is F in this area — have there been break-ins, vandalism, or insurance claims at this property in the last 3 years? What carrier currently insures it and at what premium?
- The area grade is low — what's the realistic commute time and amenity access for the typical tenant pool here? Any planned neighborhood developments (good or bad) we should know about?
- What's the average days-on-market for RENTAL listings here right now (not sales)? A rising rental-DOM trend means longer vacancies and softer asking-rent achievability than the comps imply.
- What's the recent tenant-quality profile in this submarket — average credit score on applications, eviction rate, late-payment / NSF rate, and stable-employment percentage? A property-management company in the area should have these aggregated.
- How much new for-sale + rental construction is in the pipeline within 1–3 miles? Heavy new supply typically softens prices + rents 12–24 months out; constrained supply supports both.
Investment metrics
- 1% rule
- 0.82% ✗
- Cap rate
- 5.47%
- Cash-on-cash
- -2.92%
- DSCR
- 0.87
- GRM
- 10.2
CMA / ARV
- ARV (median comp)
- $251,290
- List price
- $234,900
- Delta
- -6.52%
- Verdict
- FAIR
- Comps
- 20 within 1.0 mi
Show comp detail 12 sales within ~0.75 mi
| Address | Dist | Beds/Ba | Sqft | Sold | Price | $/sf | Match |
|---|---|---|---|---|---|---|---|
| 17411 Sage Run Dr | 0.05mi | 3/2.0 | 1,388 (0%) | 2mo | $246,900 | $178 | 96 |
| 29131 Farmhouse Estates Dr | 0.06mi | 3/2.0 | 1,414 (+2%) | 2mo | $261,240 | $185 | 93 |
| 29219 Farmhouse Estates Dr | 0.08mi | 3/2.0 | 1,414 (+2%) | 1mo | $252,540 | $179 | 92 |
| 29202 Farmhouse Estates Dr | 0.08mi | 3/2.0 | 1,414 (+2%) | 2mo | $230,690 | $163 | 91 |
| 29215 Farmhouse Estates Dr | 0.08mi | 3/2.0 | 1,428 (+3%) | 0mo | $233,940 | $164 | 91 |
| 29207 Farmhouse Estates Dr | 0.07mi | 3/2.0 | 1,449 (+4%) | 2mo | $249,940 | $172 | 88 |
| 29134 Farmhouse Estates Dr | 0.08mi | 3/2.0 | 1,449 (+4%) | 2mo | $227,790 | $157 | 87 |
| 29123 Dandelion Sky Dr | 0.01mi | 4/2.0 (+1) | 1,582 (+14%) | 1mo | $273,900 | $173 | 71 |
| 29227 Farmhouse Estates Dr | 0.10mi | 4/2.0 (+1) | 1,565 (+13%) | 0mo | $250,040 | $160 | 69 |
| 29210 Farmhouse Estates Dr | 0.09mi | 4/2.0 (+1) | 1,565 (+13%) | 1mo | $260,040 | $166 | 69 |
| 29130 Farmhouse Estates Dr | 0.07mi | 4/2.0 (+1) | 1,565 (+13%) | 2mo | $241,040 | $154 | 69 |
| 29218 Farmhouse Estates Dr | 0.09mi | 4/2.0 (+1) | 1,565 (+13%) | 1mo | $241,040 | $154 | 68 |
Match score weights: distance 35% · size 25% · config 20% · recency 20%. Top-matched comps best support the ARV.
Projected returns pro-forma
-3.0% appreciation · 0.0% rent growth · sell at horizon
- IRR
- -24.7%
- Equity multiple
- 0.18×
- Total profit
- $-53,819
- Equity at exit
- $35,024
- IRR
- -33.2%
- Equity multiple
- -0.24×
- Total profit
- $-81,452
- Equity at exit
- $20,310
Cash invested: $65,772 (down + closing). Projections, not guarantees.
Landlord ↔ Tenant lean methodology
- Overall (STATE)
- 87 Strongly Landlord-Friendly
- State Texas
- 87 Strongly Landlord-Friendly · R+5
- County
- — inherits STATE
- City
- — inherits STATE
ZIP-level market 77484
- Home prices YoY
- -1.0%
- Rents YoY
- -3.8%
- Active inventory
- 1196
- Price-to-rent
- 10.2×
Monthly cashflow live
- Estimated rent
- $1,915 medium interval (Pro) →
- Mortgage (P&I)
- −$1,232
- Tax est. 1.5%
- −$294 /mo · $3,524/yr
- Insurance
- −$98
- HOA
- −$50
- Vacancy / Maint / Mgmt
- −$402
- Net cashflow
- $-160
Break-even live
Sensitivity live
| Price | -10% $2 | -5% $-79 | +0% $-160 | +5% $-241 | +10% $-323 |
|---|---|---|---|---|---|
| Rent | -10% $-311 | -5% $-236 | +0% $-160 | +5% $-85 | +10% $-9 |
| Rate | -1.0pp $-42 | -0.5pp $-100 | base $-160 | +0.5pp $-221 | +1.0pp $-283 |
UW: 25.0% down · 7.5% · 30yr · 1.5% tax · 5.0% vac · 8.0% maint · 8.0% mgmt
Financing live
Cash to close
- Down payment
- $58,725
- Closing costs
- $7,047
- Reserves months
- —
- Total cash needed
- —
Loan-product check · same deal, 3 products live
Conventional
25% down · 7.5% · 30yr
- Down + closing
- —
- Monthly P&I
- —
- Monthly cashflow
- —
- DSCR
- —
- Eligible?
- —
Personal DTI + credit; lowest rate.
DSCR
20% down · 8.5% · 30yr
- Down + closing
- —
- Monthly P&I
- —
- Monthly cashflow
- —
- DSCR
- —
- Eligible?
- —
No personal income docs; deal must DSCR.
Hard money
10% down · 12.0% · 12mo
- Down + closing
- —
- Monthly P&I
- —
- Monthly cashflow
- —
- DSCR
- —
- Eligible?
- —
Short-term bridge; refi at stabilization.
Rent comps 1 comps
| Address | Beds | Baths | Sqft | Rent | $/sqft | DOM | Units | Dist |
|---|---|---|---|---|---|---|---|---|
| 16315 Mesquite Field Dr Hockley, TX | 4.0 | 2.0 | 1500 | $2,600 | $1.73 | 45d | 1 | 1.25mi |
HOA detail
- Monthly dues
- $50 · $600/yr
- Likely covers
- watergaspool
Listing history 18 events
-
2026-06-21days on market $234,900 Active 166 DOM
-
2026-06-18days on market $234,900 Active 163 DOM
-
2026-06-17days on market $234,900 Active 162 DOM
-
2026-06-16days on market $234,900 Active 161 DOM
-
2026-06-15days on market $234,900 Active 160 DOM
-
2026-06-13pricedays on market $234,900 Active 158 DOM
-
2026-06-09days on market $249,900 Active 154 DOM
-
2026-06-08days on market $249,900 Active 153 DOM
-
2026-06-07days on market $249,900 Active 152 DOM
-
2026-06-04days on market $249,900 Active 149 DOM
-
2026-06-03days on market $249,900 Active 148 DOM
-
2026-06-02days on market $249,900 Active 147 DOM
-
2026-06-01days on market $249,900 Active 146 DOM
-
2026-05-31days on market $249,900 Active 145 DOM
-
2026-04-02price $249,900 548-char remark
Show marketing remark (355 chars)
The attractive Aspen plan centers around a large open kitchen, complete with an island and a built-in pantry. An airy great room—ideal for relaxing and entertaining—is steps away, as is a dining area. There are three spacious bedrooms, including a primary suite with a walk-in closet and a private bath with dual vanities and a walk-in shower.
-
2026-04-02price $249,900 355-char remark
Show marketing remark (355 chars)
The attractive Aspen plan centers around a large open kitchen, complete with an island and a built-in pantry. An airy great room—ideal for relaxing and entertaining—is steps away, as is a dining area. There are three spacious bedrooms, including a primary suite with a walk-in closet and a private bath with dual vanities and a walk-in shower.
-
2026-01-06$253,900 Active 355-char remark
Show marketing remark (355 chars)
The attractive Aspen plan centers around a large open kitchen, complete with an island and a built-in pantry. An airy great room—ideal for relaxing and entertaining—is steps away, as is a dining area. There are three spacious bedrooms, including a primary suite with a walk-in closet and a private bath with dual vanities and a walk-in shower.
-
2026-01-01$253,900 Active 548-char remark
Show marketing remark (548 chars)
The Aspen - With 1388 Square feet, the Aspen plan is a 3 bedroom/2 bath and offers ample space. 42" cabinets, stainless steel appliances, Whirlpool 5 burner gas range, microwave oven, and dishwasher are some of the features this home offers. Wait until you see the luxurious 5' tiled walk-in shower in the primary bedroom! With ceiling fans in the primary bedroom and great room, you'll stay cool and comfortable all year round. The tankless water heater, garage door opener, blinds, and keyless entry add extra convenience to your daily life.
ⓘ Source: listings_history table (triggers on properties + properties_extension) + one-shot
backfill from property_details.listing_events for pre-trigger history.
Climate risk First Street
- Flood 1/10 Low FEMA zone X (unshaded) · 0% chance over 30 yrs
- Wildfire 6/10 Major
- Heat 8/10 Severe 7 d/yr ≥111°F today · 21 d/yr by 30 yrs out
- Wind 9/10 Extreme 99% chance of damaging wind over 30 yrs
- Air quality 2/10 Low 1 unhealthy d/yr today · 1 by 30 yrs out
Nearby sold comps map
Loading sold comps map…
Walkable amenities ~0.75 mi
Loading nearby amenities…
Taxation est. · year 1
- Rental income
- $22,985
- − Mortgage interest
- −$13,158
- − Property taxes
- −$3,524
- − Insurance
- −$1,174
- − Repairs & maintenance
- −$1,839
- − Management
- −$1,839
- − HOA
- −$600
- − Depreciation
- −$6,833
- Taxable loss
- −$5,982
- Est. tax savings @ 24.0%
- +$1,436
- After-tax cash flow
- $-486/yr
For passive investors: Depreciation is non-cash, so a rental often shows a tax loss while cash-flowing — sheltering income. Rental losses are passive: they offset passive income freely, and up to $25,000/yr can offset ordinary (W-2) income if you actively participate and your MAGI is under $100k (phasing out to $0 by $150k); unused losses carry forward. On sale, claimed depreciation is recaptured at up to 25%, and gains may owe capital-gains tax (a 1031 exchange can defer both). Figures are a year-1 estimate at your 24.0% rate — not tax advice; consult a CPA.
Condition & rehab AI · 12 photos
This home is in good condition with a good condition score of 80. It has a modern kitchen and bathrooms, hardwood flooring, and a well-maintained exterior. The home is ready for a new owner and can be further enhanced with some exterior painting and landscaping improvements.
Value-add opportunities
- Resale Painting the exterior brick and siding — Enhances curb appeal and can increase the home's value.
- Resale Landscaping improvements — Enhances curb appeal and can increase the home's value.
- Both Adding smart home features — Improves convenience and can increase both resale and rental value.
- Resale Upgrading the kitchen appliances — Modernizes the kitchen and can increase the home's value.
- Resale Upgrading the bathrooms with modern fixtures — Modernizes the bathrooms and can increase the home's value.
Renovation cost estimate screening
Value-add ROI direction
- Resale Painting the exterior brick and siding — Enhances curb appeal and can increase the home's value. ↑
- Resale Landscaping improvements — Enhances curb appeal and can increase the home's value. ↑
- Both Adding smart home features — Improves convenience and can increase both resale and rental value. ↑
- Resale Upgrading the kitchen appliances — Modernizes the kitchen and can increase the home's value. ↑
- Resale Upgrading the bathrooms with modern fixtures — Modernizes the bathrooms and can increase the home's value. ↑
ⓘ Cost ranges are severity-bucket heuristics (US national rule-of-thumb). Get contractor quotes + a written scope before underwriting a rehab budget.
Schools (NCES district)
- District
- Waller ISD
- NCES district ID
- 4844430
- Math proficiency
- 30% ▼ -23.00%
- Reading proficiency
- 35% ▼ -11.00%
- Median HH income
- $58,911
- Composite
- 29.12/100
- National rank
- #6593
- State rank
- #532 of 826 in TX
Livability — Houston
- Score
- 74/100
- State rank
- #184
- US rank
- #4771
Category grades
Schools grade is shown separately in the Schools card above.
Census & demographics
- County
- Harris County · 4,702,590 people
- City population
- 3,226,434
- Metro
- Houston-The Woodlands-Sugar Land, TX
- Population (ZIP)
- 14,348
- Household income
- $81,250
- Rent vs Own
- Severe rent burden
- 270.0
Population outlook (Harris County) Hauer SSP2
- Today (2025)
- 5,571,493 people
- By 2030
- 6,089,821 · +9.3%
- By 2040
- 7,142,806 · +28.2%
- By 2050
- 8,185,864 · +46.9%
- By 2075
- 10,574,329 · +89.8%
- By 2100
- 12,109,958 · +117.4%
Race, ethnicity, and origin ACS 2023
- Neighborhood character
- Diverse neighborhood (Simpson 0.66)
- Race & ethnicity
- White 47% Hispanic / Latino 31% Two or more races 16% Black 15%
- Hispanic origin (detail)
- Mexican 30%
- Common ancestry
- Slovak 2% Serbian 2% Iranian 1%
- Foreign-born
- 13% · Canada
- Languages at home
- 73% English-only · Spanish 24% Arabic 2%
Political lean MEDSL · Harris
- 2024 margin
- Lean D (+5.5) · D 52.0% · R 46.4% · Other 1.6%
- 2008→2024 swing
- +3.9pp toward D · 2008: 1.6pp · 2024: 5.5pp
- All cycles
- 2024: D+5.5 2020: D+13.3 2016: D+12.4 2012: D+0.1 2008: D+1.6
Not yet ingested
- Civics
- —
Market trends
- HPI YoY
- ▼ -4.17%
- Current HPI
- 397.85
- Rent YoY
- ▼ -3.77%
- Metro
- Houston-The Woodlands-Sugar Land, TX
- State GDP YoY
- ▲ 3.95%
- F500 in state
- 110
Industry mix (Fortune 500 HQ in TX)
| Industry | F500 HQs | Revenue |
|---|---|---|
| Energy | 16 | $1,198B |
|
||
| Technology | 5 | $198B |
|
||
| Engineering / Construction | 4 | $72B |
|
||
| Energy Services | 3 | $60B |
|
||
| Utilities | 3 | $41B |
|
||
| Healthcare | 2 | $330B |
|
||
Price history
-1.6% since first listed4 events — show timeline
- 2026-04-02 Price Changed $249,900 Zillow
- 2026-04-02 Price Changed $249,900 HARMLS
- 2026-01-06 Listed $253,900 HARMLS
- 2026-01-01 Listed $253,900 Zillow
Cash-flow waterfall
monthlySold comps — $/sqft
last 12 mo · ≤1 miLoading sold comps…