 🏷️ Likely Rental
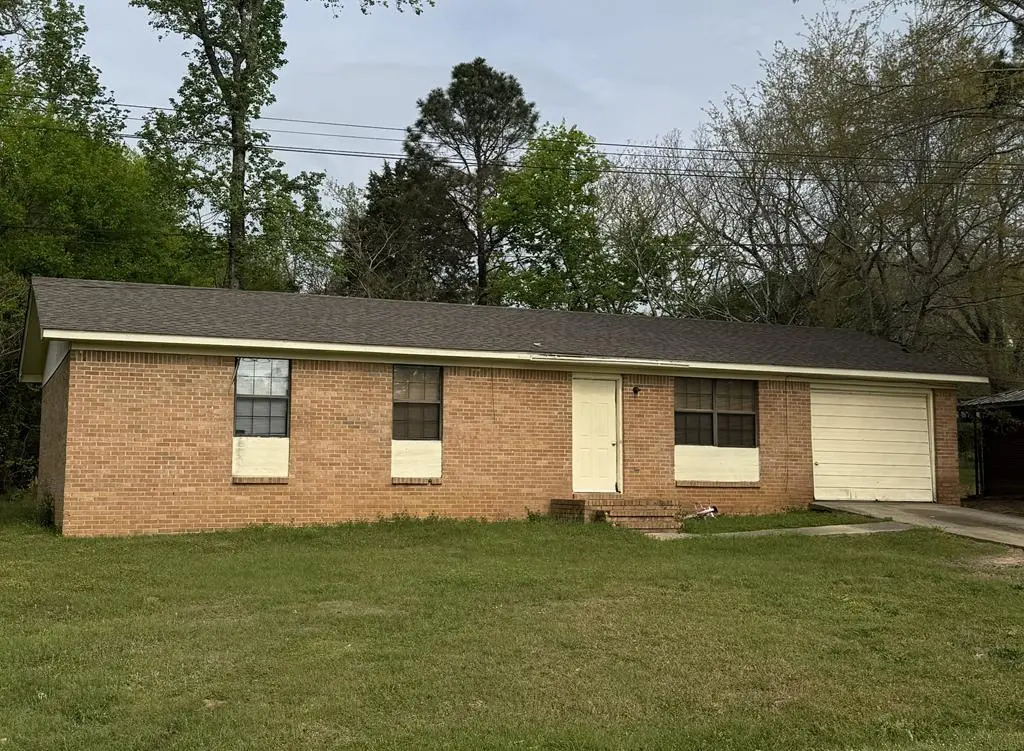
321 New Ft. Browder Rd · Eufaula, AL
Flood risk 1/10 · Minimal
- FEMA flood zone
- X (unshaded)
- Chance of flooding over 30 yrs
- 0.0%
- Est. flood insurance / yr
- $507 – $1,088
Fire risk 3/10 · Minor
- Est. fire insurance / yr
- $916 – $1,700
Heat risk 7/10 · Major
- Hot days now (above 107°F)
- 7 days/yr
- Hot days in 30 yrs
- 19 days/yr
Wind risk 8/10 · Major
- Chance of severe wind over 30 yrs
- 80.0%
Air-quality risk 1/10 · Minimal
- Unhealthy air days now
- 0 days/yr
- Unhealthy air days in 30 yrs
- 0 days/yr
Risk factors via First Street. Map © Google.
Why this score? — see what drove the B- grade
The composite is a weighted blend of 9 inputs, each scored 0–100. Each bar is that input's sub-score; the figure is the points it added to the 100-point composite (weight × sub-score).
- Cash flow +27.9/30.0
- ARV discount +15.0/15.0
- DSCR +9.9/10.0
- 1% rule +7.6/10.0
- Livability +2.6/5.0
- Rent growth +2.5/5.0
- Condition / age +2.2/5.0
- Schools +2.0/10.0
- Appreciation +0.0/10.0
$95,000
🖨 Deal sheet 📄 Offer letter ✓ Due diligence
Listing remarks MLS
Charming 3-bedroom, 1.5-bath brick home offering comfortable living in a convenient location. The property currently has a tenant in place, making it a great opportunity for investors seeking immediate rental income. Seller is a licensed Realtor
Key facts
- 0.27 acre lot
- Built 1973
- Listed 83 days
Neighborhood map
What this means for you Summary
Snapshot
- This is a 3-bed/1.5-bath single-family listed at $95k. Condition is rated fair.
Deal economics
- At list price, monthly cash flow is $291 ($3k/yr) — positive.
- The deal already cash-flows at list — no discount required.
- Meets the 1% rule at list price ($1k rent vs $95k).
- Recommended offer: $89k (6.0% below list) — sets the bar for market timing.
- Cap rate 10.0% vs local median 3.4% in Eufaula — top-decile yield for the area; either an underpriced asset or a hidden risk that comps aren't pricing in. Stress-test before assuming the spread holds.
Location & tenants
- Location reads 51/100 on livability (#508 in AL) — a working-class tenant base; expect higher turnover. Strengths: cost of living A+, housing B; Watch: schools F, crime F, amenities F.
- Eufaula City (rural): math 10% / reading 38% proficiency, ranked #100 of 129 in AL (top 78%) — low school quality limits family demand, transient renter base, plan for 1-2y turnover; 64% free/reduced lunch — lower-income household profile, screen leases tightly.
- Market conditions: 211 active listings in the ZIP; 1 comparable units currently listed for rent nearby; 34 units permitted in Barbour County in 2024 (0 in 5+ unit buildings).
Forward outlook
- Local home prices are declining (-3.0%/yr); year-one equity from $657 of loan paydown is wiped out by about $3k of value loss. Plan a longer hold.
- Barbour County population projected at -23% by 2050 — secular population decline; favor cash flow + early exit over multi-decade hold.
- At projected returns (-3.0% appreciation + 3.0% rent growth), your $27k cash investment doubles in ~9 years — after that, you're playing with house money.
Negotiation context
- It's been on market 84 days — a 6% lower offer ($89k) is reasonable based on typical stale-listing flexibility.
Risks & watch-outs
- Climate carrying-cost: severe wind risk, 80% chance of damaging wind over 30y; extreme-heat days projected 7→19/yr by 2055 (HVAC capex compounding) — expect insurance premiums to compound above CPI over the hold.
Questions for the listing agent
- It's been on market 84 days. Have you received any prior offers? Is the seller open to a 6% concession, seller financing, or rate buy-down credit?
- Have any recent inspections been done? Can we get a copy of the seller's disclosures and any deferred-maintenance estimates?
- Built in 1973 — when were the roof, HVAC, electrical panel, plumbing, and water heater last replaced?
- Why hasn't it sold? Are there any deal-killer items the seller is aware of (foundation, flood, title, zoning, code violations)?
- Is there a deadline driving the sale (1031 exchange, divorce, estate, relocation)? That informs how much negotiation room exists.
- Schools are F-rated, which usually means shorter tenancies and higher turnover. Who's the typical renter profile here, and what's been the actual vacancy rate?
- Crime grade is F in this area — have there been break-ins, vandalism, or insurance claims at this property in the last 3 years? What carrier currently insures it and at what premium?
- What's the average days-on-market for RENTAL listings here right now (not sales)? A rising rental-DOM trend means longer vacancies and softer asking-rent achievability than the comps imply.
- What's the recent tenant-quality profile in this submarket — average credit score on applications, eviction rate, late-payment / NSF rate, and stable-employment percentage? A property-management company in the area should have these aggregated.
- How much new for-sale + rental construction is in the pipeline within 1–3 miles? Heavy new supply typically softens prices + rents 12–24 months out; constrained supply supports both.
Investment metrics
- 1% rule
- 1.26% ✓
- Cap rate
- 9.97%
- Cash-on-cash
- 13.15%
- DSCR
- 1.59
- GRM
- 6.6
CMA / ARV
- ARV (median comp)
- $157,809
- List price
- $95,000
- Delta
- -39.80%
- Verdict
- UNDERPRICED
- Comps
- 10 within 1.0 mi
Show comp detail 3 sales within ~0.75 mi
| Address | Dist | Beds/Ba | Sqft | Sold | Price | $/sf | Match |
|---|---|---|---|---|---|---|---|
| 512 Holly Dr | 0.75mi | 3/1.5 | 1,800 (-0%) | 5mo | $119,000 | $66 | 60 |
| 323 Azalea Dr | 0.67mi | 3/2.0 | 1,804 (-0%) | 16mo | $195,000 | $108 | 53 |
| 540 Holly Dr | 0.66mi | 3/2.0 | 1,941 (+7%) | 11mo | $164,500 | $85 | 46 |
Match score weights: distance 35% · size 25% · config 20% · recency 20%. Top-matched comps best support the ARV.
Projected returns pro-forma
-3.0% appreciation · 3.0% rent growth · sell at horizon
- IRR
- 3.1%
- Equity multiple
- 1.12×
- Total profit
- $3,188
- Equity at exit
- $14,165
- IRR
- 12.7%
- Equity multiple
- 2.01×
- Total profit
- $26,754
- Equity at exit
- $8,214
Cash invested: $26,600 (down + closing). Projections, not guarantees.
Landlord ↔ Tenant lean methodology
- Overall (STATE)
- 90 Strongly Landlord-Friendly
- State Alabama
- 90 Strongly Landlord-Friendly · R+15
- County
- — inherits STATE
- City
- — inherits STATE
ZIP-level market 36027
- Home prices YoY
- -27.1%
- Active inventory
- 211
- Price-to-rent
- 6.6×
Monthly cashflow live
- Estimated rent
- $1,200 medium interval (Pro) →
- Mortgage (P&I)
- −$498
- Tax est. 1.5%
- −$119 /mo · $1,425/yr
- Insurance
- −$40
- HOA
- −$0
- Vacancy / Maint / Mgmt
- −$252
- Net cashflow
- $291
Break-even live
UW: 25.0% down · 7.5% · 30yr · 1.5% tax · 5.0% vac · 8.0% maint · 8.0% mgmt
Financing live
Cash to close
- Down payment
- $23,750
- Closing costs
- $2,850
- Reserves months
- —
- Total cash needed
- —
Loan-product check · same deal, 3 products live
Conventional
25% down · 7.5% · 30yr
- Down + closing
- —
- Monthly P&I
- —
- Monthly cashflow
- —
- DSCR
- —
- Eligible?
- —
Personal DTI + credit; lowest rate.
DSCR
20% down · 8.5% · 30yr
- Down + closing
- —
- Monthly P&I
- —
- Monthly cashflow
- —
- DSCR
- —
- Eligible?
- —
No personal income docs; deal must DSCR.
Hard money
10% down · 12.0% · 12mo
- Down + closing
- —
- Monthly P&I
- —
- Monthly cashflow
- —
- DSCR
- —
- Eligible?
- —
Short-term bridge; refi at stabilization.
Rent comps 1 comps
| Address | Beds | Baths | Sqft | Rent | $/sqft | DOM | Units | Dist |
|---|---|---|---|---|---|---|---|---|
| 416 W Washington St Eufaula, AL | 3.0 | 2.0 | 1452 | $1,200 | $0.83 | 21d | 1 | 1.28mi |
Listing history 17 events
-
2026-06-19days on market $95,000 Active 84 DOM
-
2026-06-18days on market $95,000 Active 83 DOM
-
2026-06-17days on market $95,000 Active 82 DOM
-
2026-06-16days on market $95,000 Active 81 DOM
-
2026-06-15days on market $95,000 Active 80 DOM
-
2026-06-14days on market $95,000 Active 78 DOM
-
2026-06-12days on market $95,000 Active 77 DOM
-
2026-06-09days on market $95,000 Active 74 DOM
-
2026-06-08days on market $95,000 Active 73 DOM
-
2026-06-07days on market $95,000 Active 72 DOM
-
2026-06-07days on market $95,000 Active 71 DOM
-
2026-06-04days on market $95,000 Active 68 DOM
-
2026-06-02days on market $95,000 Active 67 DOM
-
2026-06-01days on market $95,000 Active 66 DOM
-
2026-05-31days on market $95,000 Active 65 DOM
-
2026-05-31days on market $95,000 Active 64 DOM
-
2026-03-27$95,000 Active 245-char remark
Show marketing remark (245 chars)
Charming 3-bedroom, 1.5-bath brick home offering comfortable living in a convenient location. The property currently has a tenant in place, making it a great opportunity for investors seeking immediate rental income. Seller is a licensed Realtor
ⓘ Source: listings_history table (triggers on properties + properties_extension) + one-shot
backfill from property_details.listing_events for pre-trigger history.
Climate risk First Street
- Flood 1/10 Low FEMA zone X (unshaded) · 0% chance over 30 yrs
- Wildfire 3/10 Moderate
- Heat 7/10 Severe 7 d/yr ≥107°F today · 19 d/yr by 30 yrs out
- Wind 8/10 Severe 80% chance of damaging wind over 30 yrs
- Air quality 1/10 Low 0 unhealthy d/yr today · 0 by 30 yrs out
Nearby sold comps map
Loading sold comps map…
Walkable amenities ~0.75 mi
Loading nearby amenities…
Taxation est. · year 1
- Rental income
- $14,400
- − Mortgage interest
- −$5,321
- − Property taxes
- −$1,425
- − Insurance
- −$475
- − Repairs & maintenance
- −$1,152
- − Management
- −$1,152
- − Depreciation
- −$2,764
- Taxable income
- $2,111
- Est. tax owed @ 24.0%
- −$507
- After-tax cash flow
- $2,991/yr
For passive investors: Depreciation is non-cash, so a rental often shows a tax loss while cash-flowing — sheltering income. Rental losses are passive: they offset passive income freely, and up to $25,000/yr can offset ordinary (W-2) income if you actively participate and your MAGI is under $100k (phasing out to $0 by $150k); unused losses carry forward. On sale, claimed depreciation is recaptured at up to 25%, and gains may owe capital-gains tax (a 1031 exchange can defer both). Figures are a year-1 estimate at your 24.0% rate — not tax advice; consult a CPA.
Condition & rehab AI · 1 photo
This 3-bedroom, 1.5-bath home requires moderate renovations, including painting and roof replacement, to improve its condition and value.
Repairs flagged
- Major roof — Signs of aging
- Major exterior — Weathered brick
- Major interior walls/paint — Needs repainting
Value-add opportunities
- Both paint exterior — Enhances curb appeal and value
- Both paint interior walls — Improves interior appearance and value
- Both replace roof — Essential for structural integrity and value
Renovation cost estimate screening
| Repair item | Severity | Est. cost |
|---|---|---|
| roof · Signs of aging | Major | $15,000–50,000 |
| exterior · Weathered brick | Major | $15,000–50,000 |
| interior walls/paint · Needs repainting | Major | $15,000–50,000 |
| Total estimated repair cost · 3 items | $45,000–150,000 |
Value-add ROI direction
- Both paint exterior — Enhances curb appeal and value ↑
- Both paint interior walls — Improves interior appearance and value ↑
- Both replace roof — Essential for structural integrity and value ↑
ⓘ Cost ranges are severity-bucket heuristics (US national rule-of-thumb). Get contractor quotes + a written scope before underwriting a rehab budget.
Schools (NCES district)
- District
- Eufaula City
- NCES district ID
- 0101410
- Math proficiency
- 10% ▼ -13.00%
- Reading proficiency
- 38% ▲ 4.00%
- Median HH income
- $34,467
- Composite
- 19.63/100
- National rank
- #8743
- State rank
- #100 of 129 in AL
Livability — Eufaula
- Score
- 51/100
- State rank
- #508
- US rank
- #25138
Category grades
Schools grade is shown separately in the Schools card above.
Census & demographics
- Census place
- Eufaula, AL
- Population (ZIP)
- 14,981
Population outlook (Barbour County) Hauer SSP2
- Today (2025)
- 24,533 people
- By 2030
- 23,439 · -4.5%
- By 2040
- 21,129 · -13.9%
- By 2050
- 18,982 · -22.6%
- By 2075
- 14,114 · -42.5%
- By 2100
- 9,180 · -62.6%
Race, ethnicity, and origin ACS 2023
- Neighborhood character
- Diverse neighborhood (Simpson 0.59)
- Race & ethnicity
- Black 46% White 43% Hispanic / Latino 7% Two or more races 3%
- Hispanic origin (detail)
- Mexican 4%
- Common ancestry
- Slovak 1% Serbian 1% Italian 1%
- Foreign-born
- 3% · Canada
- Languages at home
- 91% English-only · Spanish 7%
Political lean MEDSL · Barbour
- 2024 margin
- R (+14.7) · D 42.3% · R 57.0%
- 2008→2024 swing
- -13.3pp toward R · 2008: -1.4pp · 2024: -14.7pp
- All cycles
- 2024: R+14.7 2020: R+7.7 2016: R+5.6 2012: D+2.9 2008: R+1.4
Not yet ingested
- Civics
- —
Market trends
- HPI YoY
- ▼ -56.42%
- Current HPI
- 151.8238
- Rent YoY
- —
- Metro
- —
- State GDP YoY
- ▲ 2.94%
- F500 in state
- 4
Industry mix (Fortune 500 HQ in AL)
| Industry | F500 HQs | Revenue |
|---|---|---|
| Financial Services | 1 | $8B |
|
||
| Healthcare | 1 | $5B |
|
||
Price history
1 event — show timeline
- 2026-03-27 Listed $95,000 EBOR
Cash-flow waterfall
monthlySold comps — $/sqft
last 12 mo · ≤1 miLoading sold comps…