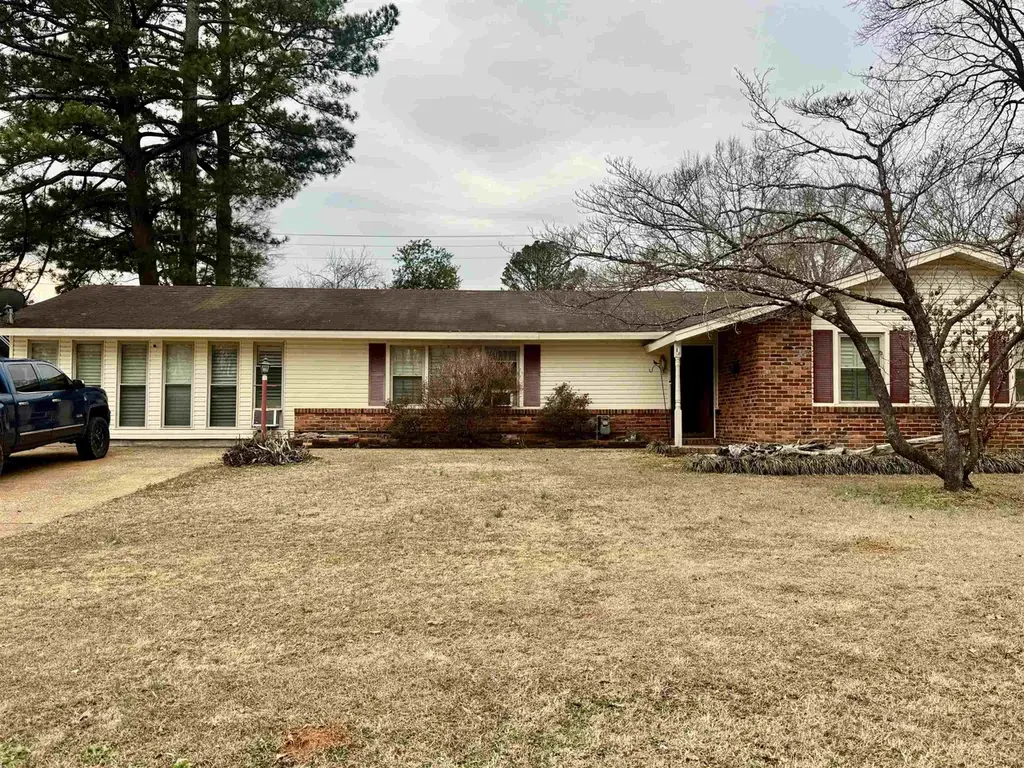
161 Patsy Dr · Florence, AL
Flood risk 1/10 · Minimal
- FEMA flood zone
- X (unshaded)
- Chance of flooding over 30 yrs
- 0.0%
- Est. flood insurance / yr
- $507 – $1,088
Fire risk 4/10 · Minor
- Est. fire insurance / yr
- $916 – $1,700
Heat risk 6/10 · Moderate
- Hot days now (above 107°F)
- 7 days/yr
- Hot days in 30 yrs
- 20 days/yr
Wind risk 5/10 · Moderate
- Chance of severe wind over 30 yrs
- 23.0%
Air-quality risk 2/10 · Minimal
- Unhealthy air days now
- 0 days/yr
- Unhealthy air days in 30 yrs
- 1 days/yr
Risk factors via First Street. Map © Google.
Why this score? — see what drove the D grade
The composite is a weighted blend of 9 inputs, each scored 0–100. Each bar is that input's sub-score; the figure is the points it added to the 100-point composite (weight × sub-score).
- ARV discount +15.0/15.0
- Cash flow +10.2/30.0
- Livability +4.1/5.0
- Schools +3.0/10.0
- DSCR +2.9/10.0
- Rent growth +2.5/5.0
- Condition / age +2.5/5.0
- 1% rule +2.0/10.0
- Appreciation +0.0/10.0
$219,900
🖨 Deal sheet (PDF) 📄 Offer letter ✓ Due diligence
Listing remarks MLS
Located in the desirable Forest Hills subdivision, this spacious 4-bedroom, 2-bath home offers over 2,300± square feet with both a den and a living room, providing plenty of room to spread out. The home is full of potential and ready for updates to make it shine again. With the right vision, sweat equity would go a long way making this an excellent opportunity for investors or buyers looking to customize a home in a well-established neighborhood. A solid footprint in a sought-after area offers strong upside potential. Call today for your showing!
Key facts
- Sought-after area
- Living room
- Den
Tags
Neighborhood map
What this means for you Summary
Snapshot
- This is a 4-bed/2.5-bath single-family listed at $220k.
Deal economics
- At list price, monthly cash flow is $-123 ($-1k/yr) — negative.
- To cash-flow at today's rent, offer at most $198k (9.9% below list).
- To meet the 1% rule (rent ≥ 1% of price), the offer needs to be $153k (30.4% below list).
- Recommended offer: $153k (30.4% below list) — sets the bar for 1% rule.
- Cap rate 5.6% vs local median 3.6% in Florence — top-decile yield for the area; either an underpriced asset or a hidden risk that comps aren't pricing in. Stress-test before assuming the spread holds.
Location & tenants
- Location reads 82/100 on livability (#4 in AL, #1,140 nationally) — a professional / high-income tenant draw. Strengths: amenities A+, commute A+, cost of living A+; Watch: crime F, employment F.
- Florence City (urban): math 28% / reading 44% proficiency, ranked #44 of 129 in AL (top 34%) — families likely to look elsewhere, expect single-tenant / working-renter base with shorter leases.
- Zoned schools: Forest Hills School (math 39% / reading 65%, grade C-, #102 of 627 statewide, top 17%, 831 students, 45% FRL); Florence Middle School (math 22% / reading 44%, grade F, #101 of 257 statewide, top 40%, 689 students, 51% FRL); Florence High School (math 28% / reading 34%, grade F, #66 of 305 statewide, top 21%, 1,034 students, 36% FRL).
- Market conditions: 182 active listings in the ZIP; 2 comparable units currently listed for rent nearby; 164 units permitted in Lauderdale County in 2024 (72 in 5+ unit buildings).
Forward outlook
- Local home prices are declining (-3.0%/yr); year-one equity from $2k of loan paydown is wiped out by about $7k of value loss. Plan a longer hold.
Negotiation context
- It's been on market 112 days — a 9% lower offer ($200k) is reasonable based on typical stale-listing flexibility.
Risks & watch-outs
- Climate carrying-cost: moderate wind risk, 23% chance of damaging wind over 30y; extreme-heat days projected 7→20/yr by 2055 (HVAC capex compounding) — expect insurance premiums to compound above CPI over the hold.
Questions for the listing agent
- What do current leases actually rent for vs. the listed asking? Can we see a recent rent roll and the last 12 months of T-12 income?
- It's been on market 112 days. Have you received any prior offers? Is the seller open to a 30% concession, seller financing, or rate buy-down credit?
- Built in 1964 — when were the roof, HVAC, electrical panel, plumbing, and water heater last replaced?
- Why hasn't it sold? Are there any deal-killer items the seller is aware of (foundation, flood, title, zoning, code violations)?
- Is there a deadline driving the sale (1031 exchange, divorce, estate, relocation)? That informs how much negotiation room exists.
- Crime grade is F in this area — have there been break-ins, vandalism, or insurance claims at this property in the last 3 years? What carrier currently insures it and at what premium?
- The area grade is low — what's the realistic commute time and amenity access for the typical tenant pool here? Any planned neighborhood developments (good or bad) we should know about?
- What's the average days-on-market for RENTAL listings here right now (not sales)? A rising rental-DOM trend means longer vacancies and softer asking-rent achievability than the comps imply.
- What's the recent tenant-quality profile in this submarket — average credit score on applications, eviction rate, late-payment / NSF rate, and stable-employment percentage? A property-management company in the area should have these aggregated.
- How much new for-sale + rental construction is in the pipeline within 1–3 miles? Heavy new supply typically softens prices + rents 12–24 months out; constrained supply supports both.
Investment metrics
- 1% rule
- 0.70% ✗
- Cap rate
- 5.62%
- Cash-on-cash
- -2.40%
- DSCR
- 0.89
- GRM
- 12.0
CMA / ARV
- ARV (median comp)
- $267,863
- List price
- $219,900
- Delta
- -17.91%
- Verdict
- UNDERPRICED
- Comps
- 20 within 1.0 mi
Show comp detail 12 sales within ~0.75 mi
| Address | Dist | Beds/Ba | Sqft | Sold | Price | $/sf | Match |
|---|---|---|---|---|---|---|---|
| 445 Roxie Dr | 0.53mi | 4/2.5 | 2,351 (-0%) | 2mo | $311,000 | $132 | 74 |
| 421 Nottingham Rd | 0.29mi | 4/2.0 | 2,466 (+5%) | 4mo | $175,000 | $71 | 73 |
| 108 Shirley Dr | 0.09mi | 4/2.0 | 2,512 (+7%) | 11mo | $265,000 | $105 | 73 |
| 570 Hazelwood Dr | 0.49mi | 4/2.0 | 2,289 (-3%) | 2mo | $329,900 | $144 | 69 |
| 110 Patsy Dr | 0.09mi | 3/2.5 (-1) | 2,035 (-14%) | 8mo | $300,000 | $147 | 62 |
| 106 Deer Trail Ln | 0.43mi | 4/2.5 | 2,189 (-7%) | 8mo | $340,000 | $155 | 61 |
| 122 Lancaster Rd | 0.54mi | 3/2.0 (-1) | 2,183 (-7%) | 8mo | $297,000 | $136 | 49 |
| 118 Roxie Dr | 0.27mi | 3/2.0 (-1) | 2,000 (-15%) | 13mo | $212,000 | $106 | 45 |
| 574 Hazelwood Dr | 0.50mi | 3/2.0 (-1) | 2,084 (-11%) | 8mo | $280,500 | $135 | 44 |
| 113 Lancaster Rd | 0.59mi | 3/2.0 (-1) | 2,170 (-8%) | 12mo | $319,000 | $147 | 42 |
| 115 Lambeth St | 0.66mi | 3/2.0 (-1) | 2,119 (-10%) | 13mo | $269,900 | $127 | 35 |
| 3511 Chesapeake Dr | 0.72mi | 3/2.0 (-1) | 2,043 (-13%) | 10mo | $365,000 | $179 | 29 |
Match score weights: distance 35% · size 25% · config 20% · recency 20%. Top-matched comps best support the ARV.
Projected returns pro-forma
-3.0% appreciation · 3.0% rent growth · sell at horizon
- IRR
- -20.3%
- Equity multiple
- 0.29×
- Total profit
- $-43,567
- Equity at exit
- $32,788
- IRR
- -13.6%
- Equity multiple
- 0.21×
- Total profit
- $-48,407
- Equity at exit
- $19,013
Cash invested: $61,572 (down + closing). Projections, not guarantees.
Landlord ↔ Tenant lean methodology
- Overall (STATE)
- 90 Strongly Landlord-Friendly
- State Alabama
- 90 Strongly Landlord-Friendly · R+15
- County
- — inherits STATE
- City
- — inherits STATE
ZIP-level market 35633
- Home prices YoY
- -22.6%
- Active inventory
- 182
- Price-to-rent
- 12.0×
Monthly cashflow live
- Estimated rent
- $1,531 medium interval (Pro) →
- Mortgage (P&I)
- −$1,153
- Tax from tax record
- −$88 /mo · $1,058/yr
- Insurance
- −$92
- HOA
- −$0
- Vacancy / Maint / Mgmt
- −$322
- Net cashflow
- $-123
Break-even live
Sensitivity live
| Price | -10% $1 | -5% $-61 | +0% $-123 | +5% $-185 | +10% $-248 |
|---|---|---|---|---|---|
| Rent | -10% $-244 | -5% $-184 | +0% $-123 | +5% $-63 | +10% $-2 |
| Rate | -1.0pp $-12 | -0.5pp $-67 | base $-123 | +0.5pp $-180 | +1.0pp $-238 |
UW: 25.0% down · 7.5% · 30yr · 1.5% tax · 5.0% vac · 8.0% maint · 8.0% mgmt
Financing live
Cash to close
- Down payment
- $54,975
- Closing costs
- $6,597
- Reserves months
- —
- Total cash needed
- —
Loan-product check · same deal, 3 products live
Conventional
25% down · 7.5% · 30yr
- Down + closing
- —
- Monthly P&I
- —
- Monthly cashflow
- —
- DSCR
- —
- Eligible?
- —
Personal DTI + credit; lowest rate.
DSCR
20% down · 8.5% · 30yr
- Down + closing
- —
- Monthly P&I
- —
- Monthly cashflow
- —
- DSCR
- —
- Eligible?
- —
No personal income docs; deal must DSCR.
Hard money
10% down · 12.0% · 12mo
- Down + closing
- —
- Monthly P&I
- —
- Monthly cashflow
- —
- DSCR
- —
- Eligible?
- —
Short-term bridge; refi at stabilization.
Rent comps 2 comps
| Address | Beds | Baths | Sqft | Rent | $/sqft | DOM | Units | Dist |
|---|---|---|---|---|---|---|---|---|
| 2370 Roberts Ln Florence, AL | 3.0 | 2.0 | 1716 | $1,650 | $0.96 | 45d | 1 | 1.01mi |
| 212 Woodcastle Dr Florence, AL | 3.0 | 2.0 | 2262 | $1,400 | $0.62 | 45d | 1 | 1.48mi |
Listing history 5 events
-
2026-06-02days on market $219,900 Active 112 DOM
-
2026-06-01days on market $219,900 Active 111 DOM
-
2026-05-31days on market $219,900 Active 110 DOM
-
2026-05-30days on market $219,900 Active 109 DOM
-
2026-02-10$219,900 Active 559-char remark
Show marketing remark (559 chars)
Located in the desirable Forest Hills subdivision, this spacious 4-bedroom, 2-bath home offers over 2,300± square feet with both a den and a living room, providing plenty of room to spread out. The home is full of potential and ready for updates to make it shine again. With the right vision, sweat equity would go a long way making this an excellent opportunity for investors or buyers looking to customize a home in a well-established neighborhood. A solid footprint in a sought-after area offers strong upside potential. Call today for your showing!
ⓘ Source: listings_history table (triggers on properties + properties_extension) + one-shot
backfill from property_details.listing_events for pre-trigger history.
Tax reassessment forecast AL · Resets to sale price
- Current annual tax
- $1,058 · $88/mo
- Projected year-2 tax
- $1,058 · $88/mo
- Expected delta
- $0/yr ($0/mo · 0.0%)
ⓘ Screening estimate from a state-policy table — verify with the county assessor before closing.
Climate risk First Street
- Flood 1/10 Low FEMA zone X (unshaded) · 0% chance over 30 yrs
- Wildfire 4/10 Moderate
- Heat 6/10 Major 7 d/yr ≥107°F today · 20 d/yr by 30 yrs out
- Wind 5/10 Major 23% chance of damaging wind over 30 yrs
- Air quality 2/10 Low 0 unhealthy d/yr today · 1 by 30 yrs out
Nearby sold comps map
Loading sold comps map…
Walkable amenities ~0.75 mi
Loading nearby amenities…
Taxation est. · year 1
- Rental income
- $18,377
- − Mortgage interest
- −$12,318
- − Property taxes
- −$1,058
- − Insurance
- −$1,100
- − Repairs & maintenance
- −$1,470
- − Management
- −$1,470
- − Depreciation
- −$6,397
- Taxable loss
- −$5,435
- Est. tax savings @ 24.0%
- +$1,304
- After-tax cash flow
- $-173/yr
For passive investors: Depreciation is non-cash, so a rental often shows a tax loss while cash-flowing — sheltering income. Rental losses are passive: they offset passive income freely, and up to $25,000/yr can offset ordinary (W-2) income if you actively participate and your MAGI is under $100k (phasing out to $0 by $150k); unused losses carry forward. On sale, claimed depreciation is recaptured at up to 25%, and gains may owe capital-gains tax (a 1031 exchange can defer both). Figures are a year-1 estimate at your 24.0% rate — not tax advice; consult a CPA.
Schools (NCES district)
- District
- Florence City
- NCES district ID
- 0101530
- Math proficiency
- 28% ▼ -28.00%
- Reading proficiency
- 44% ▼ -4.00%
- Median HH income
- $34,997
- Composite
- 29.69/100
- National rank
- #6456
- State rank
- #44 of 129 in AL
Livability — Florence
- Score
- 82/100
- State rank
- #4
- US rank
- #1140
Category grades
Schools grade is shown separately in the Schools card above.
Census & demographics
- Census place
- Florence, AL
- City population
- 34,028
- Population (ZIP)
- 20,733
Population outlook (Lauderdale County) Hauer SSP2
- Today (2025)
- 93,386 people
- By 2030
- 93,634 · +0.3%
- By 2040
- 93,114 · -0.3%
- By 2050
- 91,586 · -1.9%
- By 2075
- 88,667 · -5.1%
- By 2100
- 81,098 · -13.2%
Race, ethnicity, and origin ACS 2023
- Neighborhood character
- Predominantly White (88%)
- Race & ethnicity
- White 88% Black 7% Two or more races 5% Hispanic / Latino 1%
- Common ancestry
- Slovak 3% Serbian 1% Italian 1%
- Foreign-born
- 1% · Canada
- Languages at home
- 98% English-only · Spanish 2%
Political lean MEDSL · Lauderdale
- 2024 margin
- Solid R (+51.5) · D 23.8% · R 75.3%
- 2008→2024 swing
- -23.3pp toward R · 2008: -28.2pp · 2024: -51.5pp
- All cycles
- 2024: R+51.5 2020: R+44.7 2016: R+46.0 2012: R+30.9 2008: R+28.2
Not yet ingested
- Civics
- —
Market trends
- HPI YoY
- ▼ -57.91%
- Current HPI
- 198.6547
- Rent YoY
- —
- Metro
- —
- State GDP YoY
- ▲ 2.94%
- F500 in state
- 4
Industry mix (Fortune 500 HQ in AL)
| Industry | F500 HQs | Revenue |
|---|---|---|
| Financial Services | 1 | $8B |
|
||
| Healthcare | 1 | $5B |
|
||
Price history
1 event — show timeline
- 2026-02-10 Listed $219,900 SAARMLS
Property tax history
+7.4%/yrLatest (2025): $1,058 · +7.4% YoY. Source: county tax records.
Cash-flow waterfall
monthlySold comps — $/sqft
last 12 mo · ≤1 miLoading sold comps…