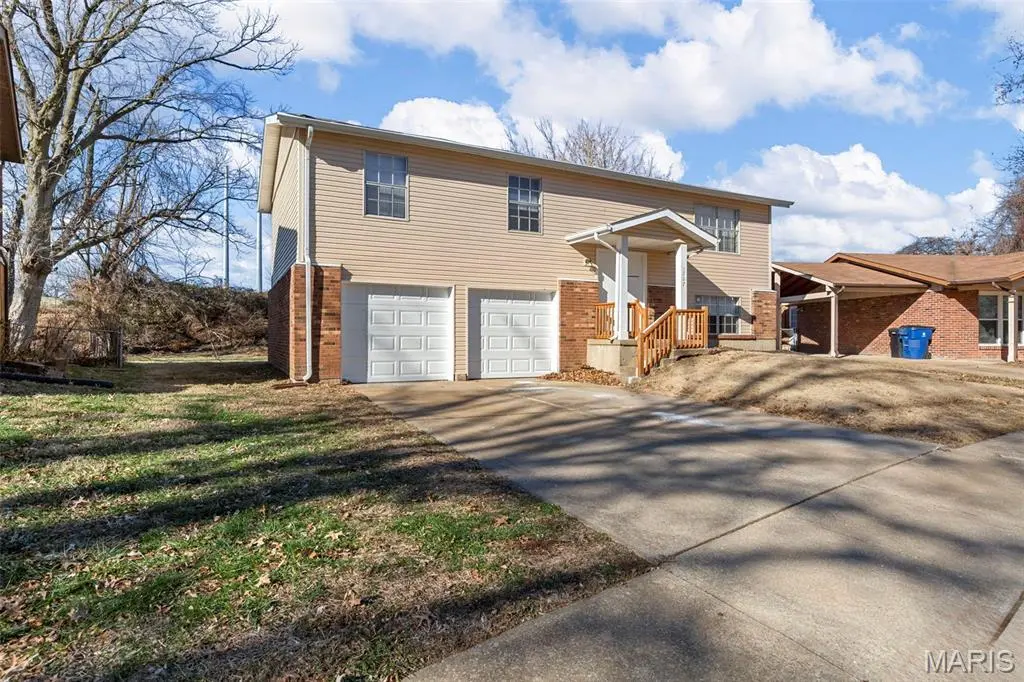
1767 Stilton Ct · Florissant, MO
Flood risk 1/10 · Minimal
- FEMA flood zone
- X (unshaded)
- Chance of flooding over 30 yrs
- 0.0%
- Est. flood insurance / yr
- $473 – $860
Fire risk 1/10 · Minimal
- Est. fire insurance / yr
- $1,054 – $1,958
Heat risk 4/10 · Minor
- Hot days now (above 106°F)
- 7 days/yr
- Hot days in 30 yrs
- 20 days/yr
Wind risk 2/10 · Minimal
- Chance of severe wind over 30 yrs
- 1.0%
Air-quality risk 2/10 · Minimal
- Unhealthy air days now
- 2 days/yr
- Unhealthy air days in 30 yrs
- 2 days/yr
Risk factors via First Street. Map © Google.
Why this score? — see what drove the D grade
The composite is a weighted blend of 9 inputs, each scored 0–100. Each bar is that input's sub-score; the figure is the points it added to the 100-point composite (weight × sub-score).
- Cash flow +15.2/30.0
- ARV discount +5.9/15.0
- DSCR +4.7/10.0
- 1% rule +3.9/10.0
- Livability +3.7/5.0
- Rent growth +3.6/5.0
- Condition / age +2.5/5.0
- Schools +1.7/10.0
- Appreciation +0.0/10.0
$190,000
🖨 Deal sheet 📄 Offer letter ✓ Due diligence
Listing remarks MLS
Looking for a home you can truly make your own? This split-level offers a great floor plan, a two-car garage, and the chance to add your personal touch. With a bit of TLC, this property can shine and become a wonderful long-term home. The seller reserves the right to accept the offer of their choice regardless of the order in which they are received, counter offered, or presented from a multiple offer situation. (some photos virtually staged)
Key facts
- 8,960 sq ft lot
- 2 garage spots
- Built 1974
Neighborhood map
What this means for you Summary
Snapshot
- This is a 3-bed/2.0-bath single-family listed at $190k.
Deal economics
- At list price, monthly cash flow is $67 ($806/yr) — positive.
- The deal already cash-flows at list — no discount required.
- To meet the 1% rule (rent ≥ 1% of price), the offer needs to be $169k (11.1% below list).
- Recommended offer: $167k (12.0% below list) — sets the bar for market timing.
Location & tenants
- Location reads 73/100 on livability (#82 in MO) — a middle-class / working-renter tenant base. Strengths: cost of living A+, housing A+, health & safety B+; Watch: crime C-, amenities D+, schools D.
- Hazelwood (suburban): math 11% / reading 26% proficiency, ranked #306 of 324 in MO (top 94%) — low school quality limits family demand, transient renter base, plan for 1-2y turnover.
- Market conditions: Rents rising fast (+4.3%/yr); 271 active listings in the ZIP; 16 comparable units currently listed for rent nearby; rentals leasing fast (median 7d on market — plan ~1-2 weeks tenant-placement turnaround); 920 units permitted in St. Louis County in 2024 (250 in 5+ unit buildings).
Forward outlook
- Local home prices are declining (-3.0%/yr); year-one equity from $1k of loan paydown is wiped out by about $6k of value loss. Plan a longer hold.
Negotiation context
- It's been on market 169 days — a 12% lower offer ($167k) is reasonable based on typical stale-listing flexibility.
- 3 sale attempts since 7y ago; this cycle's ask has dropped $10k (5%) from the opening price — seller is motivated, your offer sets the floor, not the list.
- Current owner paid $111k; list at $190k implies a 71% gain — meaningful room to come down on a strong offer.
Questions for the listing agent
- It's been on market 169 days. Have you received any prior offers? Is the seller open to a 12% concession, seller financing, or rate buy-down credit?
- Built in 1974 — when were the roof, HVAC, electrical panel, plumbing, and water heater last replaced?
- Why hasn't it sold? Are there any deal-killer items the seller is aware of (foundation, flood, title, zoning, code violations)?
- Is there a deadline driving the sale (1031 exchange, divorce, estate, relocation)? That informs how much negotiation room exists.
- Schools are D-rated, which usually means shorter tenancies and higher turnover. Who's the typical renter profile here, and what's been the actual vacancy rate?
- The area grade is low — what's the realistic commute time and amenity access for the typical tenant pool here? Any planned neighborhood developments (good or bad) we should know about?
- What's the average days-on-market for RENTAL listings here right now (not sales)? A rising rental-DOM trend means longer vacancies and softer asking-rent achievability than the comps imply.
- What's the recent tenant-quality profile in this submarket — average credit score on applications, eviction rate, late-payment / NSF rate, and stable-employment percentage? A property-management company in the area should have these aggregated.
- How much new for-sale + rental construction is in the pipeline within 1–3 miles? Heavy new supply typically softens prices + rents 12–24 months out; constrained supply supports both.
Investment metrics
- 1% rule
- 0.89% ✗
- Cap rate
- 6.72%
- Cash-on-cash
- 1.52%
- DSCR
- 1.07
- GRM
- 9.4
CMA / ARV
- ARV (median comp)
- $183,455
- List price
- $190,000
- Delta
- 3.57%
- Verdict
- FAIR
- Comps
- 20 within 1.0 mi
Show comp detail 12 sales within ~0.75 mi
| Address | Dist | Beds/Ba | Sqft | Sold | Price | $/sf | Match |
|---|---|---|---|---|---|---|---|
| 2377 Farflung Dr | 0.21mi | 3/2.5 | 1,100 (-2%) | 2mo | $204,900 | $186 | 83 |
| 2216 Foggy Bottom Dr | 0.25mi | 3/2.0 | 1,189 (+6%) | 2mo | $130,000 | $109 | 77 |
| 2171 Farthing Ct | 0.27mi | 3/2.0 | 1,189 (+6%) | 3mo | $195,000 | $164 | 76 |
| 2397 Millvalley Dr | 0.32mi | 4/2.0 (+1) | 1,100 (-2%) | 1mo | $169,900 | $154 | 76 |
| 2334 White Ash Ct | 0.40mi | 3/2.0 | 1,189 (+6%) | 2mo | $189,900 | $160 | 70 |
| 1315 Thrush Ln | 0.58mi | 3/1.0 | 1,092 (-3%) | 3mo | $159,900 | $146 | 62 |
| 2572 Auburnhill Ct | 0.50mi | 4/3.0 (+1) | 1,189 (+6%) | 2mo | $185,000 | $156 | 56 |
| 2128 Monks Hollow Dr | 0.71mi | 2/2.0 (-1) | 1,147 (+2%) | 4mo | $175,000 | $153 | 56 |
| 2543 Saddle Ridge Dr | 0.73mi | 3/2.0 | 1,189 (+6%) | 3mo | $190,000 | $160 | 54 |
| 2390 Teakwood Manor Dr | 0.65mi | 3/2.0 | 1,261 (+12%) | 2mo | $179,900 | $143 | 48 |
| 1910 Flamingo Dr | 0.70mi | 3/1.0 | 1,025 (-9%) | 1mo | $199,500 | $195 | 48 |
| 2425 Lindsay Ln | 0.67mi | 3/1.0 | 960 (-15%) | 1mo | $205,000 | $214 | 39 |
Match score weights: distance 35% · size 25% · config 20% · recency 20%. Top-matched comps best support the ARV.
Projected returns pro-forma
-3.0% appreciation · 4.27% rent growth · sell at horizon
- IRR
- -12.5%
- Equity multiple
- 0.54×
- Total profit
- $-24,326
- Equity at exit
- $28,330
- IRR
- -1.7%
- Equity multiple
- 0.88×
- Total profit
- $-6,479
- Equity at exit
- $16,428
Cash invested: $53,200 (down + closing). Projections, not guarantees.
Landlord ↔ Tenant lean methodology
- Overall (STATE)
- 81 Strongly Landlord-Friendly
- State Missouri
- 81 Strongly Landlord-Friendly · R+10
- County
- — inherits STATE
- City
- — inherits STATE
ZIP-level market 63031
- Rents YoY
- 4.3%
- Active inventory
- 271
- Price-to-rent
- 9.4×
Monthly cashflow live
- Estimated rent
- $1,689 high interval (Pro) →
- Mortgage (P&I)
- −$996
- Tax from tax record
- −$192 /mo · $2,300/yr
- Insurance
- −$79
- HOA
- −$0
- Vacancy / Maint / Mgmt
- −$355
- Net cashflow
- $67
Break-even live
UW: 25.0% down · 7.5% · 30yr · 1.5% tax · 5.0% vac · 8.0% maint · 8.0% mgmt
Financing live
Cash to close
- Down payment
- $47,500
- Closing costs
- $5,700
- Reserves months
- —
- Total cash needed
- —
Loan-product check · same deal, 3 products live
Conventional
25% down · 7.5% · 30yr
- Down + closing
- —
- Monthly P&I
- —
- Monthly cashflow
- —
- DSCR
- —
- Eligible?
- —
Personal DTI + credit; lowest rate.
DSCR
20% down · 8.5% · 30yr
- Down + closing
- —
- Monthly P&I
- —
- Monthly cashflow
- —
- DSCR
- —
- Eligible?
- —
No personal income docs; deal must DSCR.
Hard money
10% down · 12.0% · 12mo
- Down + closing
- —
- Monthly P&I
- —
- Monthly cashflow
- —
- DSCR
- —
- Eligible?
- —
Short-term bridge; refi at stabilization.
Rent comps 16 comps
| Address | Beds | Baths | Sqft | Rent | $/sqft | DOM | Units | Dist |
|---|---|---|---|---|---|---|---|---|
| 2316 Millvalley Dr Florissant, MO | 3.0 | 3.0 | 1189 | $1,696 | $1.43 | 14d | 1 | 0.32mi |
| 1545 Swan Dr Florissant, MO | 3.0 | 1.0 | 1064 | $1,590 | $1.49 | 7d | 1 | 0.36mi |
| 1095 Cedar Pl Florissant, MO | 3.0 | 1.5 | 1107 | $1,710 | $1.54 | 1d | 1 | 0.62mi |
| 1315 Bobolink Dr Florissant, MO | 3.0 | 2.0 | 1025 | $1,700 | $1.66 | 12d | 1 | 0.63mi |
| 2400 Teakwood Manor Dr Florissant, MO | 3.0 | 2.0 | 1380 | $1,725 | $1.25 | 43d | 1 | 0.66mi |
| 2245 Lindsay Ln Florissant, MO | 4.0 | 2.0 | 1466 | $1,800 | $1.23 | 16d | 1 | 0.74mi |
| 2160 Splendor Dr Florissant, MO | 3.0 | 2.0 | 1100 | $1,800 | $1.64 | 2d | 1 | 0.88mi |
| 2485 Jenkee Dr Florissant, MO | 3.0 | 1.0 | 960 | $1,376 | $1.43 | 1d | 1 | 0.91mi |
| 1540 Aspen Dr Florissant, MO | 3.0 | 2.0 | 912 | $1,395 | $1.53 | 7d | 1 | 1.06mi |
| 1395 Bluebird Dr Florissant, MO | 3.0 | 2.0 | 1168 | $1,599 | $1.37 | 16d | 1 | 1.13mi |
| 1095 Humes Ln Florissant, MO | 3.0 | 1.5 | 1100 | $1,650 | $1.50 | 4d | 1 | 1.28mi |
| 3015 Matlock Dr Florissant, MO | 3.0 | 1.0 | 950 | $1,475 | $1.55 | 43d | 1 | 1.30mi |
| 1145 Swallow Ln Florissant, MO | 3.0 | 2.0 | 1288 | $1,645 | $1.28 | 2d | 1 | 1.33mi |
| 2280 Keeven Ln Florissant, MO | 1.0–3.0 | 1.0–1.5 | 805 | $1,290 | $1.60 | 1d | 14 | 1.41mi |
| 1015 Lindsay Ln Florissant, MO | 3.0 | 2.0 | 988 | $1,600 | $1.62 | 23d | 1 | 1.43mi |
| 9 Charlotte Dr Florissant, MO | 3.0 | 1.5 | 1404 | $1,641 | $1.17 | 4d | 1 | 1.48mi |
Listing history 15 events
-
2026-06-03days on market $190,000 Active 169 DOM
-
2026-06-02days on market $190,000 Active 168 DOM
-
2026-06-01days on market $190,000 Active 167 DOM
-
2026-05-31days on market $190,000 Active 166 DOM
-
2026-05-06price $190,000 446-char remark
Show marketing remark (446 chars)
Looking for a home you can truly make your own? This split-level offers a great floor plan, a two-car garage, and the chance to add your personal touch. With a bit of TLC, this property can shine and become a wonderful long-term home. The seller reserves the right to accept the offer of their choice regardless of the order in which they are received, counter offered, or presented from a multiple offer situation. (some photos virtually staged)
-
2026-03-06price $195,000 446-char remark
Show marketing remark (446 chars)
Looking for a home you can truly make your own? This split-level offers a great floor plan, a two-car garage, and the chance to add your personal touch. With a bit of TLC, this property can shine and become a wonderful long-term home. The seller reserves the right to accept the offer of their choice regardless of the order in which they are received, counter offered, or presented from a multiple offer situation. (some photos virtually staged)
-
2025-12-16$200,000 Active 446-char remark
Show marketing remark (446 chars)
Looking for a home you can truly make your own? This split-level offers a great floor plan, a two-car garage, and the chance to add your personal touch. With a bit of TLC, this property can shine and become a wonderful long-term home. The seller reserves the right to accept the offer of their choice regardless of the order in which they are received, counter offered, or presented from a multiple offer situation. (some photos virtually staged)
-
2019-11-01soldstatus $111,000
-
2019-10-30status Pending 374-char remark
Show marketing remark (374 chars)
Welcome Home! Interior Has Been Nicely Renovated. 4 Bedroom, 2 Bath Home on a Cul-de Sac. Move in Ready. 3 Bedrooms Up and 1 Down Plus a Bonus Office or Storage Room on the Lower Level. Features 2 Car Garage, Large/Level Yard, Low Maintenance Vinyl Siding and a Walk Out Basement. Seller Will Assist With Closing Costs. Seller Will Provide Clear County Occupancy Inspection!
-
2019-10-29soldstatus Closed 374-char remark
Show marketing remark (374 chars)
Welcome Home! Interior Has Been Nicely Renovated. 4 Bedroom, 2 Bath Home on a Cul-de Sac. Move in Ready. 3 Bedrooms Up and 1 Down Plus a Bonus Office or Storage Room on the Lower Level. Features 2 Car Garage, Large/Level Yard, Low Maintenance Vinyl Siding and a Walk Out Basement. Seller Will Assist With Closing Costs. Seller Will Provide Clear County Occupancy Inspection!
-
2019-09-30historical Active Under Contract 374-char remark
Show marketing remark (374 chars)
Welcome Home! Interior Has Been Nicely Renovated. 4 Bedroom, 2 Bath Home on a Cul-de Sac. Move in Ready. 3 Bedrooms Up and 1 Down Plus a Bonus Office or Storage Room on the Lower Level. Features 2 Car Garage, Large/Level Yard, Low Maintenance Vinyl Siding and a Walk Out Basement. Seller Will Assist With Closing Costs. Seller Will Provide Clear County Occupancy Inspection!
-
2019-08-27$124,900 Active 374-char remark
Show marketing remark (374 chars)
Welcome Home! Interior Has Been Nicely Renovated. 4 Bedroom, 2 Bath Home on a Cul-de Sac. Move in Ready. 3 Bedrooms Up and 1 Down Plus a Bonus Office or Storage Room on the Lower Level. Features 2 Car Garage, Large/Level Yard, Low Maintenance Vinyl Siding and a Walk Out Basement. Seller Will Assist With Closing Costs. Seller Will Provide Clear County Occupancy Inspection!
-
2019-05-09soldstatus Closed
-
2019-04-25status Pending
-
2019-04-17$65,000 Active
ⓘ Source: listings_history table (triggers on properties + properties_extension) + one-shot
backfill from property_details.listing_events for pre-trigger history.
Tax reassessment forecast MO · Resets to sale price
- Current annual tax
- $2,300 · $192/mo
- Projected year-2 tax
- $2,300 · $192/mo
- Expected delta
- $0/yr ($0/mo · 0.0%)
ⓘ Screening estimate from a state-policy table — verify with the county assessor before closing.
Climate risk First Street
- Flood 1/10 Low FEMA zone X (unshaded) · 0% chance over 30 yrs
- Wildfire 1/10 Low
- Heat 4/10 Moderate 7 d/yr ≥106°F today · 20 d/yr by 30 yrs out
- Wind 2/10 Low 100% chance of damaging wind over 30 yrs
- Air quality 2/10 Low 2 unhealthy d/yr today · 2 by 30 yrs out
Nearby sold comps map
Loading sold comps map…
Walkable amenities ~0.75 mi
Loading nearby amenities…
Taxation est. · year 1
- Rental income
- $20,269
- − Mortgage interest
- −$10,643
- − Property taxes
- −$2,300
- − Insurance
- −$950
- − Repairs & maintenance
- −$1,622
- − Management
- −$1,622
- − Depreciation
- −$5,527
- Taxable loss
- −$2,394
- Est. tax savings @ 24.0%
- +$575
- After-tax cash flow
- $1,381/yr
For passive investors: Depreciation is non-cash, so a rental often shows a tax loss while cash-flowing — sheltering income. Rental losses are passive: they offset passive income freely, and up to $25,000/yr can offset ordinary (W-2) income if you actively participate and your MAGI is under $100k (phasing out to $0 by $150k); unused losses carry forward. On sale, claimed depreciation is recaptured at up to 25%, and gains may owe capital-gains tax (a 1031 exchange can defer both). Figures are a year-1 estimate at your 24.0% rate — not tax advice; consult a CPA.
Schools (NCES district)
- District
- Hazelwood
- NCES district ID
- 2913830
- Math proficiency
- 11% ▼ -13.00%
- Reading proficiency
- 26% ▼ -6.00%
- Median HH income
- $51,621
- Composite
- 16.77/100
- National rank
- #9156
- State rank
- #306 of 324 in MO
Livability — Florissant
- Score
- 73/100
- State rank
- #82
- US rank
- #5406
Category grades
Schools grade is shown separately in the Schools card above.
Census & demographics
- County
- Saint Louis County · 888,823 people
- City population
- 69,104
- Metro
- St. Louis, MO-IL
- Population (ZIP)
- 50,196
- Household income
- $70,811
- Rent vs Own
- Severe rent burden
- 1279.0
Population outlook (St. Louis County) Hauer SSP2
- Today (2025)
- 1,025,227 people
- By 2030
- 1,028,023 · +0.3%
- By 2040
- 1,020,940 · -0.4%
- By 2050
- 1,007,280 · -1.8%
- By 2075
- 987,277 · -3.7%
- By 2100
- 921,984 · -10.1%
Race, ethnicity, and origin ACS 2023
- Neighborhood character
- Diverse neighborhood (Simpson 0.58)
- Race & ethnicity
- White 49% Black 41% Two or more races 7% Hispanic / Latino 2%
- Common ancestry
- Romanian 3% Lithuanian 3% Swedish 1%
- Foreign-born
- 5% · Canada, Jamaica
- Languages at home
- 94% English-only · Spanish 2% Arabic 1%
Political lean MEDSL · St. Louis
- 2024 margin
- Strong D (+23.4) · D 60.8% · R 37.4% · Other 1.7%
- 2008→2024 swing
- +3.5pp toward D · 2008: 19.9pp · 2024: 23.4pp
- All cycles
- 2024: D+23.4 2020: D+24.0 2016: D+16.2 2012: D+13.7 2008: D+19.9
Not yet ingested
- Civics
- —
Market trends
- HPI YoY
- ▼ -223.57%
- Current HPI
- 202.7192
- Rent YoY
- ▲ 4.27%
- Metro
- St. Louis, MO-IL
- State GDP YoY
- ▲ 1.84%
- F500 in state
- 20
Industry mix (Fortune 500 HQ in MO)
| Industry | F500 HQs | Revenue |
|---|---|---|
| Healthcare | 1 | $163B |
|
||
| Insurance | 1 | $21B |
|
||
| Industrial Technology | 1 | $17B |
|
||
| Retail | 1 | $16B |
|
||
| Industrial Distribution | 1 | $10B |
|
||
| Utilities | 1 | $9B |
|
||
Price history
+192.3% since first listed11 events — show timeline
- 2026-05-06 Price Changed $190,000 MARIS as Distributed by MLS Grid
- 2026-03-06 Price Changed $195,000 MARIS as Distributed by MLS Grid
- 2025-12-16 Listed $200,000 MARIS as Distributed by MLS Grid
- 2019-11-01 Sold (Public Records) $111,000 Public Records
- 2019-10-30 Pending — MARIS as Distributed by MLS Grid
- 2019-10-29 Sold (MLS) — MARIS as Distributed by MLS Grid
- 2019-09-30 Contingent — MARIS as Distributed by MLS Grid
- 2019-08-27 Listed $124,900 MARIS as Distributed by MLS Grid
- 2019-05-09 Sold (MLS) — MARIS as Distributed by MLS Grid
- 2019-04-25 Pending — MARIS as Distributed by MLS Grid
- 2019-04-17 Listed $65,000 MARIS as Distributed by MLS Grid
Property tax history
+4.3%/yrLatest (2022): $2,300 · +1.5% YoY. Source: county tax records.
Cash-flow waterfall
monthlySold comps — $/sqft
last 12 mo · ≤1 miLoading sold comps…