449 W 104th St Unit D · Kansas City, MO
Flood risk 1/10 · Minimal
- FEMA flood zone
- X (unshaded)
- Chance of flooding over 30 yrs
- 0.0%
- Est. flood insurance / yr
- $473 – $860
Fire risk 1/10 · Minimal
- Est. fire insurance / yr
- $1,054 – $1,958
Heat risk 4/10 · Minor
- Hot days now (above 108°F)
- 7 days/yr
- Hot days in 30 yrs
- 17 days/yr
Wind risk 2/10 · Minimal
- Chance of severe wind over 30 yrs
- —
Air-quality risk 3/10 · Minor
- Unhealthy air days now
- 3 days/yr
- Unhealthy air days in 30 yrs
- 3 days/yr
Risk factors via First Street. Map © Google.
Why this score? — see what drove the D grade
The composite is a weighted blend of 9 inputs, each scored 0–100. Each bar is that input's sub-score; the figure is the points it added to the 100-point composite (weight × sub-score).
- ARV discount +15.0/15.0
- Cash flow +7.7/30.0
- 1% rule +6.4/10.0
- Livability +3.9/5.0
- Rent growth +3.6/5.0
- Condition / age +2.5/5.0
- DSCR +1.8/10.0
- Schools +1.8/10.0
- Appreciation +0.0/10.0
$95,000
🖨 Deal sheet (PDF) 📄 Offer letter ✓ Due diligence
Listing remarks MLS
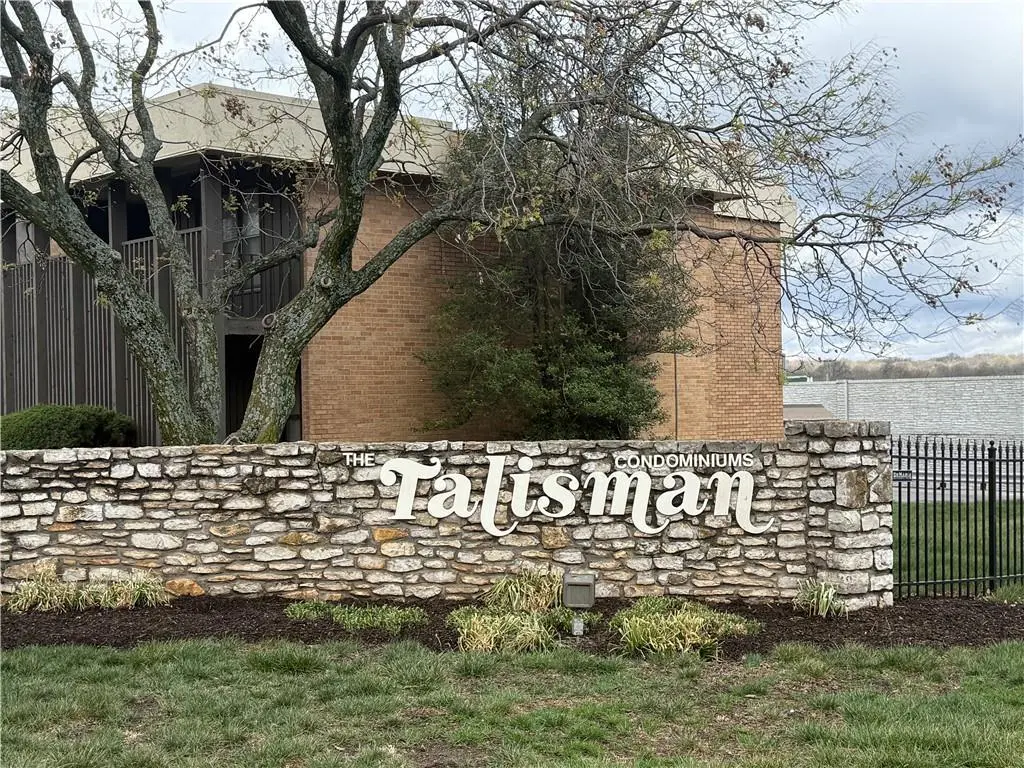
Welcome to The Talisman Condominiums — where comfort, convenience, and community come together! Step inside this bright and airy top-floor, one-bedroom home and discover a space filled with natural light and fresh updates throughout. Enjoy brand-new carpet and padding, fresh paint in every room, new blinds in the dining area, making this home truly move-in ready. Relax on two private balconies or take advantage of the amazing amenities right outside your door with a sparkling pool, a fully equipped fitness center, a friendly dog park, and a welcoming community clubhouse, all included in the incredible HOA package. Even better, your HOA covers almost everything: water, gas, snow removal, landscaping, exterior and HVAC maintenance, and trash service — so you only need to take care of internet and electricity. A new roof was also completed just last year! Great Price and value in this amazing gated community HOA dues are $344/month, with a temporary $100/mo. roofing assessment that ends in just eight months. Come see why The Talisman is the perfect place to call home and where every day feels easy, connected, and bright!
Key facts
- Community clubhouse
- Friendly dog park
- Top floor
Tags
Neighborhood map
What this means for you Summary
Snapshot
- This is a 1-bed/1.0-bath condo listed at $95k.
Deal economics
- At list price, monthly cash flow is $-110 ($-1k/yr) — negative.
- To cash-flow at today's rent, offer at most $76k (20.5% below list).
- Meets the 1% rule at list price ($1k rent vs $95k).
- Recommended offer: $76k (20.5% below list) — sets the bar for cash-flow.
- Cap rate 4.9% vs local median 3.9% in Kansas City — meaningfully above typical; check what's discounted (condition, days-on-market, listing class) to confirm the premium yield is real.
Location & tenants
- Location reads 78/100 on livability (#28 in MO, #2,671 nationally) — a middle-class / working-renter tenant base. Strengths: amenities A+, commute A+, cost of living A+; Watch: crime F.
- Center 58 (urban): math 12% / reading 29% proficiency, ranked #301 of 324 in MO (top 93%) — low school quality limits family demand, transient renter base, plan for 1-2y turnover; 63% free/reduced lunch — lower-income household profile, screen leases tightly.
- Zoned schools: Red Bridge Elem. (math 37% / reading 47%, grade F, #481 of 1,115 statewide, top 46%, 237 students, 47% FRL); Center Middle (math 7% / reading 28%, grade F, #350 of 391 statewide, top 90%, 560 students, 66% FRL); Center Sr. High (math 5% / reading 37%, grade F, #468 of 521 statewide, top 90%, 742 students, 62% FRL) — zoned schools at 59% FRL track the district average.
- Market conditions: Rents rising fast (+4.6%/yr); 179 active listings in the ZIP; 10 comparable units currently listed for rent nearby; rentals leasing fast (median 13d on market — plan ~1-2 weeks tenant-placement turnaround); solid renter incomes; 4,002 units permitted in Jackson County in 2024 (2,271 in 5+ unit buildings).
- This rent is only 16% of the median local income ($81k/yr) — well below the 30% rent-burden line; pricing power to push rent on renewal without tenant pushback.
Forward outlook
- Local home prices are declining (-3.0%/yr); year-one equity from $657 of loan paydown is wiped out by about $3k of value loss. Plan a longer hold.
- Jackson County population projected at +4% by 2050 — modest demand growth; plan on rents tracking national, not racing it.
Negotiation context
- It's been on market 51 days — a 3% lower offer ($92k) is reasonable based on typical stale-listing flexibility.
Risks & watch-outs
- Watch-outs: HOA is 32% of rent.
Questions for the listing agent
- What do current leases actually rent for vs. the listed asking? Can we see a recent rent roll and the last 12 months of T-12 income?
- It's been on market 51 days. Have you received any prior offers? Is the seller open to a 20% concession, seller financing, or rate buy-down credit?
- Built in 1965 — when were the roof, HVAC, electrical panel, plumbing, and water heater last replaced?
- What does the HOA fee cover, when was the last increase, and are there any pending special assessments or reserve-fund shortfalls?
- Any open or pending special assessments — roof, HVAC, plumbing, elevator, façade? What's the per-unit balance and payoff schedule, and is the seller paying it off at close or rolling it to the buyer?
- Is there a deadline driving the sale (1031 exchange, divorce, estate, relocation)? That informs how much negotiation room exists.
- Crime grade is F in this area — have there been break-ins, vandalism, or insurance claims at this property in the last 3 years? What carrier currently insures it and at what premium?
- The area grade is low — what's the realistic commute time and amenity access for the typical tenant pool here? Any planned neighborhood developments (good or bad) we should know about?
- What's the average days-on-market for RENTAL listings here right now (not sales)? A rising rental-DOM trend means longer vacancies and softer asking-rent achievability than the comps imply.
- What's the recent tenant-quality profile in this submarket — average credit score on applications, eviction rate, late-payment / NSF rate, and stable-employment percentage? A property-management company in the area should have these aggregated.
- How much new apartment / multifamily construction is in the pipeline within 1–3 miles? Heavy new supply (>2% of stock underway) typically softens rents 12–24 months out; light construction supports rent growth.
Investment metrics
- 1% rule
- 1.14% ✓
- Cap rate
- 4.90%
- Cash-on-cash
- -4.97%
- DSCR
- 0.78
- GRM
- 7.3
CMA / ARV
- ARV (median comp)
- $116,396
- List price
- $95,000
- Delta
- -18.38%
- Verdict
- UNDERPRICED
- Comps
- 20 within 1.0 mi
Projected returns pro-forma
-3.0% appreciation · 4.57% rent growth · sell at horizon
- IRR
- -21.8%
- Equity multiple
- 0.23×
- Total profit
- $-20,463
- Equity at exit
- $14,165
- IRR
- -10.4%
- Equity multiple
- 0.30×
- Total profit
- $-18,659
- Equity at exit
- $8,214
Cash invested: $26,600 (down + closing). Projections, not guarantees.
Landlord ↔ Tenant lean methodology
- Overall (STATE)
- 81 Strongly Landlord-Friendly
- State Missouri
- 81 Strongly Landlord-Friendly · R+10
- County
- — inherits STATE
- City
- — inherits STATE
ZIP-level market 64114
- Rents YoY
- 4.6%
- Active inventory
- 179
- Price-to-rent
- 7.3×
Monthly cashflow live
- Estimated rent
- $1,081 high interval (Pro) →
- Mortgage (P&I)
- −$498
- Tax from tax record
- −$83 /mo · $991/yr
- Insurance
- −$40
- HOA
- −$344
- Vacancy / Maint / Mgmt
- −$227
- Net cashflow
- $-110
Break-even live
Sensitivity live
| Price | -10% $-56 | -5% $-83 | +0% $-110 | +5% $-137 | +10% $-164 |
|---|---|---|---|---|---|
| Rent | -10% $-195 | -5% $-153 | +0% $-110 | +5% $-67 | +10% $-25 |
| Rate | -1.0pp $-62 | -0.5pp $-86 | base $-110 | +0.5pp $-135 | +1.0pp $-160 |
UW: 25.0% down · 7.5% · 30yr · 1.5% tax · 5.0% vac · 8.0% maint · 8.0% mgmt
Financing live
Cash to close
- Down payment
- $23,750
- Closing costs
- $2,850
- Reserves months
- —
- Total cash needed
- —
Loan-product check · same deal, 3 products live
Conventional
25% down · 7.5% · 30yr
- Down + closing
- —
- Monthly P&I
- —
- Monthly cashflow
- —
- DSCR
- —
- Eligible?
- —
Personal DTI + credit; lowest rate.
DSCR
20% down · 8.5% · 30yr
- Down + closing
- —
- Monthly P&I
- —
- Monthly cashflow
- —
- DSCR
- —
- Eligible?
- —
No personal income docs; deal must DSCR.
Hard money
10% down · 12.0% · 12mo
- Down + closing
- —
- Monthly P&I
- —
- Monthly cashflow
- —
- DSCR
- —
- Eligible?
- —
Short-term bridge; refi at stabilization.
Rent comps 10 comps
| Address | Beds | Baths | Sqft | Rent | $/sqft | DOM | Units | Dist |
|---|---|---|---|---|---|---|---|---|
| 452 W 104th St Unit D Kansas City, MO | 1.0 | 1.0 | 875 | $1,128 | $1.29 | 45d | 1 | 0.08mi |
| 10466 Wornall Rd Unit 452-101 R Kansas City, MO | 1.0 | 1.0 | 760 | $995 | $1.31 | 6d | 1 | 0.08mi |
| 10466 Wornall Rd Kansas City, MO | 1.0–2.0 | 1.0–1.5 | 960 | $995 | $1.04 | 22d | 3 | 0.12mi |
| 10601 Jefferson St Kansas City, MO | 1.0–2.0 | 1.0–2.0 | 1090 | $979 | $0.90 | 12d | 1 | 0.19mi |
| 114 W 103rd St Kansas City, MO | 1.0–2.0 | 1.0–2.0 | 925 | $895 | $0.97 | 6d | 9 | 0.45mi |
| 201 W 99th Ter Kansas City, MO | 1.0–2.0 | 1.0–2.5 | 1262 | $925 | $0.73 | 3d | 52 | 0.69mi |
| 510 E 101st St Kansas City, MO | 1.0–2.0 | 1.0–2.0 | 918 | $1,075 | $1.17 | 6d | 5 | 0.90mi |
| 808 E 100 Ter Kansas City, MO | 1.0–2.0 | 1.0 | 660 | $895 | $1.36 | 45d | 4 | 1.10mi |
| 808 E 100 Ter Kansas City, MO | 1.0 | 1.0 | 576 | $1,020 | $1.77 | 25d | 1 | 1.10mi |
| 655 E Minor Dr Kansas City, MO | 1.0–3.0 | 1.0–2.5 | 1232 | $799 | $0.65 | 3d | 50 | 1.36mi |
HOA detail condo
- Monthly dues
- $344 · $4,128/yr
- Likely covers
- watertrashgaselectricinternetlandscapingsnow removalpoolgymsecurity
- Assessments
- None detected in remarks — confirm with the listing agent.
Listing history 5 events
-
2026-04-24price $95,000 1149-char remark
Show marketing remark (1149 chars)
Welcome to The Talisman Condominiums — where comfort, convenience, and community come together! Step inside this bright and airy top-floor, one-bedroom home and discover a space filled with natural light and fresh updates throughout. Enjoy brand-new carpet and padding, fresh paint in every room, new blinds in the dining area, making this home truly move-in ready. Relax on two private balconies or take advantage of the amazing amenities right outside your door with a sparkling pool, a fully equipped fitness center, a friendly dog park, and a welcoming community clubhouse, all included in the incredible HOA package. Even better, your HOA covers almost everything: water, gas, snow removal, landscaping, exterior and HVAC maintenance, and trash service — so you only need to take care of internet and electricity. A new roof was also completed just last year! Great Price and value in this amazing gated community HOA dues are $344/month, with a temporary $100/mo. roofing assessment that ends in just eight months. Come see why The Talisman is the perfect place to call home and where every day feels easy, connected, and bright!
-
2026-04-03$99,900 Active 1149-char remark
Show marketing remark (1149 chars)
Welcome to The Talisman Condominiums — where comfort, convenience, and community come together! Step inside this bright and airy top-floor, one-bedroom home and discover a space filled with natural light and fresh updates throughout. Enjoy brand-new carpet and padding, fresh paint in every room, new blinds in the dining area, making this home truly move-in ready. Relax on two private balconies or take advantage of the amazing amenities right outside your door with a sparkling pool, a fully equipped fitness center, a friendly dog park, and a welcoming community clubhouse, all included in the incredible HOA package. Even better, your HOA covers almost everything: water, gas, snow removal, landscaping, exterior and HVAC maintenance, and trash service — so you only need to take care of internet and electricity. A new roof was also completed just last year! Great Price and value in this amazing gated community HOA dues are $344/month, with a temporary $100/mo. roofing assessment that ends in just eight months. Come see why The Talisman is the perfect place to call home and where every day feels easy, connected, and bright!
-
2019-04-12soldstatus
-
1998-10-15soldstatus
-
1996-07-12soldstatus
ⓘ Source: listings_history table (triggers on properties + properties_extension) + one-shot
backfill from property_details.listing_events for pre-trigger history.
Tax reassessment forecast MO · Resets to sale price
- Current annual tax
- $991 · $83/mo
- Projected year-2 tax
- $991 · $83/mo
- Expected delta
- $0/yr ($0/mo · -0.0%)
ⓘ Screening estimate from a state-policy table — verify with the county assessor before closing.
Climate risk First Street
- Flood 1/10 Low FEMA zone X (unshaded) · 0% chance over 30 yrs
- Wildfire 1/10 Low
- Heat 4/10 Moderate 7 d/yr ≥108°F today · 17 d/yr by 30 yrs out
- Wind 2/10 Low
- Air quality 3/10 Moderate 3 unhealthy d/yr today · 3 by 30 yrs out
Nearby sold comps map
Loading sold comps map…
Walkable amenities ~0.75 mi
Loading nearby amenities…
Taxation est. · year 1
- Rental income
- $12,977
- − Mortgage interest
- −$5,321
- − Property taxes
- −$991
- − Insurance
- −$475
- − Repairs & maintenance
- −$1,038
- − Management
- −$1,038
- − HOA
- −$4,128
- − Depreciation
- −$2,764
- Taxable loss
- −$2,779
- Est. tax savings @ 24.0%
- +$667
- After-tax cash flow
- $-654/yr
For passive investors: Depreciation is non-cash, so a rental often shows a tax loss while cash-flowing — sheltering income. Rental losses are passive: they offset passive income freely, and up to $25,000/yr can offset ordinary (W-2) income if you actively participate and your MAGI is under $100k (phasing out to $0 by $150k); unused losses carry forward. On sale, claimed depreciation is recaptured at up to 25%, and gains may owe capital-gains tax (a 1031 exchange can defer both). Figures are a year-1 estimate at your 24.0% rate — not tax advice; consult a CPA.
Schools (NCES district)
- District
- Center 58
- NCES district ID
- 2908250
- Math proficiency
- 12% ▼ -15.00%
- Reading proficiency
- 29% ▼ -6.00%
- Median HH income
- $43,544
- Composite
- 17.64/100
- National rank
- #9031
- State rank
- #301 of 324 in MO
Livability — Kansas City
- Score
- 78/100
- State rank
- #28
- US rank
- #2671
Category grades
Schools grade is shown separately in the Schools card above.
Census & demographics
- Census place
- Kansas City, MO
- County
- Jackson County · 687,798 people
- City population
- 439,467
- Metro
- Kansas City, MO-KS
- Population (ZIP)
- 24,229
- Household income
- $81,275
- Rent vs Own
- Severe rent burden
- 851.0
Population outlook (Jackson County) Hauer SSP2
- Today (2025)
- 719,589 people
- By 2030
- 731,456 · +1.6%
- By 2040
- 746,689 · +3.8%
- By 2050
- 749,289 · +4.1%
- By 2075
- 736,227 · +2.3%
- By 2100
- 668,210 · -7.1%
Race, ethnicity, and origin ACS 2023
- Neighborhood character
- Predominantly White (75%)
- Race & ethnicity
- White 75% Black 11% Two or more races 8% Hispanic / Latino 7% Asian 3%
- Hispanic origin (detail)
- Mexican 5%
- Common ancestry
- Lithuanian 3% Italian 3% Romanian 2%
- Foreign-born
- 4% · Canada
- Languages at home
- 93% English-only · Spanish 3% Other Indo-European 2%
Political lean MEDSL · Jackson
- 2024 margin
- D (+19.3) · D 58.9% · R 39.5% · Other 1.6%
- 2008→2024 swing
- -6.1pp toward R · 2008: 25.4pp · 2024: 19.3pp
- All cycles
- 2024: D+19.3 2020: D+22.0 2016: D+16.6 2012: D+19.0 2008: D+25.4
Not yet ingested
- Civics
- —
Market trends
- HPI YoY
- ▼ -311.24%
- Current HPI
- 280.5587
- Rent YoY
- ▲ 4.57%
- Metro
- Kansas City, MO-KS
- State GDP YoY
- ▲ 1.84%
- F500 in state
- 20
Industry mix (Fortune 500 HQ in MO)
| Industry | F500 HQs | Revenue |
|---|---|---|
| Healthcare | 1 | $163B |
|
||
| Insurance | 1 | $21B |
|
||
| Industrial Technology | 1 | $17B |
|
||
| Retail | 1 | $16B |
|
||
| Industrial Distribution | 1 | $10B |
|
||
| Utilities | 1 | $9B |
|
||
Price history
-4.9% since first listed5 events — show timeline
- 2026-04-24 Price Changed $95,000 Heartland MLS as Distributed by MLS Grid
- 2026-04-03 Listed $99,900 Heartland MLS as Distributed by MLS Grid
- 2019-04-12 Sold (Public Records) — Public Records
- 1998-10-15 Sold (Public Records) — Public Records
- 1996-07-12 Sold (Public Records) — Public Records
Property tax history
+3.1%/yrLatest (2025): $991 · -0.5% YoY. Source: county tax records.
Cash-flow waterfall
monthlySold comps — $/sqft
last 12 mo · ≤1 miLoading sold comps…