 Duplex
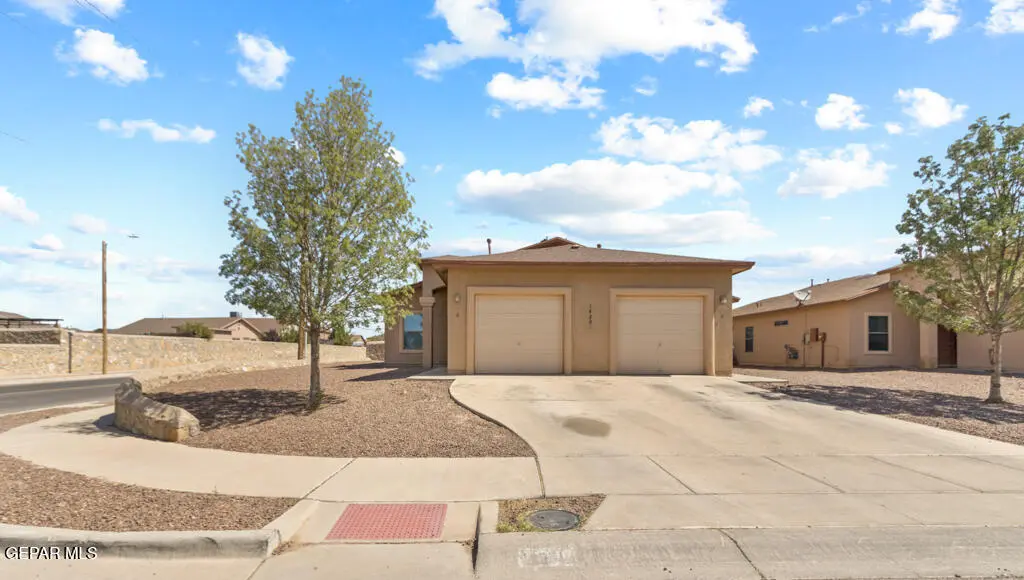
14301 Arthur Ashe Ct Unit A & B · El Paso, TX
Flood risk 1/10 · Minimal
- FEMA flood zone
- X
- Chance of flooding over 30 yrs
- 0.0%
- Est. flood insurance / yr
- $507 – $1,088
Fire risk 3/10 · Minor
- Est. fire insurance / yr
- $1,222 – $2,270
Heat risk 6/10 · Moderate
- Hot days now (above 101°F)
- 7 days/yr
- Hot days in 30 yrs
- 25 days/yr
Wind risk 1/10 · Minimal
- Chance of severe wind over 30 yrs
- —
Air-quality risk 3/10 · Minor
- Unhealthy air days now
- 2 days/yr
- Unhealthy air days in 30 yrs
- 3 days/yr
Risk factors via First Street. Map © Google.
Why this score? — see what drove the D grade
The composite is a weighted blend of 9 inputs, each scored 0–100. Each bar is that input's sub-score; the figure is the points it added to the 100-point composite (weight × sub-score).
- Cash flow +12.4/30.0
- ARV discount +7.5/15.0
- Livability +4.0/5.0
- Condition / age +4.0/5.0
- DSCR +3.7/10.0
- 1% rule +3.5/10.0
- Rent growth +3.0/5.0
- Schools +2.6/10.0
- Appreciation +0.0/10.0
$349,000
🖨 Deal sheet 📄 Offer letter ✓ Due diligence
Multi-family units
County records classify this as Multi-Family (2-4 Unit). Listing-text estimate: 2 units. confirmed
Listing remarks
Welcome to a turnkey Eastside duplex located in a private cul-de-sac in the Tierra Del Este subdivision! This 1-story property is an investor's dream, or the perfect opportunity for an owner-occupant to live in one unit while renting out the other! Unit A features 3BD/2BA with 1289 sq. ft. , while Unit B offers 2BD/2BA with 996 sq. ft. Both units provide open living areas equipped with refrigerated A/C, a mix of carpet and tile flooring, and a full appliance package including refrigerators. Each unit features a spacious, attached 1-car garage with laundry hookups & extra storage. Outside, expansive backyards enhance the property's appeal, offering plenty of space for recreation or fut
Key facts
- Expansive backyards
- Turnkey duplex
- Open living areas
Tags
Property features AI
Finance
- Other: Both units currently tenant-occupied on month-to-month tenancies; please do not disturb tenants (appointments through listing agent).
Exterior
- Parking: 1 garage space; 1 space per unit
- Utilities: City utilities; Community sewer
- Home design: Duplex; Two total units
- Construction: Adobe and stucco exterior; Composition/shingle roof; Total building area approximately 2283
- Exterior features: Composition/shingle roof; Adobe and stucco construction; Lot approximately 0.22 acres
Interior
- Kitchen: Refrigerator; Microwave; Free-standing gas oven; Dishwasher
- Flooring: Carpet; Tile
- Heating & cooling: Central heating (forced air, natural gas); Central air conditioning (refrigerated)
- Interior features: Carpet and tile flooring; See remarks for additional interior details
Neighborhood map
What this means for you Summary
Snapshot
- This is a 1×3bd/2ba + 1×2bd/2ba units multifamily listed at $349k. Condition is rated good.
Deal economics
- At list price, monthly cash flow is $-56 ($-673/yr) — negative. Per door: $-28/mo.
- To cash-flow at today's rent, offer at most $341k (2.3% below list).
- To meet the 1% rule (rent ≥ 1% of price), the offer needs to be $298k (14.6% below list).
- Recommended offer: $298k (14.6% below list) — sets the bar for 1% rule.
Location & tenants
- Location reads 81/100 on livability (#23 in TX, #1,375 nationally) — a professional / high-income tenant draw. Strengths: commute A+, cost of living A+, housing A+; Watch: employment D+.
- Socorro ISD (urban): math 23% / reading 36% proficiency, ranked #624 of 826 in TX (top 76%) — low school quality limits family demand, transient renter base, plan for 1-2y turnover; 66% free/reduced lunch — lower-income household profile, screen leases tightly.
- Zoned schools: Spec Rafael Hernando Middle (math 27% / reading 28%, grade F, #1,156 of 1,662 statewide, top 71%, 752 students, 72% FRL); Pebble Hills H S (math 21% / reading 47%, grade F, #1,002 of 1,632 statewide, top 62%, 2,888 students, 63% FRL) — zoned schools at 68% FRL track the district average.
- Market conditions: Rents rising (+2.1%/yr); 1183 active listings in the ZIP; 20 comparable units currently listed for rent nearby; rentals at typical pace (median 24d on market — plan ~3-4 weeks tenant-placement turnaround); 45% of comp listings sitting > 30 days — soft ceiling on asking rent; solid renter incomes; 2,196 units permitted in El Paso County in 2024 (143 in 5+ unit buildings).
- At $2,982/mo this rent would consume 46% of the median local household income ($77k/yr) (locally 900% of renters already pay >50% of income on rent) — very limited rent-growth headroom before tenants either downsize or default.
Forward outlook
- Local home prices are declining (-3.0%/yr); year-one equity from $2k of loan paydown is wiped out by about $10k of value loss. Plan a longer hold.
- El Paso County population projected at +10% by 2050 — modest demand growth; plan on rents tracking national, not racing it.
Negotiation context
- It's been on market 20 days — a 2% lower offer ($344k) is reasonable based on typical stale-listing flexibility.
- 4 sale attempts since 15y ago with the ask held roughly flat each time — persistent listings suggest the price (not the market) is what's stuck; bring a comps-based counter.
Risks & watch-outs
- Climate carrying-cost: extreme-heat days projected 7→25/yr by 2055 (HVAC capex compounding) — expect insurance premiums to compound above CPI over the hold.
Questions for the listing agent
- What do current leases actually rent for vs. the listed asking? Can we see a recent rent roll and the last 12 months of T-12 income?
- Can we see the unit-by-unit rent roll, current vacancy, and any below-market leases? What's the average tenancy length?
- What capital expenditures (roof, boiler, parking lot, exteriors) have been made in the last 5 years, and what's planned in the next 2?
- Is there a deadline driving the sale (1031 exchange, divorce, estate, relocation)? That informs how much negotiation room exists.
- Schools are B-rated — typically a magnet for longer-tenancy family renters. What's the average tenant stay here, and is there a school-zone premium baked into asking?
- The area grade is low — what's the realistic commute time and amenity access for the typical tenant pool here? Any planned neighborhood developments (good or bad) we should know about?
- What's the average days-on-market for RENTAL listings here right now (not sales)? A rising rental-DOM trend means longer vacancies and softer asking-rent achievability than the comps imply.
- What's the recent tenant-quality profile in this submarket — average credit score on applications, eviction rate, late-payment / NSF rate, and stable-employment percentage? A property-management company in the area should have these aggregated.
- How much new apartment / multifamily construction is in the pipeline within 1–3 miles? Heavy new supply (>2% of stock underway) typically softens rents 12–24 months out; light construction supports rent growth.
Investment metrics
- 1% rule
- 0.85% ✗
- Cap rate
- 6.10%
- Cash-on-cash
- -0.69%
- DSCR
- 0.97
- GRM
- 9.8
CMA / ARV
No comps found within radius.
Projected returns pro-forma
-3.0% appreciation · 2.06% rent growth · sell at horizon
- IRR
- -18.5%
- Equity multiple
- 0.36×
- Total profit
- $-62,874
- Equity at exit
- $52,037
- IRR
- -12.8%
- Equity multiple
- 0.28×
- Total profit
- $-70,417
- Equity at exit
- $30,175
Cash invested: $97,720 (down + closing). Projections, not guarantees.
Landlord ↔ Tenant lean methodology
- Overall (STATE)
- 87 Strongly Landlord-Friendly
- State Texas
- 87 Strongly Landlord-Friendly · R+5
- County
- — inherits STATE
- City
- — inherits STATE
ZIP-level market 79938
- Home prices YoY
- -8.6%
- Rents YoY
- 2.1%
- Active inventory
- 1183
- Price-to-rent
- 18.8×
Monthly cashflow live
- Estimated rent
- $2,982 high interval (Pro) →
- Mortgage (P&I)
- −$1,830
- Tax est. 1.5%
- −$436 /mo · $5,235/yr
- Insurance
- −$145
- HOA
- −$0
- Vacancy / Maint / Mgmt
- −$626
- Net cashflow
- $-56
Break-even live
2-unit breakdown (identical units grouped — click to expand)
| Units | Beds | Baths | Est. rent |
|---|---|---|---|
| 1× unit | 3 | 2 | $1,548 |
| 1× unit | 2 | 2 | $1,435 |
| Total (2 units) | $2,982 | ||
UW: 25.0% down · 7.5% · 30yr · 1.5% tax · 5.0% vac · 8.0% maint · 8.0% mgmt
Financing live
Cash to close
- Down payment
- $87,250
- Closing costs
- $10,470
- Reserves months
- —
- Total cash needed
- —
Loan-product check · same deal, 3 products live
Conventional
25% down · 7.5% · 30yr
- Down + closing
- —
- Monthly P&I
- —
- Monthly cashflow
- —
- DSCR
- —
- Eligible?
- —
Personal DTI + credit; lowest rate.
DSCR
20% down · 8.5% · 30yr
- Down + closing
- —
- Monthly P&I
- —
- Monthly cashflow
- —
- DSCR
- —
- Eligible?
- —
No personal income docs; deal must DSCR.
Hard money
10% down · 12.0% · 12mo
- Down + closing
- —
- Monthly P&I
- —
- Monthly cashflow
- —
- DSCR
- —
- Eligible?
- —
Short-term bridge; refi at stabilization.
Rent comps 20 comps
| Address | Beds | Baths | Sqft | Rent | $/sqft | DOM | Units | Dist |
|---|---|---|---|---|---|---|---|---|
| 14272 Lasso Rock Dr El Paso, TX | 3.0 | 2.0 | 1785 | $1,650 | $0.92 | 14d | 1 | 0.09mi |
| 2417 Sparrow Point St El Paso, TX | 3.0 | 2.5 | 1816 | $1,700 | $0.94 | 43d | 1 | 0.31mi |
| 14220 Firewood Dr El Paso, TX | 3.0 | 2.5 | 1653 | $1,800 | $1.09 | 43d | 1 | 0.34mi |
| 2240 Decamp Point Pl El Paso, TX | 3.0 | 2.5 | 1593 | $1,800 | $1.13 | 11d | 1 | 0.54mi |
| 3133 Clearbrook Pl El Paso, TX | 3.0 | 2.0 | 2155 | $2,035 | $0.94 | 23d | 1 | 0.82mi |
| 14267 John Scagno El Paso, TX | 3.0 | 2.0 | 1951 | $2,100 | $1.08 | 43d | 1 | 0.87mi |
| 3249 Emerald Point Dr El Paso, TX | 3.0 | 2.5 | 2351 | $2,000 | $0.85 | 11d | 1 | 0.87mi |
| 14241 Smokey Point Dr El Paso, TX | 3.0 | 2.0 | 1604 | $1,850 | $1.15 | 43d | 1 | 0.99mi |
| 14628 Rockbridge Ave El Paso, TX | 3.0 | 2.0 | 1608 | $1,595 | $0.99 | 21d | 1 | 1.00mi |
| 14613 Sunny Land Ave El Paso, TX | 3.0 | 2.5 | 2502 | $2,235 | $0.89 | 3d | 1 | 1.01mi |
| 3329 Scarlet Point Dr El Paso, TX | 3.0 | 2.0 | 1623 | $1,650 | $1.02 | 43d | 1 | 1.04mi |
| 14205 Spanish Point Dr El Paso, TX | 3.0 | 2.5 | 1640 | $1,800 | $1.10 | 43d | 1 | 1.04mi |
| 3237 Christian Cunningham El Paso, TX | 3.0 | 2.0 | 1660 | $1,895 | $1.14 | 3d | 1 | 1.08mi |
| 2853 Time Rock Pl El Paso, TX | 3.0 | 3.0 | 2075 | $1,995 | $0.96 | 43d | 1 | 1.09mi |
| 14267 Pacific Point Dr El Paso, TX | 3.0 | 2.5 | 1592 | $1,750 | $1.10 | 43d | 1 | 1.14mi |
| 14176 Charles Pollock Ave El Paso, TX | 3.0 | 3.0 | 1617 | $1,795 | $1.11 | 43d | 1 | 1.18mi |
| 3144 Hidden Creek Dr El Paso, TX | 3.0 | 2.5 | 2258 | $1,995 | $0.88 | 14d | 1 | 1.24mi |
| 14258 Loma Esmeralda Dr El Paso, TX | 3.0 | 2.0 | 1676 | $2,250 | $1.34 | 14d | 1 | 1.33mi |
| 12867 Hidden Grove Dr El Paso, TX | 3.0 | 2.5 | 2408 | $2,650 | $1.10 | 14d | 1 | 1.36mi |
| 14032 Tierra Creel Ln El Paso, TX | 3.0 | 2.5 | 2099 | $1,995 | $0.95 | 14d | 1 | 1.47mi |
Listing history 12 events
-
2026-06-05statusdays on market $349,000 Pending 20 DOM
-
2026-06-03days on market $349,000 Active 19 DOM
-
2026-06-03days on market $349,000 Active 18 DOM
-
2026-06-01days on market $349,000 Active 17 DOM
-
2026-05-31days on market $349,000 Active 16 DOM
-
2026-05-12$349,000 Active 1023-char remark
-
2018-08-08status Pending
-
2018-07-19$239,000 Active
-
2012-03-23historical
-
2011-10-13$204,950
-
2011-09-07historical
-
2011-06-14$209,950
ⓘ Source: listings_history table (triggers on properties + properties_extension) + one-shot
backfill from property_details.listing_events for pre-trigger history.
Climate risk First Street
- Flood 1/10 Low FEMA zone X · 0% chance over 30 yrs
- Wildfire 3/10 Moderate
- Heat 6/10 Major 7 d/yr ≥101°F today · 25 d/yr by 30 yrs out
- Wind 1/10 Low
- Air quality 3/10 Moderate 2 unhealthy d/yr today · 3 by 30 yrs out
Nearby sold comps map
Loading sold comps map…
Walkable amenities ~0.75 mi
Loading nearby amenities…
Taxation est. · year 1
- Rental income
- $35,784
- − Mortgage interest
- −$19,549
- − Property taxes
- −$5,235
- − Insurance
- −$1,745
- − Repairs & maintenance
- −$2,863
- − Management
- −$2,863
- − Depreciation
- −$10,153
- Taxable loss
- −$6,624
- Est. tax savings @ 24.0%
- +$1,590
- After-tax cash flow
- $917/yr
For passive investors: Depreciation is non-cash, so a rental often shows a tax loss while cash-flowing — sheltering income. Rental losses are passive: they offset passive income freely, and up to $25,000/yr can offset ordinary (W-2) income if you actively participate and your MAGI is under $100k (phasing out to $0 by $150k); unused losses carry forward. On sale, claimed depreciation is recaptured at up to 25%, and gains may owe capital-gains tax (a 1031 exchange can defer both). Figures are a year-1 estimate at your 24.0% rate — not tax advice; consult a CPA.
Condition & rehab AI · 12 photos
This turnkey Eastside duplex is in good condition with modern amenities and a private setting, making it an excellent investment opportunity.
Value-add opportunities
- Both Painting exterior and interior walls — Enhances curb appeal and interior aesthetics
- Both Landscaping and curb appeal improvements — Enhances curb appeal and property value
- Both New flooring in bathrooms — Improves functionality and aesthetics
- Both New kitchen appliances — Modernizes the kitchen and improves functionality
Renovation cost estimate screening
Value-add ROI direction
- Both Painting exterior and interior walls — Enhances curb appeal and interior aesthetics ↑
- Both Landscaping and curb appeal improvements — Enhances curb appeal and property value ↑
- Both New flooring in bathrooms — Improves functionality and aesthetics ↑
- Both New kitchen appliances — Modernizes the kitchen and improves functionality ↑
ⓘ Cost ranges are severity-bucket heuristics (US national rule-of-thumb). Get contractor quotes + a written scope before underwriting a rehab budget.
Schools (NCES district)
- District
- Socorro ISD
- NCES district ID
- 4840710
- Math proficiency
- 23% ▼ -34.00%
- Reading proficiency
- 36% ▼ -14.00%
- Median HH income
- $49,318
- Composite
- 25.67/100
- National rank
- #7396
- State rank
- #624 of 826 in TX
Livability — El Paso
- Score
- 81/100
- State rank
- #23
- US rank
- #1375
Category grades
Schools grade is shown separately in the Schools card above.
Census & demographics
- Census place
- El Paso, TX
- County
- El Paso County · 761,266 people
- City population
- 630,223
- Metro
- El Paso, TX
- Population (ZIP)
- 99,621
- Household income
- $77,272
- Rent vs Own
- Severe rent burden
- 900.0
Population outlook (El Paso County) Hauer SSP2
- Today (2025)
- 897,899 people
- By 2030
- 922,694 · +2.8%
- By 2040
- 960,492 · +7.0%
- By 2050
- 982,919 · +9.5%
- By 2075
- 997,266 · +11.1%
- By 2100
- 900,630 · +0.3%
Race, ethnicity, and origin ACS 2023
- Neighborhood character
- Predominantly Hispanic (83%)
- Race & ethnicity
- Hispanic / Latino 83% Two or more races 42% White 10% Black 4%
- Hispanic origin (detail)
- Mexican 76% Puerto Rican 1%
- Common ancestry
- Italian 1% Lithuanian 1%
- Foreign-born
- 20% · Canada, Guatemala
- Languages at home
- 36% English-only · Spanish 62%
Political lean MEDSL · El Paso
- 2024 margin
- D (+15.1) · D 57.0% · R 41.8% · Other 1.2%
- 2008→2024 swing
- -17.4pp toward R · 2008: 32.5pp · 2024: 15.1pp
- All cycles
- 2024: D+15.1 2020: D+35.1 2016: D+43.2 2012: D+32.6 2008: D+32.5
Not yet ingested
- Civics
- —
Market trends
- HPI YoY
- ▼ -19.39%
- Current HPI
- 207.2031
- Rent YoY
- ▲ 2.06%
- Metro
- El Paso, TX
- State GDP YoY
- ▲ 3.95%
- F500 in state
- 110
Industry mix (Fortune 500 HQ in TX)
| Industry | F500 HQs | Revenue |
|---|---|---|
| Energy | 16 | $1,198B |
|
||
| Technology | 5 | $198B |
|
||
| Engineering / Construction | 4 | $72B |
|
||
| Energy Services | 3 | $60B |
|
||
| Utilities | 3 | $41B |
|
||
| Healthcare | 2 | $330B |
|
||
Price history
+66.2% since first listed8 events — show timeline
- 2026-06-05 Pending — GEPARMLS
- 2026-05-12 Listed $349,000 GEPARMLS
- 2018-08-08 Pending — GEPARMLS
- 2018-07-19 Listed $239,000 GEPARMLS
- 2012-03-23 Listing Removed — GEPARMLS
- 2011-10-13 Listed $204,950 GEPARMLS
- 2011-09-07 Listing Removed — GEPARMLS
- 2011-06-14 Listed $209,950 GEPARMLS
Cash-flow waterfall
monthlySold comps — $/sqft
last 12 mo · ≤1 miLoading sold comps…