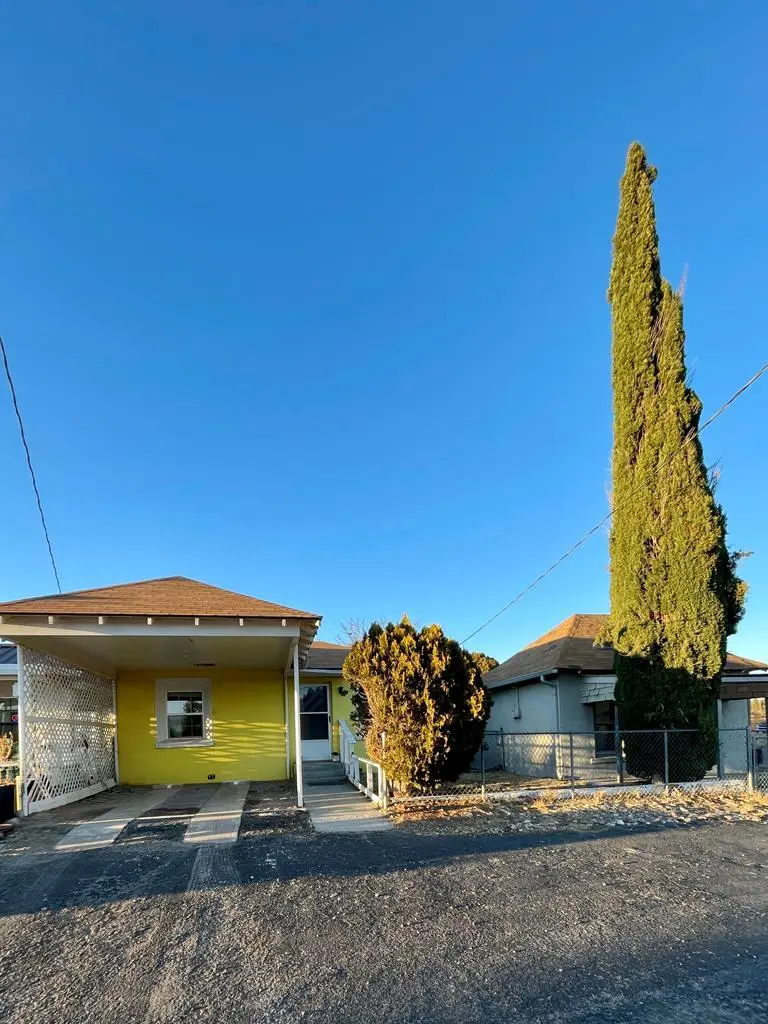
900-902 W El Paso St · Marfa, TX
Flood risk 1/10 · Minimal
- FEMA flood zone
- —
- Chance of flooding over 30 yrs
- 0.0%
- Est. flood insurance / yr
- —
Fire risk 8/10 · Major
- Est. fire insurance / yr
- $1,222 – $2,270
Heat risk 5/10 · Moderate
- Hot days now (above 96°F)
- 6 days/yr
- Hot days in 30 yrs
- 15 days/yr
Wind risk 1/10 · Minimal
- Chance of severe wind over 30 yrs
- —
Air-quality risk 1/10 · Minimal
- Unhealthy air days now
- 0 days/yr
- Unhealthy air days in 30 yrs
- 0 days/yr
Risk factors via First Street. Map © Google.
Why this score? — see what drove the C grade
The composite is a weighted blend of 9 inputs, each scored 0–100. Each bar is that input's sub-score; the figure is the points it added to the 100-point composite (weight × sub-score).
- ARV discount +15.0/15.0
- Cash flow +12.8/30.0
- Appreciation +7.1/10.0
- Schools +4.0/10.0
- DSCR +3.8/10.0
- Condition / age +3.8/5.0
- Livability +3.7/5.0
- 1% rule +3.6/10.0
- Rent growth +2.5/5.0
$250,000
🖨 Deal sheet 📄 Offer letter ✓ Due diligence
Listing remarks MLS
Darling duo of 2 vintage tiny homes before such a thing existed. The pair, sold together consist of a small 3 room adobe with bathroom, the yellow home was built later out of adobe and recently updated with new flooring and windows, updated bathroom with tub and kitchen light commercial zoning - close to Coffield Park and the Mimms walking trail.
Key facts
- Vintage tiny homes
- Small adobe
- Mimms walking trail
Tags
Neighborhood map
What this means for you Summary
Snapshot
- This is a 2-bed/1.5-bath single-family listed at $250k. Condition is rated good.
Deal economics
- At list price, monthly cash flow is $-22 ($-268/yr) — negative.
- To cash-flow at today's rent, offer at most $247k (1.3% below list).
- To meet the 1% rule (rent ≥ 1% of price), the offer needs to be $216k (13.7% below list).
- Recommended offer: $216k (13.7% below list) — sets the bar for 1% rule.
Location & tenants
- Location reads 73/100 on livability (#215 in TX) — a middle-class / working-renter tenant base. Strengths: crime A+, cost of living A+, housing A+; Watch: employment D+, schools D, commute F.
- Marfa ISD (rural): math 45% / reading 45% proficiency, ranked #559 of 1,141 in TX (top 49%) — families likely to look elsewhere, expect single-tenant / working-renter base with shorter leases.
- Market conditions: 79 active listings in the ZIP; 2 comparable units currently listed for rent nearby; 23 units permitted in Presidio County in 2024 (0 in 5+ unit buildings).
Forward outlook
- In year one you build about $12k of equity ($2k loan paydown + $11k appreciation (4.2% local appreciation)).
- Presidio County population projected at -44% by 2050 — secular population decline; favor cash flow + early exit over multi-decade hold.
- At projected returns (4.2% appreciation + 3.0% rent growth), your $70k cash investment doubles in ~5 years — after that, you're playing with house money.
- By year 3, paydown + projected appreciation supports a ~$30k cash-out refi (75% LTV) — recoverable capital for the next deal without selling this one.
Negotiation context
- It's been on market 137 days — a 12% lower offer ($220k) is reasonable based on typical stale-listing flexibility.
Risks & watch-outs
- Watch-outs: built in 1940 — expect roof / HVAC / electrical / plumbing capex.
- Climate carrying-cost: severe wildfire risk; extreme-heat days projected 6→15/yr by 2055 (HVAC capex compounding) — expect insurance premiums to compound above CPI over the hold.
Questions for the listing agent
- What do current leases actually rent for vs. the listed asking? Can we see a recent rent roll and the last 12 months of T-12 income?
- It's been on market 137 days. Have you received any prior offers? Is the seller open to a 14% concession, seller financing, or rate buy-down credit?
- Built in 1940 — when were the roof, HVAC, electrical panel, plumbing, and water heater last replaced?
- Why hasn't it sold? Are there any deal-killer items the seller is aware of (foundation, flood, title, zoning, code violations)?
- Is there a deadline driving the sale (1031 exchange, divorce, estate, relocation)? That informs how much negotiation room exists.
- Schools are D-rated, which usually means shorter tenancies and higher turnover. Who's the typical renter profile here, and what's been the actual vacancy rate?
- What's the average days-on-market for RENTAL listings here right now (not sales)? A rising rental-DOM trend means longer vacancies and softer asking-rent achievability than the comps imply.
- What's the recent tenant-quality profile in this submarket — average credit score on applications, eviction rate, late-payment / NSF rate, and stable-employment percentage? A property-management company in the area should have these aggregated.
- How much new for-sale + rental construction is in the pipeline within 1–3 miles? Heavy new supply typically softens prices + rents 12–24 months out; constrained supply supports both.
Investment metrics
- 1% rule
- 0.86% ✗
- Cap rate
- 6.19%
- Cash-on-cash
- -0.38%
- DSCR
- 0.98
- GRM
- 9.7
CMA / ARV
- ARV (median comp)
- $481,599
- List price
- $250,000
- Delta
- -48.09%
- Verdict
- UNDERPRICED
- Comps
- 3 within 1.0 mi
Projected returns pro-forma
4.23% appreciation · 3.0% rent growth · sell at horizon
- IRR
- 10.6%
- Equity multiple
- 1.65×
- Total profit
- $45,380
- Equity at exit
- $130,126
- IRR
- 12.2%
- Equity multiple
- 3.06×
- Total profit
- $144,132
- Equity at exit
- $215,568
Cash invested: $70,000 (down + closing). Projections, not guarantees.
Landlord ↔ Tenant lean methodology
- Overall (STATE)
- 87 Strongly Landlord-Friendly
- State Texas
- 87 Strongly Landlord-Friendly · R+5
- County
- — inherits STATE
- City
- — inherits STATE
ZIP-level market 79843
- Home prices YoY
- 2.0%
- Active inventory
- 79
- Price-to-rent
- 9.7×
Monthly cashflow live
- Estimated rent
- $2,159 medium interval (Pro) →
- Mortgage (P&I)
- −$1,311
- Tax est. 1.5%
- −$312 /mo · $3,750/yr
- Insurance
- −$104
- HOA
- −$0
- Vacancy / Maint / Mgmt
- −$453
- Net cashflow
- $-22
Break-even live
UW: 25.0% down · 7.5% · 30yr · 1.5% tax · 5.0% vac · 8.0% maint · 8.0% mgmt
Financing live
Cash to close
- Down payment
- $62,500
- Closing costs
- $7,500
- Reserves months
- —
- Total cash needed
- —
Loan-product check · same deal, 3 products live
Conventional
25% down · 7.5% · 30yr
- Down + closing
- —
- Monthly P&I
- —
- Monthly cashflow
- —
- DSCR
- —
- Eligible?
- —
Personal DTI + credit; lowest rate.
DSCR
20% down · 8.5% · 30yr
- Down + closing
- —
- Monthly P&I
- —
- Monthly cashflow
- —
- DSCR
- —
- Eligible?
- —
No personal income docs; deal must DSCR.
Hard money
10% down · 12.0% · 12mo
- Down + closing
- —
- Monthly P&I
- —
- Monthly cashflow
- —
- DSCR
- —
- Eligible?
- —
Short-term bridge; refi at stabilization.
Rent comps 2 comps
| Address | Beds | Baths | Sqft | Rent | $/sqft | DOM | Units | Dist |
|---|---|---|---|---|---|---|---|---|
| 104 E Waco St Marfa, TX | 2.0 | 1.0 | 991 | $2,000 | $2.02 | 21d | 1 | 0.66mi |
| 702 E Washington St Marfa, TX | 3.0 | 2.0 | 1350 | $2,350 | $1.74 | 19d | 1 | 1.01mi |
Listing history 16 events
-
2026-06-18days on market $250,000 Active 137 DOM
-
2026-06-17days on market $250,000 Active 136 DOM
-
2026-06-16days on market $250,000 Active 135 DOM
-
2026-06-15days on market $250,000 Active 134 DOM
-
2026-06-14days on market $250,000 Active 132 DOM
-
2026-06-10days on market $250,000 Active 129 DOM
-
2026-06-09days on market $250,000 Active 128 DOM
-
2026-06-08days on market $250,000 Active 127 DOM
-
2026-06-07days on market $250,000 Active 126 DOM
-
2026-06-05days on market $250,000 Active 123 DOM
-
2026-06-03days on market $250,000 Active 122 DOM
-
2026-06-02days on market $250,000 Active 121 DOM
-
2026-06-01days on market $250,000 Active 120 DOM
-
2026-05-31days on market $250,000 Active 119 DOM
-
2026-05-31days on market $250,000 Active 118 DOM
-
2026-02-01$250,000 Active 348-char remark
Show marketing remark (348 chars)
Darling duo of 2 vintage tiny homes before such a thing existed. The pair, sold together consist of a small 3 room adobe with bathroom, the yellow home was built later out of adobe and recently updated with new flooring and windows, updated bathroom with tub and kitchen light commercial zoning - close to Coffield Park and the Mimms walking trail.
ⓘ Source: listings_history table (triggers on properties + properties_extension) + one-shot
backfill from property_details.listing_events for pre-trigger history.
Climate risk First Street
- Flood 1/10 Low 0% chance over 30 yrs
- Wildfire 8/10 Severe
- Heat 5/10 Major 6 d/yr ≥96°F today · 15 d/yr by 30 yrs out
- Wind 1/10 Low
- Air quality 1/10 Low 0 unhealthy d/yr today · 0 by 30 yrs out
Nearby sold comps map
Loading sold comps map…
Walkable amenities ~0.75 mi
Loading nearby amenities…
Taxation est. · year 1
- Rental income
- $25,904
- − Mortgage interest
- −$14,004
- − Property taxes
- −$3,750
- − Insurance
- −$1,250
- − Repairs & maintenance
- −$2,072
- − Management
- −$2,072
- − Depreciation
- −$7,273
- Taxable loss
- −$4,517
- Est. tax savings @ 24.0%
- +$1,084
- After-tax cash flow
- $816/yr
For passive investors: Depreciation is non-cash, so a rental often shows a tax loss while cash-flowing — sheltering income. Rental losses are passive: they offset passive income freely, and up to $25,000/yr can offset ordinary (W-2) income if you actively participate and your MAGI is under $100k (phasing out to $0 by $150k); unused losses carry forward. On sale, claimed depreciation is recaptured at up to 25%, and gains may owe capital-gains tax (a 1031 exchange can defer both). Figures are a year-1 estimate at your 24.0% rate — not tax advice; consult a CPA.
Condition & rehab AI · 12 photos
This property features updated interiors with new flooring and windows, making it move-in ready with good curb appeal.
Value-add opportunities
- Both Paint exterior trim — Enhances curb appeal and value
- Both Replace light fixture in living room — Improves aesthetics and functionality
Renovation cost estimate screening
Value-add ROI direction
- Both Paint exterior trim — Enhances curb appeal and value ↑
- Both Replace light fixture in living room — Improves aesthetics and functionality ↑
ⓘ Cost ranges are severity-bucket heuristics (US national rule-of-thumb). Get contractor quotes + a written scope before underwriting a rehab budget.
Schools (NCES district)
- District
- Marfa ISD
- NCES district ID
- 4829040
- Math proficiency
- 45% ▲ 10.00%
- Reading proficiency
- 45% ▬ 0.00%
- Median HH income
- $41,354
- Composite
- 40.04/100
- National rank
- #7884
- State rank
- #559 of 1141 in TX
Livability — Marfa
- Score
- 73/100
- State rank
- #215
- US rank
- #5308
Category grades
Schools grade is shown separately in the Schools card above.
Census & demographics
- Census place
- Marfa, TX
- Population (ZIP)
- 2,578
Population outlook (Presidio County) Hauer SSP2
- Today (2025)
- 5,330 people
- By 2030
- 4,671 · -12.4%
- By 2040
- 3,654 · -31.4%
- By 2050
- 3,001 · -43.7%
- By 2075
- 2,326 · -56.4%
- By 2100
- 2,106 · -60.5%
Race, ethnicity, and origin ACS 2023
- Neighborhood character
- Diverse neighborhood (Simpson 0.58)
- Race & ethnicity
- Hispanic / Latino 48% White 44% Two or more races 33% Native American 5%
- Hispanic origin (detail)
- Mexican 45%
- Common ancestry
- Romanian 10% Iranian 2% Lithuanian 2%
- Foreign-born
- 18% · Canada
- Languages at home
- 61% English-only · Spanish 39%
Political lean MEDSL · Presidio
- 2024 margin
- Solid D (+30.2) · D 64.6% · R 34.4%
- 2008→2024 swing
- -13.2pp toward R · 2008: 43.4pp · 2024: 30.2pp
- All cycles
- 2024: D+30.2 2020: D+33.5 2016: D+36.6 2012: D+42.5 2008: D+43.4
Not yet ingested
- Civics
- —
Market trends
- HPI YoY
- ▲ 4.23%
- Current HPI
- 214.5241
- Rent YoY
- —
- Metro
- —
- State GDP YoY
- ▲ 3.95%
- F500 in state
- 110
Industry mix (Fortune 500 HQ in TX)
| Industry | F500 HQs | Revenue |
|---|---|---|
| Energy | 16 | $1,198B |
|
||
| Technology | 5 | $198B |
|
||
| Engineering / Construction | 4 | $72B |
|
||
| Energy Services | 3 | $60B |
|
||
| Utilities | 3 | $41B |
|
||
| Healthcare | 2 | $330B |
|
||
Price history
1 event — show timeline
- 2026-02-01 Listed $250,000 ODMLS
Cash-flow waterfall
monthlySold comps — $/sqft
last 12 mo · ≤1 miLoading sold comps…