4437 Sybil Dr · North Whitehall, PA
Flood risk 1/10 · Minimal
- FEMA flood zone
- X (unshaded)
- Chance of flooding over 30 yrs
- 0.0%
- Est. flood insurance / yr
- $507 – $1,088
Fire risk 1/10 · Minimal
- Est. fire insurance / yr
- $511 – $949
Heat risk 4/10 · Minor
- Hot days now (above 99°F)
- 7 days/yr
- Hot days in 30 yrs
- 15 days/yr
Wind risk 4/10 · Minor
- Chance of severe wind over 30 yrs
- 13.0%
Air-quality risk 2/10 · Minimal
- Unhealthy air days now
- 1 days/yr
- Unhealthy air days in 30 yrs
- 3 days/yr
Risk factors via First Street. Map © Google.
Why this score? — see what drove the B grade
The composite is a weighted blend of 9 inputs, each scored 0–100. Each bar is that input's sub-score; the figure is the points it added to the 100-point composite (weight × sub-score).
- Cash flow +30.0/30.0
- 1% rule +10.0/10.0
- DSCR +10.0/10.0
- ARV discount +7.5/15.0
- Schools +5.7/10.0
- Appreciation +5.4/10.0
- Rent growth +2.5/5.0
- Livability +2.5/5.0
- Condition / age +1.0/5.0
$115,900
🖨 Deal sheet 📄 Offer letter ✓ Due diligence
Listing remarks
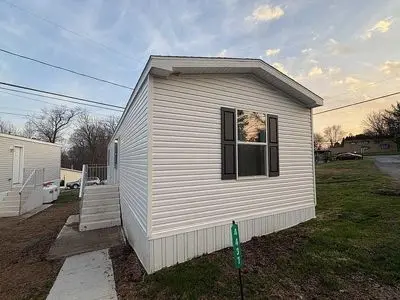
Welcome home to this beautiful brand-new 2 bedroom, 2 bathroom home located in the desirable Woodside MHP community! This modern home offers the perfect blend of comfort, style, and low-maintenance living. Step inside to an open-concept layout featuring a spacious living area that flows seamlessly into a bright, fully equipped kitchen with sleek cabinetry, energy-efficient appliances, and plenty of counter space-perfect for entertaining or everyday living. The primary bedroom includes a private en-suite bathroom for added convenience, while the second bedroom and full guest bath provide flexibility for family, guests, or a home office. With brand-new finishes throughout, energy-efficient co
Key facts
- Built 2026
- Listed 15 days
Property features AI
Exterior
- Home design: New construction completed in 2026
- Construction: Built in 2026
- Exterior features: Located in the Orefield subdivision
Neighborhood map
What this means for you Summary
Snapshot
- This is a 2-bed/2.0-bath other listed at $116k. Condition is rated poor.
Deal economics
- At list price, monthly cash flow is $1k ($18k/yr) — positive.
- The deal already cash-flows at list — no discount required.
- Meets the 1% rule at list price ($3k rent vs $116k).
- Recommended offer: $114k (1.5% below list) — sets the bar for market timing.
Location & tenants
- Location reads: area grade B — affects rentability + tenant quality, not the cash-flow math above.
- Parkland SD (suburban): math 59% / reading 70% proficiency, ranked #40 of 539 in PA (top 7%) — acceptable for families but not a draw, mixed tenant base, ~2y average lease; only 15% free/reduced lunch — higher-income household profile.
- Market conditions: 51 active listings in the ZIP; 765 units permitted in Lehigh County in 2024 (286 in 5+ unit buildings).
Forward outlook
- In year one you build about $2k of equity ($801 loan paydown + $1k appreciation (0.9% local appreciation)).
- Lehigh County population projected at +21% by 2050 — long-run rental-demand tailwind backs the buy-and-hold thesis.
- At projected returns (0.9% appreciation + 3.0% rent growth), your $32k cash investment doubles in ~2 years — after that, you're playing with house money.
Negotiation context
- It's been on market 15 days — a 2% lower offer ($114k) is reasonable based on typical stale-listing flexibility.
Questions for the listing agent
- Have any recent inspections been done? Can we get a copy of the seller's disclosures and any deferred-maintenance estimates?
- Is there a deadline driving the sale (1031 exchange, divorce, estate, relocation)? That informs how much negotiation room exists.
- What's the average days-on-market for RENTAL listings here right now (not sales)? A rising rental-DOM trend means longer vacancies and softer asking-rent achievability than the comps imply.
- What's the recent tenant-quality profile in this submarket — average credit score on applications, eviction rate, late-payment / NSF rate, and stable-employment percentage? A property-management company in the area should have these aggregated.
- How much new for-sale + rental construction is in the pipeline within 1–3 miles? Heavy new supply typically softens prices + rents 12–24 months out; constrained supply supports both.
Investment metrics
- 1% rule
- 2.47% ✓
- Cap rate
- 21.39%
- Cash-on-cash
- 53.93%
- DSCR
- 3.40
- GRM
- 3.4
CMA / ARV
No comps found within radius.
Projected returns pro-forma
0.88% appreciation · 3.0% rent growth · sell at horizon
- IRR
- 56.5%
- Equity multiple
- 3.91×
- Total profit
- $94,405
- Equity at exit
- $38,828
- IRR
- 58.1%
- Equity multiple
- 7.87×
- Total profit
- $222,905
- Equity at exit
- $51,032
Cash invested: $32,452 (down + closing). Projections, not guarantees.
Landlord ↔ Tenant lean methodology
- Overall (STATE)
- 62 Landlord-Friendly
- State Pennsylvania
- 62 Landlord-Friendly · EVEN
- County
- — inherits STATE
- City
- — inherits STATE
ZIP-level market 18069
- Home prices YoY
- 0.3%
- Active inventory
- 51
- Price-to-rent
- 3.4×
Monthly cashflow live
- Estimated rent
- $2,860 medium interval (Pro) →
- Mortgage (P&I)
- −$608
- Tax est. 1.5%
- −$145 /mo · $1,738/yr
- Insurance
- −$48
- HOA
- −$0
- Vacancy / Maint / Mgmt
- −$601
- Net cashflow
- $1,458
Break-even live
UW: 25.0% down · 7.5% · 30yr · 1.5% tax · 5.0% vac · 8.0% maint · 8.0% mgmt
Financing live
Cash to close
- Down payment
- $28,975
- Closing costs
- $3,477
- Reserves months
- —
- Total cash needed
- —
Loan-product check · same deal, 3 products live
Conventional
25% down · 7.5% · 30yr
- Down + closing
- —
- Monthly P&I
- —
- Monthly cashflow
- —
- DSCR
- —
- Eligible?
- —
Personal DTI + credit; lowest rate.
DSCR
20% down · 8.5% · 30yr
- Down + closing
- —
- Monthly P&I
- —
- Monthly cashflow
- —
- DSCR
- —
- Eligible?
- —
No personal income docs; deal must DSCR.
Hard money
10% down · 12.0% · 12mo
- Down + closing
- —
- Monthly P&I
- —
- Monthly cashflow
- —
- DSCR
- —
- Eligible?
- —
Short-term bridge; refi at stabilization.
Listing history 11 events
-
2026-06-18days on market $115,900 Active 15 DOM
-
2026-06-17days on market $115,900 Active 14 DOM
-
2026-06-16days on market $115,900 Active 13 DOM
-
2026-06-15days on market $115,900 Active 12 DOM
-
2026-06-14days on market $115,900 Active 10 DOM
-
2026-06-13days on market $115,900 Active 9 DOM
-
2026-06-10days on market $115,900 Active 7 DOM
-
2026-06-09days on market $115,900 Active 6 DOM
-
2026-06-08days on market $115,900 Active 5 DOM
-
2026-06-07remarks 699-char remark
-
2026-06-07$115,900 Active 4 DOM
ⓘ Source: listings_history table (triggers on properties + properties_extension) + one-shot
backfill from property_details.listing_events for pre-trigger history.
Climate risk First Street
- Flood 1/10 Low FEMA zone X (unshaded) · 0% chance over 30 yrs
- Wildfire 1/10 Low
- Heat 4/10 Moderate 7 d/yr ≥99°F today · 15 d/yr by 30 yrs out
- Wind 4/10 Moderate 13% chance of damaging wind over 30 yrs
- Air quality 2/10 Low 1 unhealthy d/yr today · 3 by 30 yrs out
Nearby sold comps map
Loading sold comps map…
Walkable amenities ~0.75 mi
Loading nearby amenities…
Taxation est. · year 1
- Rental income
- $34,320
- − Mortgage interest
- −$6,492
- − Property taxes
- −$1,738
- − Insurance
- −$580
- − Repairs & maintenance
- −$2,746
- − Management
- −$2,746
- − Depreciation
- −$3,372
- Taxable income
- $16,647
- Est. tax owed @ 24.0%
- −$3,995
- After-tax cash flow
- $13,506/yr
For passive investors: Depreciation is non-cash, so a rental often shows a tax loss while cash-flowing — sheltering income. Rental losses are passive: they offset passive income freely, and up to $25,000/yr can offset ordinary (W-2) income if you actively participate and your MAGI is under $100k (phasing out to $0 by $150k); unused losses carry forward. On sale, claimed depreciation is recaptured at up to 25%, and gains may owe capital-gains tax (a 1031 exchange can defer both). Figures are a year-1 estimate at your 24.0% rate — not tax advice; consult a CPA.
Condition & rehab AI · 1 photo
The home requires extensive repairs and updates, including a new roof, siding, windows, HVAC system, and landscaping, to become move-in ready and significantly increase its value.
Repairs flagged
- Major roof — No visible roof in the provided images.
- Major exterior siding — No visible exterior siding in the provided images.
- Major windows — No visible windows in the provided images.
- Major HVAC/mechanical — No visible HVAC/mechanical in the provided images.
- Major landscaping — No visible landscaping in the provided images.
Value-add opportunities
- Both roof replacement — A new roof would significantly improve the home's appearance and value.
- Both exterior siding repair — Repairing or replacing the siding would enhance the home's curb appeal and value.
- Both window replacement — New windows would improve energy efficiency and the home's overall appearance.
- Both HVAC system upgrade — Upgrading the HVAC system would improve comfort and energy efficiency, enhancing both resale and rental value.
- Both landscaping and curb appeal — A well-maintained and aesthetically pleasing landscape would significantly boost the home's curb appeal and value.
Renovation cost estimate screening
| Repair item | Severity | Est. cost |
|---|---|---|
| roof · No visible roof in the provided images. | Major | $15,000–50,000 |
| exterior siding · No visible exterior siding in the provided images. | Major | $15,000–50,000 |
| windows · No visible windows in the provided images. | Major | $15,000–50,000 |
| HVAC/mechanical · No visible HVAC/mechanical in the provided images. | Major | $15,000–50,000 |
| landscaping · No visible landscaping in the provided images. | Major | $15,000–50,000 |
| Total estimated repair cost · 5 items | $75,000–250,000 |
Value-add ROI direction
- Both roof replacement — A new roof would significantly improve the home's appearance and value. ↑
- Both exterior siding repair — Repairing or replacing the siding would enhance the home's curb appeal and value. ↑
- Both window replacement — New windows would improve energy efficiency and the home's overall appearance. ↑
- Both HVAC system upgrade — Upgrading the HVAC system would improve comfort and energy efficiency, enhancing both resale and rental value. ↑
- Both landscaping and curb appeal — A well-maintained and aesthetically pleasing landscape would significantly boost the home's curb appeal and value. ↑
ⓘ Cost ranges are severity-bucket heuristics (US national rule-of-thumb). Get contractor quotes + a written scope before underwriting a rehab budget.
Schools (NCES district)
- District
- Parkland SD
- NCES district ID
- 4218510
- Math proficiency
- 59% ▼ -11.00%
- Reading proficiency
- 70% ▼ -12.00%
- Median HH income
- $77,976
- Composite
- 57.44/100
- National rank
- #1074
- State rank
- #40 of 539 in PA
Livability — North Whitehall
No livability data for this city. (Only ~50 U.S. cities are tracked.)
Census & demographics
- Population (ZIP)
- 8,804
Population outlook (Lehigh County) Hauer SSP2
- Today (2025)
- 392,957 people
- By 2030
- 408,319 · +3.9%
- By 2040
- 440,007 · +12.0%
- By 2050
- 475,940 · +21.1%
- By 2075
- 590,448 · +50.3%
- By 2100
- 690,314 · +75.7%
Race, ethnicity, and origin ACS 2023
- Neighborhood character
- Predominantly White (77%)
- Race & ethnicity
- White 77% Hispanic / Latino 9% Two or more races 8% Asian 8% Black 2%
- Hispanic origin (detail)
- Mexican 2% Puerto Rican 5%
- Common ancestry
- Scotch-Irish 6% Romanian 3% Lithuanian 3%
- Foreign-born
- 10% · Canada, South Korea, China
- Languages at home
- 87% English-only · Spanish 5% Other Indo-European 2% Chinese 2%
Political lean MEDSL · Lehigh
- 2024 margin
- Toss-up / Even · D 50.7% · R 48.0% · Other 1.2%
- 2008→2024 swing
- -12.9pp toward R · 2008: 15.6pp · 2024: 2.7pp
- All cycles
- 2024: D+2.7 2020: D+7.6 2016: D+4.4 2012: D+7.5 2008: D+15.6
Not yet ingested
- Civics
- —
Market trends
- HPI YoY
- ▲ 0.88%
- Current HPI
- 277.9781
- Rent YoY
- —
- Metro
- —
- State GDP YoY
- ▲ 1.68%
- F500 in state
- 34
Industry mix (Fortune 500 HQ in PA)
| Industry | F500 HQs | Revenue |
|---|---|---|
| Healthcare | 2 | $309B |
|
||
| Insurance | 2 | $27B |
|
||
| Telecommunications / Media | 1 | $124B |
|
||
| Industrial Distribution | 1 | $22B |
|
||
| Financial Services | 1 | $20B |
|
||
| Chemicals / Materials | 1 | $18B |
|
||
Price history
1 event — show timeline
- 2026-06-04 Listed $115,900 FSBO.com
Cash-flow waterfall
monthlySold comps — $/sqft
last 12 mo · ≤1 miLoading sold comps…