 Duplex
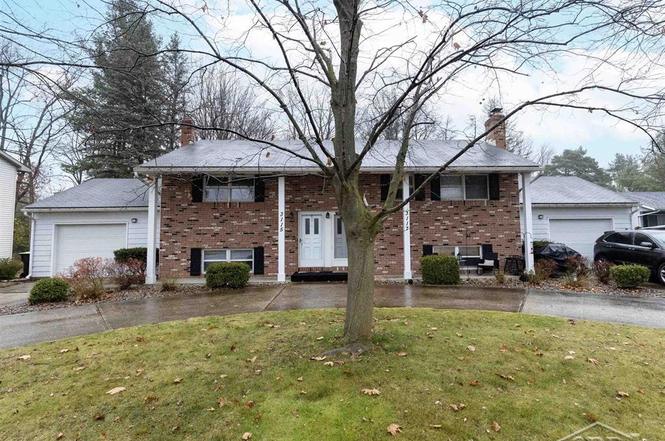
3115-3117 Beech St · Midland, MI
Flood risk 1/10 · Minimal
- FEMA flood zone
- X (unshaded)
- Chance of flooding over 30 yrs
- 0.0%
- Est. flood insurance / yr
- $507 – $1,088
Fire risk 1/10 · Minimal
- Est. fire insurance / yr
- $784 – $1,456
Heat risk 2/10 · Minimal
- Hot days now (above 98°F)
- 7 days/yr
- Hot days in 30 yrs
- 14 days/yr
Wind risk 1/10 · Minimal
- Chance of severe wind over 30 yrs
- —
Air-quality risk 2/10 · Minimal
- Unhealthy air days now
- 1 days/yr
- Unhealthy air days in 30 yrs
- 1 days/yr
Risk factors via First Street. Map © Google.
Why this score? — see what drove the C+ grade
The composite is a weighted blend of 9 inputs, each scored 0–100. Each bar is that input's sub-score; the figure is the points it added to the 100-point composite (weight × sub-score).
- Cash flow +21.0/30.0
- ARV discount +15.0/15.0
- DSCR +6.7/10.0
- 1% rule +5.7/10.0
- Schools +4.9/10.0
- Livability +4.2/5.0
- Rent growth +2.7/5.0
- Condition / age +2.5/5.0
- Appreciation +0.0/10.0
$259,900
🖨 Deal sheet 📄 Offer letter ✓ Due diligence
Multi-family units
County records classify this as Multi-Family (2-4 Unit). Listing-text estimate: 2 units. confirmed
Listing remarks MLS
BETTER HURRY ON BEECH! Located directly across from a school playground with splash park, this duplex will be a big hit and easy to rent. 2 bedrooms, 1 full bathroom and 1 half bathroom per side. 1.5 car attached garage on each side. Nice private backyard. This duplex has always been a solid performer. Call today for your private showing!
Key facts
- Private backyard
- Splash park
- 0.29 acre lot
Tags
Property features AI
Finance
- Other: Lot dimensions approximately 96 x 132 (0.29 acre); Zoned residential
- Financial info: Unit rents reported: one unit at $950, another at $1,050
- HOA & community: Details not provided
Exterior
- Parking: Attached garage; Approximately 1.5 garage spaces
- Security: Details not provided
- Utilities: Public water; Public sewer
- Home design: Residential income property (multi-family); Two-story; Entry level not specified; Facing direction not specified
- Construction: Aluminum siding and brick exterior; Built on a slab foundation; Two-unit building; Above-grade finished area approximately 2,246
- Exterior features: Sprinkler system
Interior
- Kitchen: Dishwasher; Disposal; Oven; Range; Refrigerator
- Bedrooms: Details not provided
- Flooring: Details not provided
- Bathrooms: 2 full bathrooms; 2 half bathrooms
- Heating & cooling: Forced air heating; Separate meters for heating; Central air conditioning
- Interior features: Eat-in kitchen; Living room fireplace
- Laundry & utility: Gas water heater
Neighborhood map
What this means for you Summary
Snapshot
- This is a 2 × 2-bed/1.5-bath units multifamily listed at $260k.
Deal economics
- At list price, monthly cash flow is $368 ($4k/yr) — positive. Per door: $184/mo.
- The deal already cash-flows at list — no discount required.
- Meets the 1% rule at list price ($3k rent vs $260k).
- Cap rate 8.0% vs local median 4.4% in Midland — top-decile yield for the area; either an underpriced asset or a hidden risk that comps aren't pricing in. Stress-test before assuming the spread holds.
Location & tenants
- Location reads 85/100 on livability (#28 in MI, #578 nationally) — a professional / high-income tenant draw. Strengths: crime A+, cost of living A+, housing A+; Watch: commute F.
- Midland Public Schools (urban): math 49% / reading 64% proficiency, ranked #62 of 540 in MI (top 12%) — acceptable for families but not a draw, mixed tenant base, ~2y average lease.
- Market conditions: Rents flat; 95 active listings in the ZIP; solid renter incomes; 320 units permitted in Midland County in 2024 (204 in 5+ unit buildings).
- This rent runs 43% of the median local income ($78k/yr) — at the standard rent-burdened threshold; future hikes will face affordability resistance.
Forward outlook
- Local home prices are declining (-3.0%/yr); year-one equity from $2k of loan paydown is wiped out by about $8k of value loss. Plan a longer hold.
- Midland County population projected to shrink 9% by 2050 — rents likely to lag national; underwrite the cash flow, not the appreciation.
Negotiation context
- Only 3 days on market — expect competitive offers; lowballing is unlikely to land.
- 4 sale attempts since 2y ago with the ask held roughly flat each time — persistent listings suggest the price (not the market) is what's stuck; bring a comps-based counter.
- Current owner paid $131k; list at $260k implies a 98% gain — meaningful room to come down on a strong offer.
Questions for the listing agent
- Can we see the unit-by-unit rent roll, current vacancy, and any below-market leases? What's the average tenancy length?
- What capital expenditures (roof, boiler, parking lot, exteriors) have been made in the last 5 years, and what's planned in the next 2?
- Built in 1974 — when were the roof, HVAC, electrical panel, plumbing, and water heater last replaced?
- Is there a deadline driving the sale (1031 exchange, divorce, estate, relocation)? That informs how much negotiation room exists.
- Schools are A-rated — typically a magnet for longer-tenancy family renters. What's the average tenant stay here, and is there a school-zone premium baked into asking?
- What's the average days-on-market for RENTAL listings here right now (not sales)? A rising rental-DOM trend means longer vacancies and softer asking-rent achievability than the comps imply.
- What's the recent tenant-quality profile in this submarket — average credit score on applications, eviction rate, late-payment / NSF rate, and stable-employment percentage? A property-management company in the area should have these aggregated.
- How much new apartment / multifamily construction is in the pipeline within 1–3 miles? Heavy new supply (>2% of stock underway) typically softens rents 12–24 months out; light construction supports rent growth.
Investment metrics
- 1% rule
- 1.07% ✓
- Cap rate
- 7.99%
- Cash-on-cash
- 6.07%
- DSCR
- 1.27
- GRM
- 7.8
CMA / ARV
- ARV (on-the-fly)
- $359,360
- Comps found
- 1
Show comp detail 1 sale within ~0.75 mi
| Address | Dist | Beds/Ba | Sqft | Sold | Price | $/sf | Match |
|---|---|---|---|---|---|---|---|
| 428/430 Hemlock St | 0.30mi | 6/4.0 | 2,015 (-10%) | 2mo | $321,700 | $160 | 57 |
Match score weights: distance 35% · size 25% · config 20% · recency 20%. Top-matched comps best support the ARV.
Projected returns pro-forma
-3.0% appreciation · 0.6% rent growth · sell at horizon
- IRR
- -9.7%
- Equity multiple
- 0.65×
- Total profit
- $-25,166
- Equity at exit
- $38,752
- IRR
- -4.0%
- Equity multiple
- 0.76×
- Total profit
- $-17,102
- Equity at exit
- $22,471
Cash invested: $72,772 (down + closing). Projections, not guarantees.
Landlord ↔ Tenant lean methodology
- Overall (STATE)
- 62 Landlord-Friendly
- State Michigan
- 62 Landlord-Friendly · EVEN
- County
- — inherits STATE
- City
- — inherits STATE
ZIP-level market 48642
- Home prices YoY
- -31.4%
- Rents YoY
- 0.6%
- Active inventory
- 95
- Price-to-rent
- 15.6×
Monthly cashflow live
- Estimated rent
- $2,777 medium interval (Pro) →
- Mortgage (P&I)
- −$1,363
- Tax from tax record
- −$355 /mo · $4,255/yr
- Insurance
- −$108
- HOA
- −$0
- Vacancy / Maint / Mgmt
- −$583
- Net cashflow
- $368
Break-even live
2-unit breakdown (identical units grouped — click to expand)
| Units | Beds | Baths | Est. rent |
|---|---|---|---|
| 2× units | 2 | 1.5 | $2,776 |
| #1 | 2 | 1.5 | $1,388 |
| #2 | 2 | 1.5 | $1,388 |
| Total (2 units) | $2,777 | ||
UW: 25.0% down · 7.5% · 30yr · 1.5% tax · 5.0% vac · 8.0% maint · 8.0% mgmt
Financing live
Cash to close
- Down payment
- $64,975
- Closing costs
- $7,797
- Reserves months
- —
- Total cash needed
- —
Loan-product check · same deal, 3 products live
Conventional
25% down · 7.5% · 30yr
- Down + closing
- —
- Monthly P&I
- —
- Monthly cashflow
- —
- DSCR
- —
- Eligible?
- —
Personal DTI + credit; lowest rate.
DSCR
20% down · 8.5% · 30yr
- Down + closing
- —
- Monthly P&I
- —
- Monthly cashflow
- —
- DSCR
- —
- Eligible?
- —
No personal income docs; deal must DSCR.
Hard money
10% down · 12.0% · 12mo
- Down + closing
- —
- Monthly P&I
- —
- Monthly cashflow
- —
- DSCR
- —
- Eligible?
- —
Short-term bridge; refi at stabilization.
Listing history 4 events
-
2026-06-19days on market $259,900 Active 3 DOM
-
2026-06-18days on market $259,900 Active 2 DOM
-
2026-06-17remarks 340-char remark
-
2026-06-17$259,900 Active 1 DOM
ⓘ Source: listings_history table (triggers on properties + properties_extension) + one-shot
backfill from property_details.listing_events for pre-trigger history.
Tax reassessment forecast MI · Partial reset (capped growth)
- Current annual tax
- $4,255 · $355/mo
- Projected year-2 tax
- $4,255 · $355/mo
- Expected delta
- $0/yr ($0/mo · 0.0%)
ⓘ Screening estimate from a state-policy table — verify with the county assessor before closing.
Climate risk First Street
- Flood 1/10 Low FEMA zone X (unshaded) · 0% chance over 30 yrs
- Wildfire 1/10 Low
- Heat 2/10 Low 7 d/yr ≥98°F today · 14 d/yr by 30 yrs out
- Wind 1/10 Low
- Air quality 2/10 Low 1 unhealthy d/yr today · 1 by 30 yrs out
Nearby sold comps map
Loading sold comps map…
Walkable amenities ~0.75 mi
Loading nearby amenities…
Taxation est. · year 1
- Rental income
- $33,324
- − Mortgage interest
- −$14,558
- − Property taxes
- −$4,255
- − Insurance
- −$1,300
- − Repairs & maintenance
- −$2,666
- − Management
- −$2,666
- − Depreciation
- −$7,561
- Taxable income
- $318
- Est. tax owed @ 24.0%
- −$76
- After-tax cash flow
- $4,340/yr
For passive investors: Depreciation is non-cash, so a rental often shows a tax loss while cash-flowing — sheltering income. Rental losses are passive: they offset passive income freely, and up to $25,000/yr can offset ordinary (W-2) income if you actively participate and your MAGI is under $100k (phasing out to $0 by $150k); unused losses carry forward. On sale, claimed depreciation is recaptured at up to 25%, and gains may owe capital-gains tax (a 1031 exchange can defer both). Figures are a year-1 estimate at your 24.0% rate — not tax advice; consult a CPA.
Schools (NCES district)
- District
- Midland Public Schools
- NCES district ID
- 2623820
- Math proficiency
- 49% ▼ -6.00%
- Reading proficiency
- 64% ▼ -3.00%
- Median HH income
- $55,844
- Composite
- 48.67/100
- National rank
- #2105
- State rank
- #62 of 540 in MI
Livability — Midland
- Score
- 85/100
- State rank
- #28
- US rank
- #578
Category grades
Schools grade is shown separately in the Schools card above.
Census & demographics
- Census place
- Midland, MI
- County
- Midland County · 66,531 people
- City population
- 66,531
- Metro
- Midland, MI
- Population (ZIP)
- 34,039
- Household income
- $77,847
- Rent vs Own
- Severe rent burden
- 935.0
Population outlook (Midland County) Hauer SSP2
- Today (2025)
- 83,968 people
- By 2030
- 83,368 · -0.7%
- By 2040
- 80,713 · -3.9%
- By 2050
- 76,698 · -8.7%
- By 2075
- 67,617 · -19.5%
- By 2100
- 57,529 · -31.5%
Race, ethnicity, and origin ACS 2023
- Neighborhood character
- Predominantly White (88%)
- Race & ethnicity
- White 88% Hispanic / Latino 4% Asian 4% Two or more races 3% Black 2%
- Common ancestry
- Romanian 8% Lithuanian 5% Italian 3%
- Foreign-born
- 5% · Canada, China, Vietnam
- Languages at home
- 95% English-only · Other Indo-European 1% Spanish 1% Chinese 1%
Political lean MEDSL · Midland
- 2024 margin
- R (+15.2) · D 41.6% · R 56.8% · Other 1.6%
- 2008→2024 swing
- -11.6pp toward R · 2008: -3.6pp · 2024: -15.2pp
- All cycles
- 2024: R+15.2 2020: R+14.6 2016: R+19.4 2012: R+15.5 2008: R+3.6
Not yet ingested
- Civics
- —
Market trends
- HPI YoY
- ▼ -87.89%
- Current HPI
- 192.0812
- Rent YoY
- ▲ 0.60%
- Metro
- Midland, MI
- State GDP YoY
- ▲ 1.37%
- F500 in state
- 28
Industry mix (Fortune 500 HQ in MI)
| Industry | F500 HQs | Revenue |
|---|---|---|
| Automotive Parts | 3 | $48B |
|
||
| Automotive | 2 | $372B |
|
||
| Chemicals | 1 | $45B |
|
||
| Automotive Retail | 1 | $29B |
|
||
| Healthcare / Medical Devices | 1 | $23B |
|
||
| Automotive Technology | 1 | $20B |
|
||
Price history
+98.4% since first listed8 events — show timeline
- 2026-06-16 Listed $259,900 REALCOMP
- 2026-06-16 Listed $259,900 MiRealSource-MiMLS
- 2025-01-06 Listing Removed — REALCOMP
- 2025-01-06 Listing Removed — MiRealSource-MiMLS
- 2024-12-18 Price Changed $259,900 MiRealSource-MiMLS
- 2024-12-03 Listed $259,900 REALCOMP
- 2024-12-03 Listed $269,900 MiRealSource-MiMLS
- 2006-06-20 Sold (Public Records) $131,000 Public Records
Property tax history
+1.9%/yrLatest (2024): $4,255 · +5.1% YoY. Source: county tax records.
Cash-flow waterfall
monthlySold comps — $/sqft
last 12 mo · ≤1 miLoading sold comps…