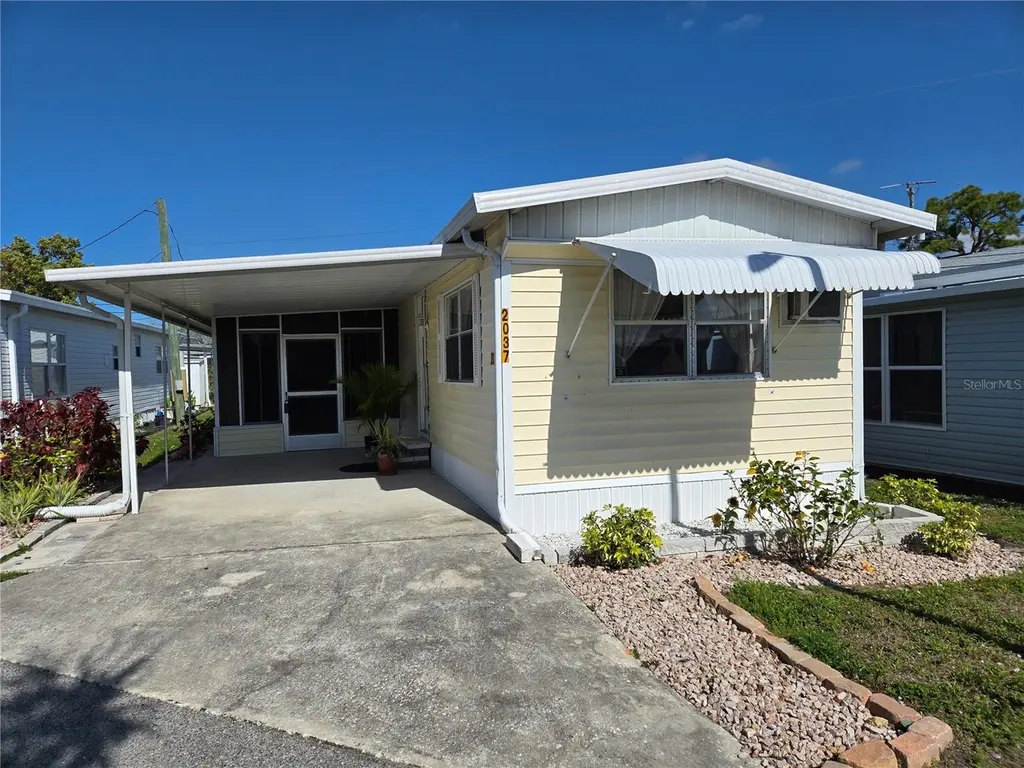
2037 Champion St · Gulf Gate, FL
Flood risk 1/10 · Minimal
- FEMA flood zone
- X (unshaded)
- Chance of flooding over 30 yrs
- 0.0%
- Est. flood insurance / yr
- $507 – $1,088
Fire risk 1/10 · Minimal
- Est. fire insurance / yr
- $947 – $1,759
Heat risk 10/10 · Severe
- Hot days now (above 107°F)
- 7 days/yr
- Hot days in 30 yrs
- 30 days/yr
Wind risk 10/10 · Severe
- Chance of severe wind over 30 yrs
- 99.0%
Air-quality risk 2/10 · Minimal
- Unhealthy air days now
- 1 days/yr
- Unhealthy air days in 30 yrs
- 1 days/yr
Risk factors via First Street. Map © Google.
Why this score? — see what drove the B- grade
The composite is a weighted blend of 9 inputs, each scored 0–100. Each bar is that input's sub-score; the figure is the points it added to the 100-point composite (weight × sub-score).
- Cash flow +30.0/30.0
- 1% rule +10.0/10.0
- DSCR +10.0/10.0
- ARV discount +7.5/15.0
- Schools +5.4/10.0
- Livability +2.5/5.0
- Condition / age +2.5/5.0
- Rent growth +2.0/5.0
- Appreciation +0.0/10.0
$99,000
🖨 Deal sheet 📄 Offer letter ✓ Due diligence
Listing remarks MLS
Location, Location, Location discover your own oasis at Mobile Estates a great place to call home low maintenance fees that include lawn maintenance, swimming pool, shuffleboard and a lending Library close to Restaurants and Siesta Key. Open plan lovely screen porch 10 x 20 to entertain your guest.
Key facts
- 2,213 sq ft lot
- Parking
- Pool
Neighborhood map
What this means for you Summary
Snapshot
- This is a 1-bed/1.0-bath manufactured listed at $99k.
Deal economics
- At list price, monthly cash flow is $406 ($5k/yr) — positive.
- The deal already cash-flows at list — no discount required.
- Meets the 1% rule at list price ($2k rent vs $99k).
- Recommended offer: $87k (12.0% below list) — sets the bar for market timing.
Location & tenants
- Location reads: area grade B — affects rentability + tenant quality, not the cash-flow math above.
- Sarasota (urban): math 63% / reading 63% proficiency, ranked #7 of 73 in FL (top 10%) — acceptable for families but not a draw, mixed tenant base, ~2y average lease.
- Market conditions: Rents soft (-2.1%/yr); 562 active listings in the ZIP; 7,466 units permitted in Sarasota County in 2024 (2,138 in 5+ unit buildings).
Forward outlook
- Local home prices are declining (-3.0%/yr); year-one equity from $684 of loan paydown is wiped out by about $3k of value loss. Plan a longer hold.
- Sarasota County population projected at +20% by 2050 — long-run rental-demand tailwind backs the buy-and-hold thesis.
Negotiation context
- It's been on market 197 days — a 12% lower offer ($87k) is reasonable based on typical stale-listing flexibility.
- 8 sale attempts since 9y ago; this cycle's ask has dropped $15k (13%) from the opening price — seller is motivated, your offer sets the floor, not the list.
Risks & watch-outs
- Climate carrying-cost: severe wind risk, 99% chance of damaging wind over 30y; extreme-heat days projected 7→30/yr by 2055 (HVAC capex compounding) — expect insurance premiums to compound above CPI over the hold.
Questions for the listing agent
- It's been on market 197 days. Have you received any prior offers? Is the seller open to a 12% concession, seller financing, or rate buy-down credit?
- Built in 1970 — when were the roof, HVAC, electrical panel, plumbing, and water heater last replaced?
- What does the HOA fee cover, when was the last increase, and are there any pending special assessments or reserve-fund shortfalls?
- Why hasn't it sold? Are there any deal-killer items the seller is aware of (foundation, flood, title, zoning, code violations)?
- Is there a deadline driving the sale (1031 exchange, divorce, estate, relocation)? That informs how much negotiation room exists.
- What's the average days-on-market for RENTAL listings here right now (not sales)? A rising rental-DOM trend means longer vacancies and softer asking-rent achievability than the comps imply.
- What's the recent tenant-quality profile in this submarket — average credit score on applications, eviction rate, late-payment / NSF rate, and stable-employment percentage? A property-management company in the area should have these aggregated.
- How much new for-sale + rental construction is in the pipeline within 1–3 miles? Heavy new supply typically softens prices + rents 12–24 months out; constrained supply supports both.
Investment metrics
- 1% rule
- 1.66% ✓
- Cap rate
- 11.22%
- Cash-on-cash
- 17.58%
- DSCR
- 1.78
- GRM
- 5.0
CMA / ARV
No comps found within radius.
Projected returns pro-forma
-3.0% appreciation · 0.0% rent growth · sell at horizon
- IRR
- 5.0%
- Equity multiple
- 1.19×
- Total profit
- $5,154
- Equity at exit
- $14,761
- IRR
- 10.9%
- Equity multiple
- 1.71×
- Total profit
- $19,782
- Equity at exit
- $8,560
Cash invested: $27,720 (down + closing). Projections, not guarantees.
Landlord ↔ Tenant lean methodology
- Overall (STATE)
- 87 Strongly Landlord-Friendly
- State Florida
- 87 Strongly Landlord-Friendly · R+3
- County
- — inherits STATE
- City
- — inherits STATE
ZIP-level market 34231
- Rents YoY
- -2.1%
- Active inventory
- 562
- Price-to-rent
- 5.0×
Monthly cashflow live
- Estimated rent
- $1,645 medium interval (Pro) →
- Mortgage (P&I)
- −$519
- Tax from tax record
- −$118 /mo · $1,420/yr
- Insurance
- −$41
- HOA
- −$215
- Vacancy / Maint / Mgmt
- −$346
- Net cashflow
- $406
Break-even live
UW: 25.0% down · 7.5% · 30yr · 1.5% tax · 5.0% vac · 8.0% maint · 8.0% mgmt
Financing live
Cash to close
- Down payment
- $24,750
- Closing costs
- $2,970
- Reserves months
- —
- Total cash needed
- —
Loan-product check · same deal, 3 products live
Conventional
25% down · 7.5% · 30yr
- Down + closing
- —
- Monthly P&I
- —
- Monthly cashflow
- —
- DSCR
- —
- Eligible?
- —
Personal DTI + credit; lowest rate.
DSCR
20% down · 8.5% · 30yr
- Down + closing
- —
- Monthly P&I
- —
- Monthly cashflow
- —
- DSCR
- —
- Eligible?
- —
No personal income docs; deal must DSCR.
Hard money
10% down · 12.0% · 12mo
- Down + closing
- —
- Monthly P&I
- —
- Monthly cashflow
- —
- DSCR
- —
- Eligible?
- —
Short-term bridge; refi at stabilization.
HOA detail
- Monthly dues
- $215 · $2,580/yr
- Likely covers
- pool
Listing history 38 events
-
2026-06-18days on market $99,000 Active 197 DOM
-
2026-06-17days on market $99,000 Active 196 DOM
-
2026-06-16days on market $99,000 Active 195 DOM
-
2026-06-15days on market $99,000 Active 194 DOM
-
2026-06-13days on market $99,000 Active 192 DOM
-
2026-06-13days on market $99,000 Active 191 DOM
-
2026-06-10days on market $99,000 Active 189 DOM
-
2026-06-09days on market $99,000 Active 188 DOM
-
2026-06-08days on market $99,000 Active 186 DOM
-
2026-06-05days on market $99,000 Active 183 DOM
-
2026-06-03days on market $99,000 Active 182 DOM
-
2026-06-02days on market $99,000 Active 181 DOM
-
2026-06-01days on market $99,000 Active 180 DOM
-
2026-05-31days on market $99,000 Active 179 DOM
-
2026-03-31price $99,000 299-char remark
Show marketing remark (299 chars)
Location, Location, Location discover your own oasis at Mobile Estates a great place to call home low maintenance fees that include lawn maintenance, swimming pool, shuffleboard and a lending Library close to Restaurants and Siesta Key. Open plan lovely screen porch 10 x 20 to entertain your guest.
-
2026-02-27price $110,000 299-char remark
Show marketing remark (299 chars)
Location, Location, Location discover your own oasis at Mobile Estates a great place to call home low maintenance fees that include lawn maintenance, swimming pool, shuffleboard and a lending Library close to Restaurants and Siesta Key. Open plan lovely screen porch 10 x 20 to entertain your guest.
-
2025-12-03$113,900 Active 299-char remark
Show marketing remark (299 chars)
Location, Location, Location discover your own oasis at Mobile Estates a great place to call home low maintenance fees that include lawn maintenance, swimming pool, shuffleboard and a lending Library close to Restaurants and Siesta Key. Open plan lovely screen porch 10 x 20 to entertain your guest.
-
2025-05-13historical
-
2024-11-12$132,900 Active
-
2022-01-03soldstatus $90,000
-
2021-12-31soldstatus $90,000 Closed
-
2021-12-12status Pending
-
2021-12-03status Active
-
2021-11-26status Pending
-
2021-10-26$95,000 Active
-
2018-08-30soldstatus $58,000
-
2018-08-27soldstatus $58,000 Sold
-
2018-07-27status Pending
-
2018-07-17price $62,900
-
2018-04-25historical
-
2018-04-25status Active
-
2018-04-22historical
-
2018-04-22$64,900 Active
-
2018-02-28price $64,900
-
2018-02-01status Active
-
2018-01-31historical
-
2017-06-15$69,000 Active
-
2000-06-01soldstatus $18,500
ⓘ Source: listings_history table (triggers on properties + properties_extension) + one-shot
backfill from property_details.listing_events for pre-trigger history.
Tax reassessment forecast FL · Resets to sale price
- Current annual tax
- $1,420 · $118/mo
- Projected year-2 tax
- $1,420 · $118/mo
- Expected delta
- $0/yr ($0/mo · 0.0%)
ⓘ Screening estimate from a state-policy table — verify with the county assessor before closing.
Climate risk First Street
- Flood 1/10 Low FEMA zone X (unshaded) · 0% chance over 30 yrs
- Wildfire 1/10 Low
- Heat 10/10 Extreme 7 d/yr ≥107°F today · 30 d/yr by 30 yrs out
- Wind 10/10 Extreme 99% chance of damaging wind over 30 yrs
- Air quality 2/10 Low 1 unhealthy d/yr today · 1 by 30 yrs out
Nearby sold comps map
Loading sold comps map…
Walkable amenities ~0.75 mi
Loading nearby amenities…
Taxation est. · year 1
- Rental income
- $19,744
- − Mortgage interest
- −$5,546
- − Property taxes
- −$1,420
- − Insurance
- −$495
- − Repairs & maintenance
- −$1,580
- − Management
- −$1,580
- − HOA
- −$2,580
- − Depreciation
- −$2,880
- Taxable income
- $3,665
- Est. tax owed @ 24.0%
- −$880
- After-tax cash flow
- $3,994/yr
For passive investors: Depreciation is non-cash, so a rental often shows a tax loss while cash-flowing — sheltering income. Rental losses are passive: they offset passive income freely, and up to $25,000/yr can offset ordinary (W-2) income if you actively participate and your MAGI is under $100k (phasing out to $0 by $150k); unused losses carry forward. On sale, claimed depreciation is recaptured at up to 25%, and gains may owe capital-gains tax (a 1031 exchange can defer both). Figures are a year-1 estimate at your 24.0% rate — not tax advice; consult a CPA.
Schools (NCES district)
- District
- Sarasota
- NCES district ID
- 1201680
- Math proficiency
- 63% ▼ -8.00%
- Reading proficiency
- 63% ▼ -3.00%
- Median HH income
- $51,167
- Composite
- 53.68/100
- National rank
- #1428
- State rank
- #7 of 73 in FL
Livability — Gulf Gate
No livability data for this city. (Only ~50 U.S. cities are tracked.)
Census & demographics
- Census place
- Gulf Gate, FL
- County
- Sarasota County · 448,376 people
- City population
- 32,203
- Metro
- North Port-Sarasota-Bradenton, FL
- Population (ZIP)
- 32,404
- Household income
- $69,925
- Rent vs Own
- Severe rent burden
- 1983.0
Population outlook (Sarasota County) Hauer SSP2
- Today (2025)
- 452,380 people
- By 2030
- 474,175 · +4.8%
- By 2040
- 511,577 · +13.1%
- By 2050
- 541,467 · +19.7%
- By 2075
- 604,947 · +33.7%
- By 2100
- 621,965 · +37.5%
Race, ethnicity, and origin ACS 2023
- Neighborhood character
- Predominantly White (86%)
- Race & ethnicity
- White 86% Hispanic / Latino 10% Two or more races 7% Black 2%
- Hispanic origin (detail)
- Mexican 2%
- Common ancestry
- Romanian 4% Slovak 3% Lithuanian 3%
- Foreign-born
- 11% · Canada, Jamaica, China
- Languages at home
- 88% English-only · Spanish 6% Russian/Polish/Slavic 2% German/W. Germanic 1%
Political lean MEDSL · Sarasota
- 2024 margin
- R (+18.2) · D 40.5% · R 58.7%
- 2008→2024 swing
- -18.1pp toward R · 2008: -0.1pp · 2024: -18.2pp
- All cycles
- 2024: R+18.2 2020: R+10.4 2016: R+11.6 2012: R+7.4 2008: R+0.1
Not yet ingested
- Civics
- —
Market trends
- HPI YoY
- ▼ -448.92%
- Current HPI
- 292.9055
- Rent YoY
- ▼ -2.13%
- Metro
- North Port-Sarasota-Bradenton, FL
- State GDP YoY
- ▲ 3.28%
- F500 in state
- 36
Industry mix (Fortune 500 HQ in FL)
| Industry | F500 HQs | Revenue |
|---|---|---|
| Industrial Technology | 2 | $29B |
|
||
| Insurance | 2 | $17B |
|
||
| Retail | 1 | $60B |
|
||
| Technology Distribution | 1 | $58B |
|
||
| Homebuilding | 1 | $35B |
|
||
| Technology Manufacturing | 1 | $35B |
|
||
Price history
+435.1% since first listed24 events — show timeline
- 2026-03-31 Price Changed $99,000 Stellar MLS as Distributed by MLS Grid
- 2026-02-27 Price Changed $110,000 Stellar MLS as Distributed by MLS Grid
- 2025-12-03 Listed $113,900 Stellar MLS as Distributed by MLS Grid
- 2025-05-13 Listing Removed — Stellar MLS as Distributed by MLS Grid
- 2024-11-12 Listed $132,900 Stellar MLS as Distributed by MLS Grid
- 2022-01-03 Sold (Public Records) $90,000 Public Records
- 2021-12-31 Sold (MLS) $90,000 Stellar MLS as Distributed by MLS Grid
- 2021-12-12 Pending — Stellar MLS as Distributed by MLS Grid
- 2021-12-03 Relisted — Stellar MLS as Distributed by MLS Grid
- 2021-11-26 Pending — Stellar MLS as Distributed by MLS Grid
- 2021-10-26 Listed $95,000 Stellar MLS as Distributed by MLS Grid
- 2018-08-30 Sold (Public Records) $58,000 Public Records
- 2018-08-27 Sold (MLS) $58,000 Stellar MLS as Distributed by MLS Grid
- 2018-07-27 Pending — Stellar MLS as Distributed by MLS Grid
- 2018-07-17 Price Changed $62,900 Stellar MLS as Distributed by MLS Grid
- 2018-04-25 Listing Removed — Stellar MLS as Distributed by MLS Grid
- 2018-04-25 Relisted — Stellar MLS as Distributed by MLS Grid
- 2018-04-22 Listing Removed — Stellar MLS as Distributed by MLS Grid
- 2018-04-22 Listed $64,900 Stellar MLS as Distributed by MLS Grid
- 2018-02-28 Price Changed $64,900 Stellar MLS as Distributed by MLS Grid
- 2018-02-01 Relisted — Stellar MLS as Distributed by MLS Grid
- 2018-01-31 Listing Removed — Stellar MLS as Distributed by MLS Grid
- 2017-06-15 Listed $69,000 Stellar MLS as Distributed by MLS Grid
- 2000-06-01 Sold (Public Records) $18,500 Public Records
Property tax history
+6.3%/yrLatest (2025): $1,420 · +5.9% YoY. Source: county tax records.
Cash-flow waterfall
monthlySold comps — $/sqft
last 12 mo · ≤1 miLoading sold comps…