1258 Glendale Cir · Greenwood, MS
Flood risk 5/10 · Moderate
- FEMA flood zone
- X
- Chance of flooding over 30 yrs
- 0.24%
- Est. flood insurance / yr
- $507 – $1,088
Fire risk 1/10 · Minimal
- Est. fire insurance / yr
- $1,241 – $2,305
Heat risk 7/10 · Major
- Hot days now (above 110°F)
- 7 days/yr
- Hot days in 30 yrs
- 21 days/yr
Wind risk 6/10 · Moderate
- Chance of severe wind over 30 yrs
- 27.0%
Air-quality risk 1/10 · Minimal
- Unhealthy air days now
- 0 days/yr
- Unhealthy air days in 30 yrs
- 0 days/yr
Risk factors via First Street. Map © Google.
Why this score? — see what drove the B grade
The composite is a weighted blend of 9 inputs, each scored 0–100. Each bar is that input's sub-score; the figure is the points it added to the 100-point composite (weight × sub-score).
- Cash flow +30.0/30.0
- 1% rule +10.0/10.0
- DSCR +10.0/10.0
- ARV discount +7.5/15.0
- Schools +5.0/10.0
- Livability +3.6/5.0
- Rent growth +2.5/5.0
- Condition / age +2.5/5.0
- Appreciation +0.0/10.0
$57,000
🖨 Deal sheet 📄 Offer letter ✓ Due diligence
Listing remarks
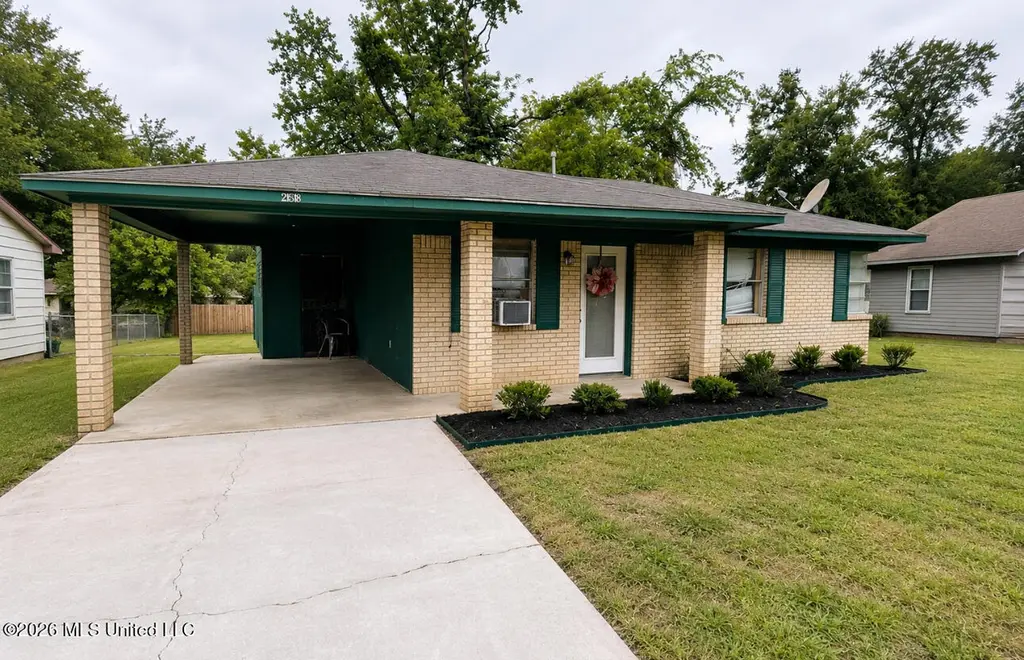
Charming 3-Bedroom Home with Unique Character and Great Potential: This 3-bedroom, 1 bath home offers a comfortable layout with plenty of charm. Inside, you'll find a functional kitchen, a cozy den perfect for relaxing or entertaining, and a spacious backyard The exterior showcases timeless brickwork, and a driveway. Located in a well-established, active neighborhood with a mix of longtime residents, the home reflects local character and a true sense of community. Being sold as-is, this property is a great opportunity for buyers ready to add their personal touch and unlock its full potential.
Key facts
- Functional kitchen
- Cozy den
- Spacious backyard
Tags
Property features AI
Finance
- HOA & community: Street lights in the community
Exterior
- Parking: 1-car garage; 1-car carport
- Utilities: Public water; Public sewer; Cable available; Electricity available; Natural gas available
- Home design: Single-family house; One story; Brick veneer construction; Slab foundation
- Construction: Brick veneer; Asphalt shingle roof; Slab foundation
- Exterior features: Patio/porch (other); Other exterior features; Asphalt shingle roof
Interior
- Kitchen: Electric range
- Flooring: Carpet; Combination; Laminate
- Bathrooms: 1 full bathroom
- Heating & cooling: Central heating; Central air conditioning
- Interior features: Carpet, combination, and laminate flooring; Electric range
Neighborhood map
What this means for you Summary
Snapshot
- This is a 3-bed/1.0-bath other listed at $57k.
Deal economics
- At list price, monthly cash flow is $366 ($4k/yr) — positive.
- The deal already cash-flows at list — no discount required.
- Meets the 1% rule at list price ($988 rent vs $57k).
- Recommended offer: $56k (1.5% below list) — sets the bar for market timing.
- Cap rate 14.0% vs local median 4.9% in Greenwood — top-decile yield for the area; either an underpriced asset or a hidden risk that comps aren't pricing in. Stress-test before assuming the spread holds.
Location & tenants
- Location reads 71/100 on livability (#31 in MS) — a middle-class / working-renter tenant base. Strengths: cost of living A+, health & safety A+, housing A; Watch: schools D, amenities F, commute F.
- Market conditions: 100 active listings in the ZIP; 9 units permitted in Leflore County in 2024 (0 in 5+ unit buildings).
Forward outlook
- Local home prices are declining (-3.0%/yr); year-one equity from $394 of loan paydown is wiped out by about $2k of value loss. Plan a longer hold.
- Leflore County population projected at -29% by 2050 — secular population decline; favor cash flow + early exit over multi-decade hold.
- At projected returns (-3.0% appreciation + 3.0% rent growth), your $16k cash investment doubles in ~5 years — after that, you're playing with house money.
Negotiation context
- It's been on market 20 days — a 2% lower offer ($56k) is reasonable based on typical stale-listing flexibility.
Risks & watch-outs
- Climate carrying-cost: moderate flood risk; major wind risk, 27% chance of damaging wind over 30y; extreme-heat days projected 7→21/yr by 2055 (HVAC capex compounding) — expect insurance premiums to compound above CPI over the hold.
Questions for the listing agent
- Built in 1970 — when were the roof, HVAC, electrical panel, plumbing, and water heater last replaced?
- Is there a deadline driving the sale (1031 exchange, divorce, estate, relocation)? That informs how much negotiation room exists.
- Schools are D-rated, which usually means shorter tenancies and higher turnover. Who's the typical renter profile here, and what's been the actual vacancy rate?
- What's the average days-on-market for RENTAL listings here right now (not sales)? A rising rental-DOM trend means longer vacancies and softer asking-rent achievability than the comps imply.
- What's the recent tenant-quality profile in this submarket — average credit score on applications, eviction rate, late-payment / NSF rate, and stable-employment percentage? A property-management company in the area should have these aggregated.
- How much new for-sale + rental construction is in the pipeline within 1–3 miles? Heavy new supply typically softens prices + rents 12–24 months out; constrained supply supports both.
Investment metrics
- 1% rule
- 1.73% ✓
- Cap rate
- 14.01%
- Cash-on-cash
- 27.55%
- DSCR
- 2.23
- GRM
- 4.8
CMA / ARV
No comps found within radius.
Projected returns pro-forma
-3.0% appreciation · 3.0% rent growth · sell at horizon
- IRR
- 21.6%
- Equity multiple
- 1.89×
- Total profit
- $14,127
- Equity at exit
- $8,499
- IRR
- 29.7%
- Equity multiple
- 3.66×
- Total profit
- $42,460
- Equity at exit
- $4,928
Cash invested: $15,960 (down + closing). Projections, not guarantees.
Landlord ↔ Tenant lean methodology
- Overall (STATE)
- 90 Strongly Landlord-Friendly
- State Mississippi
- 90 Strongly Landlord-Friendly · R+11
- County
- — inherits STATE
- City
- — inherits STATE
ZIP-level market 38930
- Home prices YoY
- -18.6%
- Active inventory
- 100
- Price-to-rent
- 4.8×
Monthly cashflow live
- Estimated rent
- $988 medium interval (Pro) →
- Mortgage (P&I)
- −$299
- Tax from tax record
- −$91 /mo · $1,094/yr
- Insurance
- −$24
- HOA
- −$0
- Vacancy / Maint / Mgmt
- −$207
- Net cashflow
- $366
Break-even live
UW: 25.0% down · 7.5% · 30yr · 1.5% tax · 5.0% vac · 8.0% maint · 8.0% mgmt
Financing live
Cash to close
- Down payment
- $14,250
- Closing costs
- $1,710
- Reserves months
- —
- Total cash needed
- —
Loan-product check · same deal, 3 products live
Conventional
25% down · 7.5% · 30yr
- Down + closing
- —
- Monthly P&I
- —
- Monthly cashflow
- —
- DSCR
- —
- Eligible?
- —
Personal DTI + credit; lowest rate.
DSCR
20% down · 8.5% · 30yr
- Down + closing
- —
- Monthly P&I
- —
- Monthly cashflow
- —
- DSCR
- —
- Eligible?
- —
No personal income docs; deal must DSCR.
Hard money
10% down · 12.0% · 12mo
- Down + closing
- —
- Monthly P&I
- —
- Monthly cashflow
- —
- DSCR
- —
- Eligible?
- —
Short-term bridge; refi at stabilization.
Listing history 15 events
-
2026-06-18days on market $57,000 Active 20 DOM
-
2026-06-17days on market $57,000 Active 19 DOM
-
2026-06-16days on market $57,000 Active 18 DOM
-
2026-06-15days on market $57,000 Active 17 DOM
-
2026-06-13days on market $57,000 Active 15 DOM
-
2026-06-12days on market $57,000 Active 14 DOM
-
2026-06-09days on market $57,000 Active 11 DOM
-
2026-06-08days on market $57,000 Active 10 DOM
-
2026-06-07days on market $57,000 Active 9 DOM
-
2026-06-04days on market $57,000 Active 5 DOM
-
2026-06-02pricedays on market $57,000 Active 4 DOM
-
2026-06-01days on market $49,000 Active 3 DOM
-
2026-05-31days on market $49,000 Active 2 DOM
-
2026-05-29$49,000 Active
-
1997-02-13soldstatus
ⓘ Source: listings_history table (triggers on properties + properties_extension) + one-shot
backfill from property_details.listing_events for pre-trigger history.
Tax reassessment forecast MS · Resets to sale price
- Current annual tax
- $1,094 · $91/mo
- Projected year-2 tax
- $1,094 · $91/mo
- Expected delta
- $0/yr ($0/mo · 0.0%)
ⓘ Screening estimate from a state-policy table — verify with the county assessor before closing.
Climate risk First Street
- Flood 5/10 Major FEMA zone X · 24% chance over 30 yrs
- Wildfire 1/10 Low
- Heat 7/10 Severe 7 d/yr ≥110°F today · 21 d/yr by 30 yrs out
- Wind 6/10 Major 27% chance of damaging wind over 30 yrs
- Air quality 1/10 Low 0 unhealthy d/yr today · 0 by 30 yrs out
Nearby sold comps map
Loading sold comps map…
Walkable amenities ~0.75 mi
Loading nearby amenities…
Taxation est. · year 1
- Rental income
- $11,852
- − Mortgage interest
- −$3,193
- − Property taxes
- −$1,094
- − Insurance
- −$285
- − Repairs & maintenance
- −$948
- − Management
- −$948
- − Depreciation
- −$1,658
- Taxable income
- $3,725
- Est. tax owed @ 24.0%
- −$894
- After-tax cash flow
- $3,503/yr
For passive investors: Depreciation is non-cash, so a rental often shows a tax loss while cash-flowing — sheltering income. Rental losses are passive: they offset passive income freely, and up to $25,000/yr can offset ordinary (W-2) income if you actively participate and your MAGI is under $100k (phasing out to $0 by $150k); unused losses carry forward. On sale, claimed depreciation is recaptured at up to 25%, and gains may owe capital-gains tax (a 1031 exchange can defer both). Figures are a year-1 estimate at your 24.0% rate — not tax advice; consult a CPA.
Schools (NCES district)
No district data.
Livability — Greenwood
- Score
- 71/100
- State rank
- #31
- US rank
- #6625
Category grades
Schools grade is shown separately in the Schools card above.
Census & demographics
- Population (ZIP)
- 23,326
Population outlook (Leflore County) Hauer SSP2
- Today (2025)
- 27,008 people
- By 2030
- 25,362 · -6.1%
- By 2040
- 22,049 · -18.4%
- By 2050
- 19,188 · -29.0%
- By 2075
- 13,543 · -49.9%
- By 2100
- 8,913 · -67.0%
Race, ethnicity, and origin ACS 2023
- Neighborhood character
- Predominantly Black (70%)
- Race & ethnicity
- Black 70% White 25% Hispanic / Latino 3% Two or more races 1%
- Common ancestry
- Slovak 1% Serbian 1%
- Foreign-born
- 2% · Canada, Jamaica
- Languages at home
- 97% English-only · Spanish 2%
Political lean MEDSL · Leflore
- 2024 margin
- Solid D (+38.5) · D 68.7% · R 30.3%
- 2008→2024 swing
- +1.7pp toward D · 2008: 36.8pp · 2024: 38.5pp
- All cycles
- 2024: D+38.5 2020: D+41.5 2016: D+41.0 2012: D+45.8 2008: D+36.8
Not yet ingested
- Civics
- —
Market trends
- HPI YoY
- ▼ -34.32%
- Current HPI
- 150.2668
- Rent YoY
- —
- Metro
- —
- State GDP YoY
- —
- F500 in state
- 0
Price history
2 events — show timeline
- 2026-05-29 Listed $49,000 MLSU
- 1997-02-13 Sold (Public Records) — Public Records
Property tax history
+4.3%/yrLatest (2025): $1,094 · +30.1% YoY. Source: county tax records.
Cash-flow waterfall
monthlySold comps — $/sqft
last 12 mo · ≤1 miLoading sold comps…