 Duplex
2000 Lewis Ave · Long Beach, CA
Flood risk 1/10 · Minimal
- FEMA flood zone
- X
- Chance of flooding over 30 yrs
- 0.0%
- Est. flood insurance / yr
- $507 – $1,088
Fire risk 1/10 · Minimal
- Est. fire insurance / yr
- $659 – $1,223
Heat risk 4/10 · Minor
- Hot days now (above 88°F)
- 7 days/yr
- Hot days in 30 yrs
- 23 days/yr
Wind risk 1/10 · Minimal
- Chance of severe wind over 30 yrs
- —
Air-quality risk 6/10 · Moderate
- Unhealthy air days now
- 9 days/yr
- Unhealthy air days in 30 yrs
- 10 days/yr
Risk factors via First Street. Map © Google.
Why this score? — see what drove the D grade
The composite is a weighted blend of 9 inputs, each scored 0–100. Each bar is that input's sub-score; the figure is the points it added to the 100-point composite (weight × sub-score).
- Cash flow +15.4/30.0
- ARV discount +7.5/15.0
- DSCR +4.7/10.0
- Schools +3.7/10.0
- Livability +3.4/5.0
- 1% rule +2.9/10.0
- Rent growth +2.7/5.0
- Condition / age +2.5/5.0
- Appreciation +0.0/10.0
$475,000
🖨 Deal sheet (PDF) 📄 Offer letter ✓ Due diligence
Multi-family units
County records classify this as Multi-Family (2-4 Unit). Listing-text estimate: 2 units. confirmed
Listing remarks
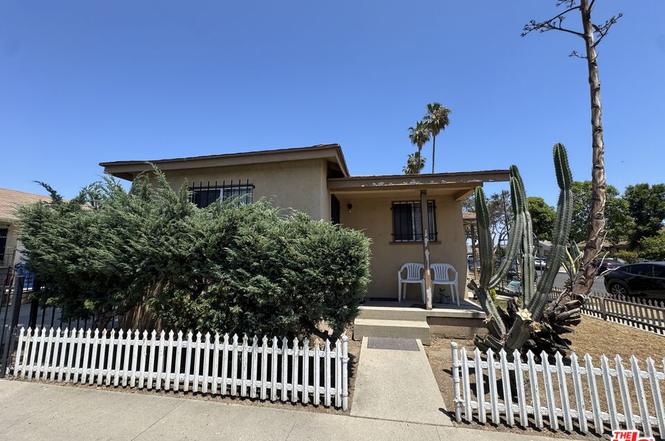
Duplex for sale in Long Beach, CA, offering an excellent opportunity for investors looking to add value and build equity. The property consists of two 1-bedroom, 1-bathroom units with a combined 1,039 square feet of living space situated on a 3,511 square foot lot. Both units are occupied by long-term tenants and offer strong potential for future improvements. With some care and renovations, this property could truly shine and become a standout investment. Additional features include garage parking and a driveway for added convenience. Centrally located in Long Beach with easy access to the 710 and 405 freeways, this income-producing property offers excellent connectivity to employment cent
Key facts
- Driveway
- Garage parking
- Duplex
Tags
Property features AI
Finance
- Other: Zoning: LBR1N
- Financial info: Gross operating income: $30,156; Net operating income: $19,050.64; Total annual expenses: $11,105; Cap rate: 4.01%; Gross rent multiplier: 15.75; Unit 1 current rent: $918 (projected $1,600); Unit 2 current rent: $1,595 (projected $1,600); Actual rent status: Actual
- HOA & community: 2 total units in the complex
Exterior
- Parking: Driveway parking
- Home design: Residential income duplex; Single-level building
- Exterior features: Shed on property
Interior
- Bedrooms: Unit 1: 1 bedroom; Unit 2: 1 bedroom
- Bathrooms: Unit 1: 1 bathroom; Unit 2: 1 bathroom
- Heating & cooling: Wall heating; Ceiling fan
- Interior features: Ceiling fan
Neighborhood map
What this means for you Summary
Snapshot
- This is a 2 × 2-bed/2.0-bath units multifamily listed at $475k.
Deal economics
- At list price, monthly cash flow is $179 ($2k/yr) — positive. Per door: $89/mo.
- The deal already cash-flows at list — no discount required.
- To meet the 1% rule (rent ≥ 1% of price), the offer needs to be $376k (20.9% below list).
- Recommended offer: $376k (20.9% below list) — sets the bar for 1% rule.
- Cap rate 6.7% vs local median 1.9% in Long Beach — top-decile yield for the area; either an underpriced asset or a hidden risk that comps aren't pricing in. Stress-test before assuming the spread holds.
Location & tenants
- Location reads 67/100 on livability (#319 in CA) — a middle-class / working-renter tenant base. Strengths: amenities A+, commute A+, employment B+; Watch: health & safety C-, crime F, cost of living F.
- Long Beach Unified (urban): math 34% / reading 50% proficiency, ranked #216 of 517 in CA (top 42%) — families likely to look elsewhere, expect single-tenant / working-renter base with shorter leases.
- Zoned schools: Signal Hill Elementary (math 26%, 657 students, 67% FRL); Jessie Nelson Academy (math 25% / reading 33%, grade F, #224 of 498 statewide, top 46%, 834 students, 70% FRL); Polytechnic High (math 54% / reading 72%, grade B-, #184 of 1,170 statewide, top 16%, 3,952 students, 54% FRL) — zoned schools at 64% FRL track the district average.
- Market conditions: Rents flat; 48 active listings in the ZIP; 40 comparable units currently listed for rent nearby; rentals lingering (median 46d on market — plan ~5-8 weeks vacancy on turnover, expect pricing pressure); 52% of comp listings sitting > 30 days — soft ceiling on asking rent; solid renter incomes; 19,697 units permitted in Los Angeles County in 2024 (9,426 in 5+ unit buildings).
- At $3,759/mo this rent would consume 57% of the median local household income ($79k/yr) (locally 2135% of renters already pay >50% of income on rent) — very limited rent-growth headroom before tenants either downsize or default.
Forward outlook
- Local home prices are declining (-3.0%/yr); year-one equity from $3k of loan paydown is wiped out by about $14k of value loss. Plan a longer hold.
- Los Angeles County population projected at +9% by 2050 — modest demand growth; plan on rents tracking national, not racing it.
Negotiation context
- Only 5 days on market — expect competitive offers; lowballing is unlikely to land.
- 2 sale attempts since 3y ago with the ask held roughly flat each time — persistent listings suggest the price (not the market) is what's stuck; bring a comps-based counter.
- Current owner paid $28k; list at $475k implies a 1596% gain — meaningful room to come down on a strong offer.
Risks & watch-outs
- Watch-outs: built in 1955 — expect roof / HVAC / electrical / plumbing capex.
Questions for the listing agent
- Can we see the unit-by-unit rent roll, current vacancy, and any below-market leases? What's the average tenancy length?
- What capital expenditures (roof, boiler, parking lot, exteriors) have been made in the last 5 years, and what's planned in the next 2?
- Built in 1955 — when were the roof, HVAC, electrical panel, plumbing, and water heater last replaced?
- Is there a deadline driving the sale (1031 exchange, divorce, estate, relocation)? That informs how much negotiation room exists.
- Crime grade is F in this area — have there been break-ins, vandalism, or insurance claims at this property in the last 3 years? What carrier currently insures it and at what premium?
- The area grade is low — what's the realistic commute time and amenity access for the typical tenant pool here? Any planned neighborhood developments (good or bad) we should know about?
- What's the average days-on-market for RENTAL listings here right now (not sales)? A rising rental-DOM trend means longer vacancies and softer asking-rent achievability than the comps imply.
- What's the recent tenant-quality profile in this submarket — average credit score on applications, eviction rate, late-payment / NSF rate, and stable-employment percentage? A property-management company in the area should have these aggregated.
- How much new apartment / multifamily construction is in the pipeline within 1–3 miles? Heavy new supply (>2% of stock underway) typically softens rents 12–24 months out; light construction supports rent growth.
Investment metrics
- 1% rule
- 0.79% ✗
- Cap rate
- 6.74%
- Cash-on-cash
- 1.61%
- DSCR
- 1.07
- GRM
- 10.5
CMA / ARV
No comps found within radius.
Projected returns pro-forma
-3.0% appreciation · 0.83% rent growth · sell at horizon
- IRR
- -15.9%
- Equity multiple
- 0.44×
- Total profit
- $-73,855
- Equity at exit
- $70,824
- IRR
- -11.2%
- Equity multiple
- 0.38×
- Total profit
- $-82,198
- Equity at exit
- $41,069
Cash invested: $133,000 (down + closing). Projections, not guarantees.
Landlord ↔ Tenant lean methodology
- Overall (STATE)
- 18 Strongly Tenant-Friendly
- State California
- 18 Strongly Tenant-Friendly · D+13
- County
- — inherits STATE
- City
- — inherits STATE
ZIP-level market 90806
- Rents YoY
- 0.8%
- Active inventory
- 48
- Price-to-rent
- 21.1×
Monthly cashflow live
- Estimated rent
- $3,759 high interval (Pro) →
- Mortgage (P&I)
- −$2,491
- Tax from tax record
- −$102 /mo · $1,222/yr
- Insurance
- −$198
- HOA
- −$0
- Vacancy / Maint / Mgmt
- −$789
- Net cashflow
- $179
Break-even live
Sensitivity live
| Price | -10% $448 | -5% $313 | +0% $179 | +5% $44 | +10% $-90 |
|---|---|---|---|---|---|
| Rent | -10% $-118 | -5% $30 | +0% $179 | +5% $327 | +10% $476 |
| Rate | -1.0pp $418 | -0.5pp $300 | base $179 | +0.5pp $56 | +1.0pp $-69 |
2-unit breakdown (identical units grouped — click to expand)
| Units | Beds | Baths | Est. rent |
|---|---|---|---|
| 2× units | 2 | 2 | $3,758 |
| #1 | 2 | 2 | $1,879 |
| #2 | 2 | 2 | $1,879 |
| Total (2 units) | $3,759 | ||
UW: 25.0% down · 7.5% · 30yr · 1.5% tax · 5.0% vac · 8.0% maint · 8.0% mgmt
Financing live
Cash to close
- Down payment
- $118,750
- Closing costs
- $14,250
- Reserves months
- —
- Total cash needed
- —
Loan-product check · same deal, 3 products live
Conventional
25% down · 7.5% · 30yr
- Down + closing
- —
- Monthly P&I
- —
- Monthly cashflow
- —
- DSCR
- —
- Eligible?
- —
Personal DTI + credit; lowest rate.
DSCR
20% down · 8.5% · 30yr
- Down + closing
- —
- Monthly P&I
- —
- Monthly cashflow
- —
- DSCR
- —
- Eligible?
- —
No personal income docs; deal must DSCR.
Hard money
10% down · 12.0% · 12mo
- Down + closing
- —
- Monthly P&I
- —
- Monthly cashflow
- —
- DSCR
- —
- Eligible?
- —
Short-term bridge; refi at stabilization.
Rent comps 40 comps
| Address | Beds | Baths | Sqft | Rent | $/sqft | DOM | Units | Dist |
|---|---|---|---|---|---|---|---|---|
| 2052 Lewis Ave Long Beach, CA | 3.0 | 2.5 | 1169 | $3,200 | $2.74 | 45d | 1 | 0.04mi |
| 1057 E Salt Lake St Unit A Long Beach, CA | 2.0 | 1.0 | 700 | $2,200 | $3.14 | 45d | 1 | 0.16mi |
| 1164 E Salt Lake St Long Beach, CA | 2.0 | 1.0 | 750 | $2,400 | $3.20 | 45d | 1 | 0.17mi |
| 1027 E Hill St Unit 1049 Long Beach, CA | 3.0 | 1.0 | 788 | $2,195 | $2.79 | 45d | 1 | 0.23mi |
| 2161 Myrtle Ave Long Beach, CA | 3.0 | 3.0 | 1200 | $3,250 | $2.71 | 45d | 1 | 0.24mi |
| 1861 Orange Ave Long Beach, CA | 3.0 | 1.0 | 1117 | $3,300 | $2.95 | 19d | 1 | 0.25mi |
| 2226 Lewis Ave Apt 8 Long Beach, CA | 3.0 | 2.0 | 950 | $2,850 | $3.00 | 26d | 1 | 0.26mi |
| 1501 E 20th St Long Beach, CA | 2.0 | 1.0 | 850 | $1,975 | $2.32 | 45d | 1 | 0.35mi |
| 561 E 20th St Long Beach, CA | 1.0 | 1.0 | 700 | $1,999 | $2.86 | 7d | 1 | 0.38mi |
| 2068 Linden Ave Long Beach, CA | 2.0 | 1.0 | 800 | $1,895 | $2.37 | 17d | 1 | 0.40mi |
| 542 E Rhea St Unit 3 Long Beach, CA | 2.0 | 1.0 | 800 | $2,195 | $2.74 | 26d | 1 | 0.43mi |
| 1156 E 17th St Long Beach, CA | 2.0 | 1.0 | 700 | $2,400 | $3.43 | 0d | 1 | 0.43mi |
| 2248 Atlantic Ave Unit 4 Long Beach, CA | 2.0 | 1.0 | 850 | $1,895 | $2.23 | 45d | 1 | 0.44mi |
| 1305 E 17th St Long Beach, CA | 2.0 | 1.0 | 812 | $3,000 | $3.69 | 45d | 1 | 0.46mi |
| 1151 E 15th St Long Beach, CA | 2.0 | 1.0 | 863 | $2,250 | $2.61 | 45d | 1 | 0.53mi |
| 702 E Burnett St Long Beach, CA | 2.0 | 1.0 | 725 | $1,795 | $2.48 | 45d | 1 | 0.53mi |
| 549 E 17th St Unit 551 Long Beach, CA | 1.0 | 1.0 | 900 | $1,800 | $2.00 | 45d | 1 | 0.55mi |
| 2384 Linden Ave Unit 2386 Long Beach, CA | 2.0 | 1.0 | 725 | $2,095 | $2.89 | 26d | 1 | 0.59mi |
| 1470 Martin Luther King Junior Ave Long Beach, CA | 2.0 | 2.0 | 972 | $2,500 | $2.57 | 26d | 1 | 0.62mi |
| 1470 Martin Luther King Junior Ave Long Beach, CA | 2.0 | 2.0 | 972 | $2,750 | $2.83 | 45d | 1 | 0.62mi |
| 1850 Gardenia Ave Long Beach, CA | 2.0 | 1.0 | 823 | $1,895 | $2.30 | 22d | 1 | 0.64mi |
| 1850 Gardenia Ave Long Beach, CA | 2.0 | 1.0 | 823 | $1,995 | $2.42 | 26d | 1 | 0.64mi |
| 438 E 16th St Long Beach, CA | 1.0 | 1.0 | 850 | $1,850 | $2.18 | 45d | 1 | 0.67mi |
| 1615 Rose Ave Long Beach, CA | 2.0 | 1.0 | 800 | $1,895 | $2.37 | 24d | 1 | 0.68mi |
| 424 E 16th St Long Beach, CA | 2.0 | 1.0 | 1100 | $2,095 | $1.90 | 20d | 1 | 0.68mi |
| 424 E 16th St Apt E Long Beach, CA | 2.0 | 1.0 | 1100 | $2,095 | $1.90 | 18d | 1 | 0.68mi |
| 1496 Walnut Ave Long Beach, CA | 2.0 | 1.0 | 850 | $2,195 | $2.58 | 45d | 1 | 0.69mi |
| 1491 Atlantic Ave Long Beach, CA | 2.0 | 2.0 | 1115 | $2,295 | $2.06 | 45d | 1 | 0.69mi |
| 2240 N Legion Dr #207 Signal Hill, CA | 1.0 | 1.5 | 1300 | $2,800 | $2.15 | 45d | 1 | 0.70mi |
| 1483 Atlantic Ave Unit 4 Long Beach, CA | 1.0 | 1.0 | 723 | $1,830 | $2.53 | 7d | 1 | 0.71mi |
| 1598 Long Beach Blvd Long Beach, CA | 2.0 | 3.0 | 1230 | $3,325 | $2.70 | 26d | 2 | 0.75mi |
| 1598 Long Beach Blvd Long Beach, CA | 1.0 | 1.0 | 910 | $2,622 | $2.88 | 45d | 2 | 0.75mi |
| 2010 Pine Ave Unit 06 Long Beach, CA | 1.0 | 1.0 | 701 | $1,695 | $2.42 | 26d | 1 | 0.75mi |
| 2238 N Earl Ave Unit 2244 Long Beach, CA | 2.0 | 1.0 | 1000 | $2,195 | $2.19 | 14d | 1 | 0.76mi |
| 1815 Locust Ave #8 Long Beach, CA | 1.0 | 1.0 | 725 | $1,700 | $2.34 | 45d | 1 | 0.76mi |
| 1349 Walnut Ave Long Beach, CA | 2.0 | 2.0 | 1450 | $2,500 | $1.72 | 45d | 1 | 0.78mi |
| 1454 Gaviota Ave Long Beach, CA | 2.0 | 1.0 | 800 | $2,900 | $3.62 | 45d | 1 | 0.78mi |
| 1834 Pine Ave Unit 5 Long Beach, CA | 2.0 | 1.0 | 700 | $2,000 | $2.86 | 26d | 1 | 0.79mi |
| 739 E Willow St Unit 739B Signal Hill, CA | 2.0 | 1.0 | 800 | $2,000 | $2.50 | 45d | 1 | 0.79mi |
| 780 E Walton St Signal Hill, CA | 3.0 | 2.0 | 1200 | $3,100 | $2.58 | 20d | 1 | 0.80mi |
Listing history 4 events
-
2026-06-21days on market $475,000 Active 5 DOM
-
2026-06-18days on market $475,000 Active 2 DOM
-
2026-06-17remarks 699-char remark
-
2026-06-17$475,000 Active 1 DOM
ⓘ Source: listings_history table (triggers on properties + properties_extension) + one-shot
backfill from property_details.listing_events for pre-trigger history.
Tax reassessment forecast CA · Resets to sale price
- Current annual tax
- $1,222 · $102/mo
- Projected year-2 tax
- $3,610 · $301/mo
- Expected delta
- +$2,388/yr (+$199/mo · 195.4%)
ⓘ Screening estimate from a state-policy table — verify with the county assessor before closing.
Climate risk First Street
- Flood 1/10 Low FEMA zone X · 0% chance over 30 yrs
- Wildfire 1/10 Low
- Heat 4/10 Moderate 7 d/yr ≥88°F today · 23 d/yr by 30 yrs out
- Wind 1/10 Low
- Air quality 6/10 Major 9 unhealthy d/yr today · 10 by 30 yrs out
Nearby sold comps map
Loading sold comps map…
Walkable amenities ~0.75 mi
Loading nearby amenities…
Taxation est. · year 1
- Rental income
- $45,108
- − Mortgage interest
- −$26,607
- − Property taxes
- −$1,222
- − Insurance
- −$2,375
- − Repairs & maintenance
- −$3,609
- − Management
- −$3,609
- − Depreciation
- −$13,818
- Taxable loss
- −$6,132
- Est. tax savings @ 24.0%
- +$1,472
- After-tax cash flow
- $3,619/yr
For passive investors: Depreciation is non-cash, so a rental often shows a tax loss while cash-flowing — sheltering income. Rental losses are passive: they offset passive income freely, and up to $25,000/yr can offset ordinary (W-2) income if you actively participate and your MAGI is under $100k (phasing out to $0 by $150k); unused losses carry forward. On sale, claimed depreciation is recaptured at up to 25%, and gains may owe capital-gains tax (a 1031 exchange can defer both). Figures are a year-1 estimate at your 24.0% rate — not tax advice; consult a CPA.
Schools (NCES district)
- District
- Long Beach Unified
- NCES district ID
- 0622500
- Math proficiency
- 34% ▼ -11.00%
- Reading proficiency
- 50% ▼ -4.00%
- Median HH income
- $56,092
- Composite
- 36.67/100
- National rank
- #4607
- State rank
- #216 of 517 in CA
Livability — Long Beach
- Score
- 67/100
- State rank
- #319
- US rank
- #10758
Category grades
Schools grade is shown separately in the Schools card above.
Census & demographics
- Census place
- Long Beach, CA
- County
- Los Angeles County · 9,444,647 people
- City population
- 466,088
- Metro
- Los Angeles-Long Beach-Anaheim, CA
- Population (ZIP)
- 41,664
- Household income
- $79,208
- Rent vs Own
- Severe rent burden
- 2135.0
Population outlook (Los Angeles County) Hauer SSP2
- Today (2025)
- 10,940,515 people
- By 2030
- 11,256,481 · +2.9%
- By 2040
- 11,729,929 · +7.2%
- By 2050
- 11,948,407 · +9.2%
- By 2075
- 11,818,114 · +8.0%
- By 2100
- 10,842,928 · -0.9%
Race, ethnicity, and origin ACS 2023
- Neighborhood character
- Diverse neighborhood (Simpson 0.66)
- Race & ethnicity
- Hispanic / Latino 53% Asian 18% Two or more races 16% Black 14% White 11% Native American 1%
- Hispanic origin (detail)
- Mexican 43%
- Common ancestry
- Italian 1%
- Foreign-born
- 30% · Canada, Vietnam, China
- Languages at home
- 42% English-only · Spanish 43% Other Asian/Pacific 7% Tagalog/Filipino 5%
Political lean MEDSL · Los Angeles
- 2024 margin
- Solid D (+32.9) · D 64.8% · R 31.9% · Other 3.3%
- 2008→2024 swing
- -7.4pp toward R · 2008: 40.4pp · 2024: 32.9pp
- All cycles
- 2024: D+32.9 2020: D+44.2 2016: D+48.0 2012: D+40.0 2008: D+40.4
Not yet ingested
- Civics
- —
Market trends
- HPI YoY
- ▼ -687.38%
- Current HPI
- 457.1568
- Rent YoY
- ▲ 0.83%
- Metro
- Los Angeles-Long Beach-Anaheim, CA
- State GDP YoY
- ▲ 3.21%
- F500 in state
- 116
Industry mix (Fortune 500 HQ in CA)
| Industry | F500 HQs | Revenue |
|---|---|---|
| Technology | 27 | $1,492B |
|
||
| Financial Services | 3 | $174B |
|
||
| Retail | 3 | $44B |
|
||
| Insurance | 3 | $26B |
|
||
| Media / Entertainment | 2 | $115B |
|
||
| Pharmaceuticals / Biotech | 2 | $62B |
|
||
Price history
+1596.4% since first listed4 events — show timeline
- 2026-06-16 Listed $475,000 TheMLS
- 2023-10-11 Rental Removed $1,595 APPFOLIO
- 2023-10-07 Listed for Rent $1,595 APPFOLIO
- 1979-02-06 Sold (Public Records) $28,000 Public Records
Property tax history
+2.9%/yrLatest (2025): $1,222 · +3.0% YoY. Source: county tax records.
Cash-flow waterfall
monthlySold comps — $/sqft
last 12 mo · ≤1 miLoading sold comps…