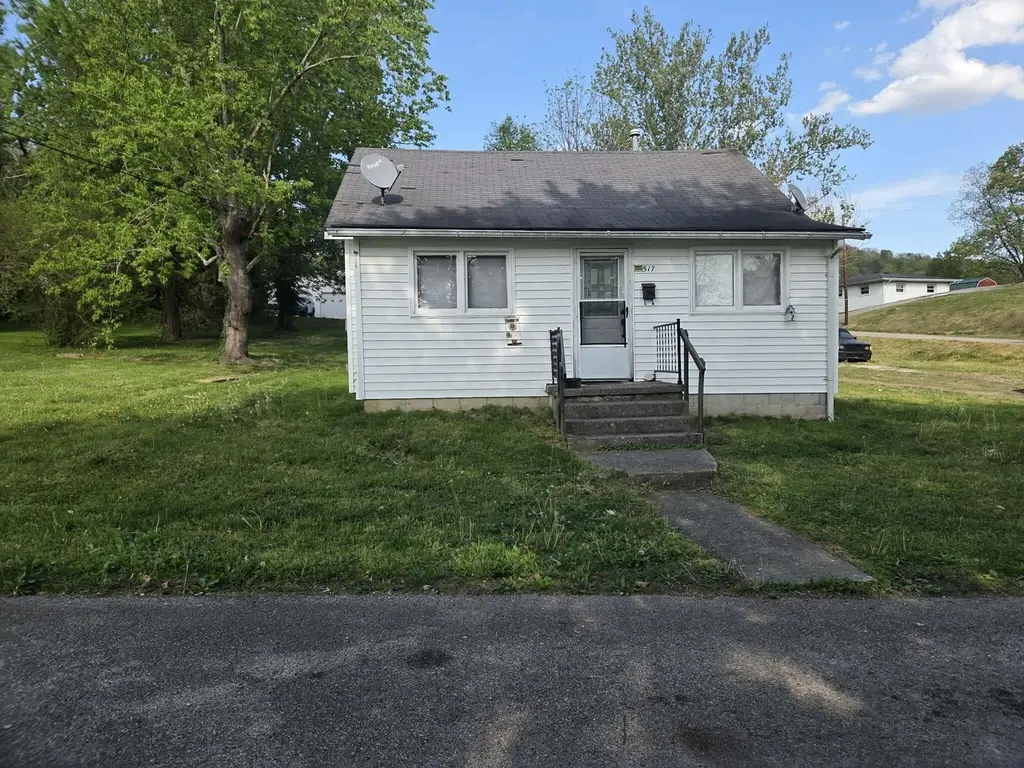
517 Cantrill St · Irvine, KY
Flood risk 1/10 · Minimal
- FEMA flood zone
- X (unshaded)
- Chance of flooding over 30 yrs
- 0.0%
- Est. flood insurance / yr
- $473 – $860
Fire risk 5/10 · Moderate
- Est. fire insurance / yr
- $839 – $1,559
Heat risk 5/10 · Moderate
- Hot days now (above 101°F)
- 7 days/yr
- Hot days in 30 yrs
- 20 days/yr
Wind risk 2/10 · Minimal
- Chance of severe wind over 30 yrs
- 4.0%
Air-quality risk 1/10 · Minimal
- Unhealthy air days now
- 0 days/yr
- Unhealthy air days in 30 yrs
- 0 days/yr
Risk factors via First Street. Map © Google.
Why this score? — see what drove the B- grade
The composite is a weighted blend of 9 inputs, each scored 0–100. Each bar is that input's sub-score; the figure is the points it added to the 100-point composite (weight × sub-score).
- Cash flow +30.0/30.0
- DSCR +10.0/10.0
- 1% rule +8.5/10.0
- ARV discount +7.5/15.0
- Livability +3.2/5.0
- Rent growth +2.5/5.0
- Condition / age +2.5/5.0
- Schools +2.1/10.0
- Appreciation +0.0/10.0
$69,000
🖨 Deal sheet 📄 Offer letter ✓ Due diligence
Listing remarks MLS
Great investment property! Large corner lot with detached garage. Current owner has used the property as a rental for years and is ready to retire. Begin your investment portfolio today. Great flip potential. Or make the improvements, build equity and remodel the property to your dream home.
Key facts
- Rental property
- Corner lot
- Detached garage
Tags
Neighborhood map
What this means for you Summary
Snapshot
- This is a 3-bed/1.0-bath single-family listed at $69k.
Deal economics
- At list price, monthly cash flow is $322 ($4k/yr) — positive.
- The deal already cash-flows at list — no discount required.
- Meets the 1% rule at list price ($931 rent vs $69k).
- Recommended offer: $67k (3.0% below list) — sets the bar for market timing.
Location & tenants
- Location reads 65/100 on livability (#254 in KY) — a middle-class / working-renter tenant base. Strengths: crime A+, cost of living A+, housing A+; Watch: health & safety D+, schools F, amenities F.
- Estill County (rural): math 19% / reading 33% proficiency, ranked #146 of 165 in KY (top 88%) — low school quality limits family demand, transient renter base, plan for 1-2y turnover.
- Market conditions: 120 active listings in the ZIP.
Forward outlook
- Local home prices are declining (-3.0%/yr); year-one equity from $477 of loan paydown is wiped out by about $2k of value loss. Plan a longer hold.
- Estill County population projected at -20% by 2050 — secular population decline; favor cash flow + early exit over multi-decade hold.
- At projected returns (-3.0% appreciation + 3.0% rent growth), your $19k cash investment doubles in ~7 years — after that, you're playing with house money.
Negotiation context
- It's been on market 34 days — a 3% lower offer ($67k) is reasonable based on typical stale-listing flexibility.
- Current owner paid $17k; list at $69k implies a 306% gain — meaningful room to come down on a strong offer.
Risks & watch-outs
- Watch-outs: built in 1920 — expect roof / HVAC / electrical / plumbing capex.
- Climate carrying-cost: moderate wildfire risk; extreme-heat days projected 7→20/yr by 2055 (HVAC capex compounding) — expect insurance premiums to compound above CPI over the hold.
Questions for the listing agent
- It's been on market 34 days. Have you received any prior offers? Is the seller open to a 3% concession, seller financing, or rate buy-down credit?
- Built in 1920 — when were the roof, HVAC, electrical panel, plumbing, and water heater last replaced?
- Is there a deadline driving the sale (1031 exchange, divorce, estate, relocation)? That informs how much negotiation room exists.
- Schools are F-rated, which usually means shorter tenancies and higher turnover. Who's the typical renter profile here, and what's been the actual vacancy rate?
- What's the average days-on-market for RENTAL listings here right now (not sales)? A rising rental-DOM trend means longer vacancies and softer asking-rent achievability than the comps imply.
- What's the recent tenant-quality profile in this submarket — average credit score on applications, eviction rate, late-payment / NSF rate, and stable-employment percentage? A property-management company in the area should have these aggregated.
- How much new for-sale + rental construction is in the pipeline within 1–3 miles? Heavy new supply typically softens prices + rents 12–24 months out; constrained supply supports both.
Investment metrics
- 1% rule
- 1.35% ✓
- Cap rate
- 11.90%
- Cash-on-cash
- 20.03%
- DSCR
- 1.89
- GRM
- 6.2
CMA / ARV
No comps found within radius.
Projected returns pro-forma
-3.0% appreciation · 3.0% rent growth · sell at horizon
- IRR
- 12.2%
- Equity multiple
- 1.48×
- Total profit
- $9,331
- Equity at exit
- $10,288
- IRR
- 21.1%
- Equity multiple
- 2.78×
- Total profit
- $34,469
- Equity at exit
- $5,966
Cash invested: $19,320 (down + closing). Projections, not guarantees.
Landlord ↔ Tenant lean methodology
- Overall (STATE)
- 83 Strongly Landlord-Friendly
- State Kentucky
- 83 Strongly Landlord-Friendly · R+16
- County
- — inherits STATE
- City
- — inherits STATE
ZIP-level market 40336
- Home prices YoY
- -10.5%
- Active inventory
- 120
- Price-to-rent
- 6.2×
Monthly cashflow live
- Estimated rent
- $931 medium interval (Pro) →
- Mortgage (P&I)
- −$362
- Tax from tax record
- −$23 /mo · $273/yr
- Insurance
- −$29
- HOA
- −$0
- Vacancy / Maint / Mgmt
- −$196
- Net cashflow
- $322
Break-even live
UW: 25.0% down · 7.5% · 30yr · 1.5% tax · 5.0% vac · 8.0% maint · 8.0% mgmt
Financing live
Cash to close
- Down payment
- $17,250
- Closing costs
- $2,070
- Reserves months
- —
- Total cash needed
- —
Loan-product check · same deal, 3 products live
Conventional
25% down · 7.5% · 30yr
- Down + closing
- —
- Monthly P&I
- —
- Monthly cashflow
- —
- DSCR
- —
- Eligible?
- —
Personal DTI + credit; lowest rate.
DSCR
20% down · 8.5% · 30yr
- Down + closing
- —
- Monthly P&I
- —
- Monthly cashflow
- —
- DSCR
- —
- Eligible?
- —
No personal income docs; deal must DSCR.
Hard money
10% down · 12.0% · 12mo
- Down + closing
- —
- Monthly P&I
- —
- Monthly cashflow
- —
- DSCR
- —
- Eligible?
- —
Short-term bridge; refi at stabilization.
Listing history 2 events
-
2026-04-16$69,000 Active 292-char remark
Show marketing remark (292 chars)
Great investment property! Large corner lot with detached garage. Current owner has used the property as a rental for years and is ready to retire. Begin your investment portfolio today. Great flip potential. Or make the improvements, build equity and remodel the property to your dream home.
-
1994-07-01soldstatus $17,000
ⓘ Source: listings_history table (triggers on properties + properties_extension) + one-shot
backfill from property_details.listing_events for pre-trigger history.
Tax reassessment forecast KY · Resets to sale price
- Current annual tax
- $273 · $23/mo
- Projected year-2 tax
- $593 · $49/mo
- Expected delta
- +$320/yr (+$27/mo · 117.4%)
ⓘ Screening estimate from a state-policy table — verify with the county assessor before closing.
Climate risk First Street
- Flood 1/10 Low FEMA zone X (unshaded) · 0% chance over 30 yrs
- Wildfire 5/10 Major
- Heat 5/10 Major 7 d/yr ≥101°F today · 20 d/yr by 30 yrs out
- Wind 2/10 Low 4% chance of damaging wind over 30 yrs
- Air quality 1/10 Low 0 unhealthy d/yr today · 0 by 30 yrs out
Nearby sold comps map
Loading sold comps map…
Walkable amenities ~0.75 mi
Loading nearby amenities…
Taxation est. · year 1
- Rental income
- $11,177
- − Mortgage interest
- −$3,865
- − Property taxes
- −$273
- − Insurance
- −$345
- − Repairs & maintenance
- −$894
- − Management
- −$894
- − Depreciation
- −$2,007
- Taxable income
- $2,898
- Est. tax owed @ 24.0%
- −$696
- After-tax cash flow
- $3,174/yr
For passive investors: Depreciation is non-cash, so a rental often shows a tax loss while cash-flowing — sheltering income. Rental losses are passive: they offset passive income freely, and up to $25,000/yr can offset ordinary (W-2) income if you actively participate and your MAGI is under $100k (phasing out to $0 by $150k); unused losses carry forward. On sale, claimed depreciation is recaptured at up to 25%, and gains may owe capital-gains tax (a 1031 exchange can defer both). Figures are a year-1 estimate at your 24.0% rate — not tax advice; consult a CPA.
Schools (NCES district)
- District
- Estill County
- NCES district ID
- 2101760
- Math proficiency
- 19% ▼ -24.00%
- Reading proficiency
- 33% ▼ -13.00%
- Median HH income
- $29,324
- Composite
- 20.86/100
- National rank
- #8498
- State rank
- #146 of 165 in KY
Livability — Irvine
- Score
- 65/100
- State rank
- #254
- US rank
- #12740
Category grades
Schools grade is shown separately in the Schools card above.
Census & demographics
- Census place
- Irvine, KY
- Population (ZIP)
- 12,650
Population outlook (Estill County) Hauer SSP2
- Today (2025)
- 13,588 people
- By 2030
- 13,086 · -3.7%
- By 2040
- 12,012 · -11.6%
- By 2050
- 10,928 · -19.6%
- By 2075
- 8,646 · -36.4%
- By 2100
- 6,689 · -50.8%
Race, ethnicity, and origin ACS 2023
- Neighborhood character
- Predominantly White (96%)
- Race & ethnicity
- White 96% Two or more races 3% Asian 1% Hispanic / Latino 1%
- Common ancestry
- Serbian 2% Slovak 1% Italian 1%
- Foreign-born
- 2% · Canada, China
- Languages at home
- 98% English-only · Spanish 1% Chinese 1%
Political lean MEDSL · Estill
- 2024 margin
- Solid R (+63.2) · D 17.7% · R 81.0% · Other 1.3%
- 2008→2024 swing
- -23.1pp toward R · 2008: -40.1pp · 2024: -63.2pp
- All cycles
- 2024: R+63.2 2020: R+57.3 2016: R+56.5 2012: R+46.2 2008: R+40.1
Not yet ingested
- Civics
- —
Market trends
- HPI YoY
- ▼ -25.66%
- Current HPI
- 219.2756
- Rent YoY
- —
- Metro
- —
- State GDP YoY
- ▲ 1.81%
- F500 in state
- 4
Industry mix (Fortune 500 HQ in KY)
| Industry | F500 HQs | Revenue |
|---|---|---|
| Healthcare | 1 | $118B |
|
||
| Food / Beverage | 1 | $7B |
|
||
Price history
+305.9% since first listed2 events — show timeline
- 2026-04-16 Listed $69,000 ImagineMLS
- 1994-07-01 Sold (Public Records) $17,000 Public Records
Property tax history
+0.3%/yrLatest (2025): $273 · -0.3% YoY. Source: county tax records.
Cash-flow waterfall
monthlySold comps — $/sqft
last 12 mo · ≤1 miLoading sold comps…