 🔨 Auction
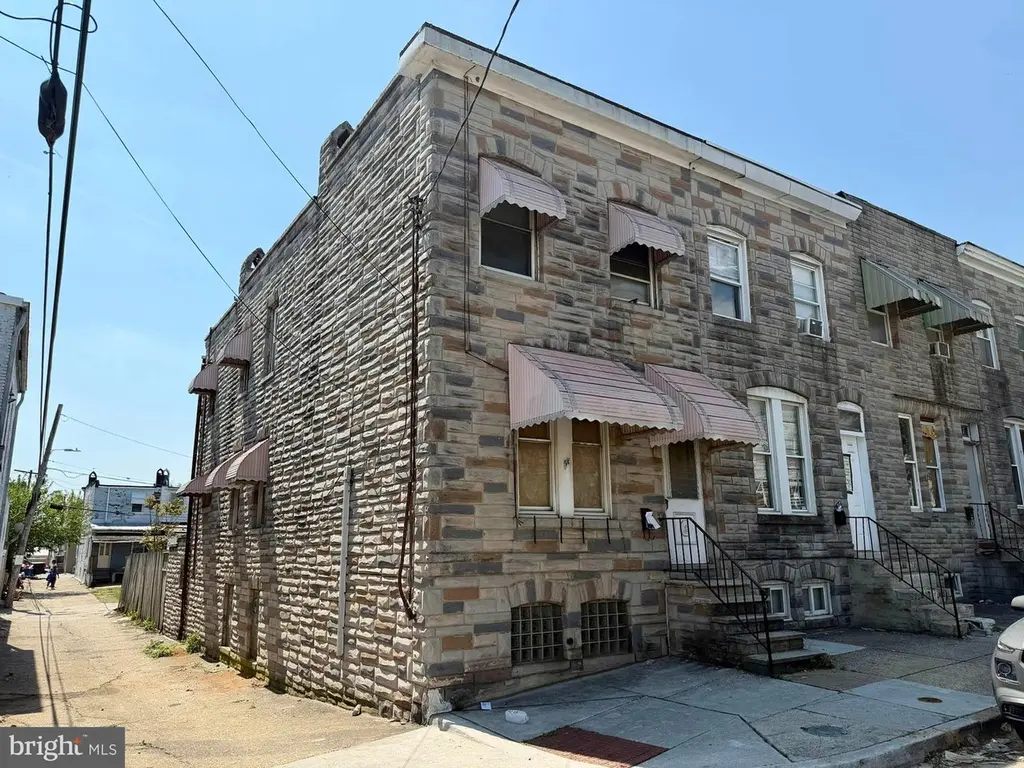
1631 Church St · Baltimore, MD
Flood risk 1/10 · Minimal
- FEMA flood zone
- X (unshaded)
- Chance of flooding over 30 yrs
- 0.0%
- Est. flood insurance / yr
- $473 – $860
Fire risk 1/10 · Minimal
- Est. fire insurance / yr
- $755 – $1,403
Heat risk 8/10 · Major
- Hot days now (above 103°F)
- 7 days/yr
- Hot days in 30 yrs
- 15 days/yr
Wind risk 6/10 · Moderate
- Chance of severe wind over 30 yrs
- 27.0%
Air-quality risk 4/10 · Minor
- Unhealthy air days now
- 5 days/yr
- Unhealthy air days in 30 yrs
- 7 days/yr
Risk factors via First Street. Map © Google.
Why this score? — see what drove the B+ grade
The composite is a weighted blend of 9 inputs, each scored 0–100. Each bar is that input's sub-score; the figure is the points it added to the 100-point composite (weight × sub-score).
- Cash flow +30.0/30.0
- DSCR +10.0/10.0
- 1% rule +9.5/10.0
- Appreciation +8.9/10.0
- ARV discount +7.5/15.0
- Livability +3.8/5.0
- Rent growth +2.5/5.0
- Condition / age +2.5/5.0
- Schools +1.0/10.0
$25,000
🖨 Deal sheet 📄 Offer letter ✓ Due diligence
Listing remarks
ONLINE REAL ESTATE AUCTION TO THE HIGHEST BIDDER OVER $25,000!! Bidding Opens - Monday, May 18, 2026. Bidding Closes - Tuesday, May 19, 2026 at 11:30 AM. List price is opening bid only. Estate sale of a two-story brick end-of-group townhome in Curtis Bay requiring full renovation. Well-located in South Baltimore with convenient access to major highways, employment hubs, and surrounding areas including Baltimore Peninsula, Brooklyn Park and northern Anne Arundel County. This auction is ideal for investors looking to renovate and resell or add to a rental portfolio.
Key facts
- Built 1920
- Listed 19 days
Property features AI
Finance
- Financial info: Total below-grade area 705; Below-grade unfinished area 705; Above-grade finished area 1,560; Improvement assessed value $48,000; Land assessed value $12,000; Tax assessed value $60,000; Property condition: Major rehab needed
Exterior
- Utilities: Public water; Public sewer
- Home design: End of row townhouse; Fee simple ownership; Major rehab needed
- Construction: Brick construction; Other foundation; Built year per assessor
- Exterior features: Rear fencing; Patio(s)
Interior
- Bedrooms: 2 bedrooms on the first upper level
- Bathrooms: 1 full bathroom
- Heating & cooling: Other heating; Other cooling; Other hot water
- Interior features: Attic; Unfinished basement
Neighborhood map
What this means for you Summary
Snapshot
- This is a 2-bed/1.0-bath townhouse listed at $25k.
Deal economics
- At list price, monthly cash flow is $557 ($7k/yr) — positive.
- The deal already cash-flows at list — no discount required.
- Meets the 1% rule at list price ($2k rent vs $25k).
- Recommended offer: $25k (1.5% below list) — sets the bar for market timing.
- Cap rate 12.6% vs local median 6.0% in Baltimore — top-decile yield for the area; either an underpriced asset or a hidden risk that comps aren't pricing in. Stress-test before assuming the spread holds.
Location & tenants
- Location reads 76/100 on livability (#90 in MD, #3,396 nationally) — a middle-class / working-renter tenant base. Strengths: amenities A+, commute A+, housing A+; Watch: schools D, crime F.
- Baltimore City Public Schools (urban): math 7% / reading 16% proficiency, ranked #24 of 24 in MD (top 100%) — low school quality limits family demand, transient renter base, plan for 1-2y turnover; 79% free/reduced lunch — lower-income household profile, screen leases tightly.
- Market conditions: 45 active listings in the ZIP; 18 comparable units currently listed for rent nearby; rentals at typical pace (median 24d on market — plan ~3-4 weeks tenant-placement turnaround); 1,273 units permitted in Baltimore city in 2024 (1,104 in 5+ unit buildings).
Forward outlook
- In year one you build about $9k of equity ($737 loan paydown + $8k appreciation (7.8% local appreciation)).
- Baltimore County population projected to shrink 4% by 2050 — rents likely to lag national; underwrite the cash flow, not the appreciation.
- At projected returns (7.8% appreciation + 3.0% rent growth), your $30k cash investment doubles in ~2 years — after that, you're playing with house money.
- By year 4, paydown + projected appreciation supports a ~$31k cash-out refi (75% LTV) — recoverable capital for the next deal without selling this one.
Negotiation context
- It's been on market 19 days — a 2% lower offer ($25k) is reasonable based on typical stale-listing flexibility.
Risks & watch-outs
- Watch-outs: property tax is 2.8% of price; built in 1920 — expect roof / HVAC / electrical / plumbing capex.
- Climate carrying-cost: major wind risk, 27% chance of damaging wind over 30y; extreme-heat days projected 7→15/yr by 2055 (HVAC capex compounding) — expect insurance premiums to compound above CPI over the hold.
Questions for the listing agent
- Built in 1920 — when were the roof, HVAC, electrical panel, plumbing, and water heater last replaced?
- Property tax is high relative to price — has the assessment been appealed recently, and will the sale trigger a re-assessment?
- Is there a deadline driving the sale (1031 exchange, divorce, estate, relocation)? That informs how much negotiation room exists.
- Schools are D-rated, which usually means shorter tenancies and higher turnover. Who's the typical renter profile here, and what's been the actual vacancy rate?
- Crime grade is F in this area — have there been break-ins, vandalism, or insurance claims at this property in the last 3 years? What carrier currently insures it and at what premium?
- What's the average days-on-market for RENTAL listings here right now (not sales)? A rising rental-DOM trend means longer vacancies and softer asking-rent achievability than the comps imply.
- What's the recent tenant-quality profile in this submarket — average credit score on applications, eviction rate, late-payment / NSF rate, and stable-employment percentage? A property-management company in the area should have these aggregated.
- How much new for-sale + rental construction is in the pipeline within 1–3 miles? Heavy new supply typically softens prices + rents 12–24 months out; constrained supply supports both.
Investment metrics
- 1% rule
- 1.45% ✓
- Cap rate
- 12.56%
- Cash-on-cash
- 22.37%
- DSCR
- 2.00
- GRM
- 5.8
CMA / ARV
- ARV (median comp)
- $106,654
- List price
- $25,000
- Delta
- -76.56%
- Verdict
- UNDERPRICED
- Comps
- 20 within 1.0 mi
Show comp detail 12 sales within ~0.75 mi
| Address | Dist | Beds/Ba | Sqft | Sold | Price | $/sf | Match |
|---|---|---|---|---|---|---|---|
| 1631 Church St | 0.00mi | 2/1.0 | 1,560 (0%) | 0mo | $30,000 | $19 | 100 |
| 4613 Pennington Ave | 0.11mi | 2/1.0 | 1,344 (-14%) | 2mo | $52,000 | $39 | 70 |
| 1326 Tompkins St | 0.47mi | 3/2.0 (+1) | 1,554 (-0%) | 3mo | $205,000 | $132 | 66 |
| 4922 Pennington | 0.11mi | 3/1.0 (+1) | 1,428 (-8%) | 22mo | $45,100 | $32 | 58 |
| 4817 Pennington Ave | 0.05mi | 3/1.0 (+1) | 1,328 (-15%) | 16mo | $106,000 | $80 | 54 |
| 1102 Inner Cir | 0.66mi | 3/1.5 (+1) | 1,599 (+2%) | 8mo | $205,000 | $128 | 52 |
| 1404 Filbert St | 0.28mi | 3/2.0 (+1) | 1,400 (-10%) | 14mo | $80,000 | $57 | 49 |
| 1604 Hazel | 0.24mi | 3/2.0 (+1) | 1,680 (+8%) | 22mo | $35,000 | $21 | 49 |
| 3930 Pennington | 0.45mi | 3/1.0 (+1) | 1,701 (+9%) | 13mo | $115,000 | $68 | 48 |
| 4026 Pennington Ave | 0.40mi | 3/2.5 (+1) | 1,680 (+8%) | 12mo | $189,900 | $113 | 48 |
| 4408 Fairhaven Ave | 0.26mi | 3/2.0 (+1) | 1,358 (-13%) | 17mo | $110,000 | $81 | 43 |
| 1321 E Patapsco Ave | 0.72mi | 3/3.0 (+1) | 1,536 (-2%) | 16mo | $159,000 | $104 | 38 |
Match score weights: distance 35% · size 25% · config 20% · recency 20%. Top-matched comps best support the ARV.
Projected returns pro-forma
7.75% appreciation · 3.0% rent growth · sell at horizon
- IRR
- 37.2%
- Equity multiple
- 3.60×
- Total profit
- $77,676
- Equity at exit
- $79,219
- IRR
- 33.3%
- Equity multiple
- 7.66×
- Total profit
- $198,937
- Equity at exit
- $155,555
Cash invested: $29,863 (down + closing). Projections, not guarantees.
Landlord ↔ Tenant lean methodology
- Overall (CITY)
- 12 Strongly Tenant-Friendly
- State Maryland
- 27 Tenant-Leaning · D+14
- County
- — inherits STATE
- City Baltimore
- 12 Strongly Tenant-Friendly · D+58
ZIP-level market 21226
- Home prices YoY
- 2.5%
- Active inventory
- 45
- Price-to-rent
- 1.4×
Monthly cashflow live
- Estimated rent
- $1,543 high interval (Pro) →
- Mortgage (P&I)
- −$559
- Tax from tax record
- −$58 /mo · $698/yr
- Insurance
- −$44
- HOA
- −$0
- Vacancy / Maint / Mgmt
- −$324
- Net cashflow
- $557
Break-even live
UW: 25.0% down · 7.5% · 30yr · 1.5% tax · 5.0% vac · 8.0% maint · 8.0% mgmt
Financing live
Cash to close
- Down payment
- $26,663
- Closing costs
- $3,200
- Reserves months
- —
- Total cash needed
- —
Loan-product check · same deal, 3 products live
Conventional
25% down · 7.5% · 30yr
- Down + closing
- —
- Monthly P&I
- —
- Monthly cashflow
- —
- DSCR
- —
- Eligible?
- —
Personal DTI + credit; lowest rate.
DSCR
20% down · 8.5% · 30yr
- Down + closing
- —
- Monthly P&I
- —
- Monthly cashflow
- —
- DSCR
- —
- Eligible?
- —
No personal income docs; deal must DSCR.
Hard money
10% down · 12.0% · 12mo
- Down + closing
- —
- Monthly P&I
- —
- Monthly cashflow
- —
- DSCR
- —
- Eligible?
- —
Short-term bridge; refi at stabilization.
Rent comps 18 comps
| Address | Beds | Baths | Sqft | Rent | $/sqft | DOM | Units | Dist |
|---|---|---|---|---|---|---|---|---|
| 1411 Filbert St Unit 2 Baltimore, MD | 2.0 | 1.0 | 1428 | $1,300 | $0.91 | 43d | 1 | 0.26mi |
| 1517 Sycamore St Curtis Bay, MD | 3.0 | 1.5 | 1210 | $1,999 | $1.65 | 23d | 1 | 0.53mi |
| 3816 W Bay Ave Unit 1 Baltimore, MD | 2.0 | 1.0 | 1364 | $1,155 | $0.85 | 3d | 1 | 0.74mi |
| 3828 10th St Brooklyn, MD | 3.0 | 2.0 | 1215 | $2,350 | $1.93 | 43d | 1 | 0.82mi |
| 3826 10th St Unit Entire House Baltimore, MD | 3.0 | 2.0 | 1110 | $2,400 | $2.16 | 23d | 1 | 0.82mi |
| 837 E Jeffrey St Unit 2 Baltimore, MD | 1.0 | 1.0 | 1116 | $900 | $0.81 | 43d | 1 | 0.92mi |
| 837 E Jeffrey St Apt 1 Baltimore, MD | 1.0 | 1.0 | 1116 | $900 | $0.81 | 17d | 1 | 0.92mi |
| 3840 8th St Brooklyn, MD | 3.0 | 1.5 | 1088 | $1,606 | $1.48 | 4d | 1 | 1.02mi |
| 4201 Audrey Ave Unit 1 Brooklyn, MD | 2.0 | 1.0 | 1400 | $1,350 | $0.96 | 23d | 1 | 1.06mi |
| 4206 Audrey Ave Brooklyn, MD | 3.0 | 3.0 | 1104 | $1,950 | $1.77 | 23d | 1 | 1.09mi |
| 4206 Audrey Ave Brooklyn, MD | 2.0 | 2.0 | 1104 | $1,275 | $1.15 | 43d | 1 | 1.09mi |
| 3822 6th St Brooklyn, MD | 3.0 | 3.0 | 1580 | $1,850 | $1.17 | 23d | 1 | 1.17mi |
| 603 Maude Ave Unit A Baltimore, MD | 1.0 | 1.0 | 1294 | $950 | $0.73 | 4d | 1 | 1.27mi |
| 3428 7th St Unit B Baltimore, MD | 1.0 | 1.0 | 1294 | $1,150 | $0.89 | 43d | 1 | 1.29mi |
| 3528 6th St Brooklyn, MD | 2.0 | 2.5 | 1060 | $1,500 | $1.42 | 17d | 1 | 1.29mi |
| 3569 4th St Brooklyn, MD | 2.0 | 1.5 | 1256 | $1,200 | $0.96 | 17d | 1 | 1.40mi |
| 140 Bethlehem Pl Brooklyn, MD | 3.0 | 3.5 | 1120 | $1,500 | $1.34 | 43d | 1 | 1.41mi |
| 166 Drydock Way Unit 1 Baltimore, MD | 3.0 | 2.5 | 1980 | $3,000 | $1.52 | 43d | 1 | 1.43mi |
Listing history 2 events
-
2026-04-30$25,000 Active 570-char remark
-
2026-04-29historical $25,000 570-char remark
ⓘ Source: listings_history table (triggers on properties + properties_extension) + one-shot
backfill from property_details.listing_events for pre-trigger history.
Tax reassessment forecast MD · Partial reset (capped growth)
- Current annual tax
- $698 · $58/mo
- Projected year-2 tax
- $698 · $58/mo
- Expected delta
- $0/yr ($0/mo · 0.0%)
ⓘ Screening estimate from a state-policy table — verify with the county assessor before closing.
Climate risk First Street
- Flood 1/10 Low FEMA zone X (unshaded) · 0% chance over 30 yrs
- Wildfire 1/10 Low
- Heat 8/10 Severe 7 d/yr ≥103°F today · 15 d/yr by 30 yrs out
- Wind 6/10 Major 27% chance of damaging wind over 30 yrs
- Air quality 4/10 Moderate 5 unhealthy d/yr today · 7 by 30 yrs out
Nearby sold comps map
Loading sold comps map…
Walkable amenities ~0.75 mi
Loading nearby amenities…
Taxation est. · year 1
- Rental income
- $18,512
- − Mortgage interest
- −$5,974
- − Property taxes
- −$698
- − Insurance
- −$533
- − Repairs & maintenance
- −$1,481
- − Management
- −$1,481
- − Depreciation
- −$3,103
- Taxable income
- $5,242
- Est. tax owed @ 24.0%
- −$1,258
- After-tax cash flow
- $5,424/yr
For passive investors: Depreciation is non-cash, so a rental often shows a tax loss while cash-flowing — sheltering income. Rental losses are passive: they offset passive income freely, and up to $25,000/yr can offset ordinary (W-2) income if you actively participate and your MAGI is under $100k (phasing out to $0 by $150k); unused losses carry forward. On sale, claimed depreciation is recaptured at up to 25%, and gains may owe capital-gains tax (a 1031 exchange can defer both). Figures are a year-1 estimate at your 24.0% rate — not tax advice; consult a CPA.
Schools (NCES district)
- District
- Baltimore City Public Schools
- NCES district ID
- 2400090
- Math proficiency
- 7% ▼ -9.00%
- Reading proficiency
- 16% ▼ -5.00%
- Median HH income
- $42,108
- Composite
- 10.08/100
- National rank
- #9805
- State rank
- #24 of 24 in MD
Livability — Baltimore
- Score
- 76/100
- State rank
- #90
- US rank
- #3396
Category grades
Schools grade is shown separately in the Schools card above.
Census & demographics
- Census place
- Baltimore, MD
- City population
- 588,727
- Population (ZIP)
- 6,593
Population outlook (Baltimore County) Hauer SSP2
- Today (2025)
- 624,249 people
- By 2030
- 621,541 · -0.4%
- By 2040
- 609,756 · -2.3%
- By 2050
- 597,249 · -4.3%
- By 2075
- 552,236 · -11.5%
- By 2100
- 513,934 · -17.7%
Race, ethnicity, and origin ACS 2023
- Neighborhood character
- Diverse neighborhood (Simpson 0.61)
- Race & ethnicity
- White 59% Black 18% Two or more races 13% Hispanic / Latino 8% Asian 4%
- Hispanic origin (detail)
- Mexican 4% Puerto Rican 3%
- Common ancestry
- Slovak 7% Romanian 2% Scotch-Irish 1%
- Foreign-born
- 7% · Canada, Jamaica
- Languages at home
- 91% English-only · Spanish 7% Tagalog/Filipino 1% Other Indo-European 1%
Political lean MEDSL · Baltimore
- 2024 margin
- Solid D (+73.0) · D 85.2% · R 12.2% · Other 2.6%
- 2008→2024 swing
- -2.5pp toward R · 2008: 75.5pp · 2024: 73.0pp
- All cycles
- 2024: D+73.0 2020: D+76.6 2016: D+74.6 2012: D+76.4 2008: D+75.5
Not yet ingested
- Civics
- —
Market trends
- HPI YoY
- ▲ 7.75%
- Current HPI
- 318.79
- Rent YoY
- —
- Metro
- —
- State GDP YoY
- ▲ 2.97%
- F500 in state
- 12
Industry mix (Fortune 500 HQ in MD)
| Industry | F500 HQs | Revenue |
|---|---|---|
| Aerospace / Defense | 1 | $71B |
|
||
| Utilities | 1 | $25B |
|
||
| Hotels | 1 | $24B |
|
||
| Consumer Goods | 1 | $7B |
|
||
| Real Estate | 1 | $6B |
|
||
| Chemicals | 1 | $2B |
|
||
Price history
+20.0% since first listed4 events — show timeline
- 2026-06-09 Sold (MLS) $30,000 BRIGHT MLS
- 2026-05-19 Pending — BRIGHT MLS
- 2026-04-30 Listed $25,000 BRIGHT MLS
- 2026-04-29 Coming Soon $25,000 BRIGHT MLS
Property tax history
-6.1%/yrLatest (2025): $698 · +5.8% YoY. Source: county tax records.
Cash-flow waterfall
monthlySold comps — $/sqft
last 12 mo · ≤1 miLoading sold comps…