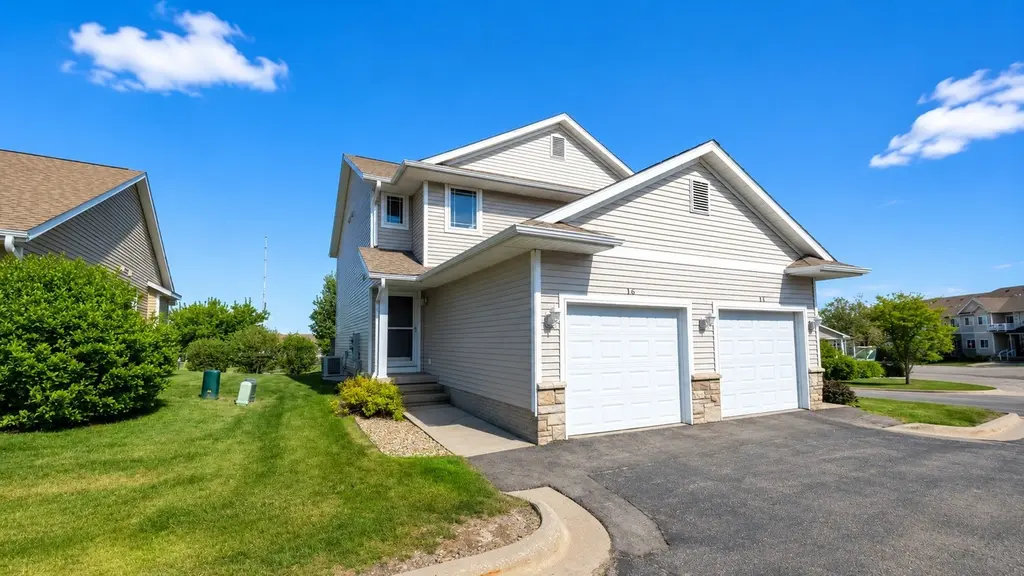
1450 Tower Ln NE · Cedar Rapids, IA
Flood risk 1/10 · Minimal
- FEMA flood zone
- X (unshaded)
- Chance of flooding over 30 yrs
- 0.0%
- Est. flood insurance / yr
- $473 – $860
Fire risk 3/10 · Minor
- Est. fire insurance / yr
- $902 – $1,676
Heat risk 3/10 · Minor
- Hot days now (above 103°F)
- 7 days/yr
- Hot days in 30 yrs
- 15 days/yr
Wind risk 2/10 · Minimal
- Chance of severe wind over 30 yrs
- —
Air-quality risk 2/10 · Minimal
- Unhealthy air days now
- 0 days/yr
- Unhealthy air days in 30 yrs
- 1 days/yr
Risk factors via First Street. Map © Google.
Why this score? — see what drove the D grade
The composite is a weighted blend of 9 inputs, each scored 0–100. Each bar is that input's sub-score; the figure is the points it added to the 100-point composite (weight × sub-score).
- ARV discount +14.9/15.0
- Schools +6.6/10.0
- Cash flow +6.5/30.0
- Rent growth +5.0/5.0
- Livability +3.9/5.0
- 1% rule +3.3/10.0
- Condition / age +2.5/5.0
- DSCR +0.8/10.0
- Appreciation +0.0/10.0
$175,000
🖨 Deal sheet (PDF) 📄 Offer letter ✓ Due diligence
Listing remarks MLS
Easy living meets a convenient Cedar Rapids location in this move-in ready two-story condo within the Linn-Mar School District. Located just off Council Street NE with quick access to I-380, you are minutes from Hy-Vee, Target, shopping, and everyday conveniences. The main level offers an open and functional layout with a bright living area, breakfast bar, stainless steel appliances, and sliding glass doors leading to a private deck overlooking green common space. Upstairs features two spacious bedrooms, a full Jack-and-Jill bathroom with double vanity, and laundry conveniently located near the bedrooms. The finished lower level adds 313 square feet of flexible space perfect for a family room, office, or workout area. Complete with a one-car attached garage, pet-friendly policies, and a $200/month HOA that covers lawn care and snow removal, this condo offers comfortable, low-maintenance living.
Key facts
- Flexible space
- Private back deck
- Two story condo
Tags
Neighborhood map
What this means for you Summary
Snapshot
- This is a 2-bed/1.5-bath condo listed at $175k.
Deal economics
- At list price, monthly cash flow is $-296 ($-4k/yr) — negative.
- To cash-flow at today's rent, offer at most $123k (29.9% below list).
- To meet the 1% rule (rent ≥ 1% of price), the offer needs to be $144k (17.5% below list).
- Recommended offer: $123k (29.9% below list) — sets the bar for cash-flow.
- Cap rate 4.3% vs local median 3.5% in Cedar Rapids — meaningfully above typical; check what's discounted (condition, days-on-market, listing class) to confirm the premium yield is real.
Location & tenants
- Location reads 78/100 on livability (#134 in IA, #2,474 nationally) — a middle-class / working-renter tenant base. Strengths: cost of living A+, housing A+, health & safety A+; Watch: crime C-, commute F.
- Linn-Mar Community School District (suburban): math 75% / reading 76% proficiency, ranked #44 of 289 in IA (top 15%) — strong family-tenant draw, lease renewals of 3-5y typical; only 16% free/reduced lunch — higher-income household profile.
- Market conditions: Rents rising fast (+11.0%/yr); 286 active listings in the ZIP; 4 comparable units currently listed for rent nearby; rentals lingering (median 45d on market — plan ~5-8 weeks vacancy on turnover, expect pricing pressure); 50% of comp listings sitting > 30 days — soft ceiling on asking rent; 1,023 units permitted in Linn County in 2024 (456 in 5+ unit buildings).
Forward outlook
- Local home prices are declining (-3.0%/yr); year-one equity from $1k of loan paydown is wiped out by about $5k of value loss. Plan a longer hold.
- Linn County population projected at +16% by 2050 — long-run rental-demand tailwind backs the buy-and-hold thesis.
Negotiation context
- It's been on market 51 days — a 3% lower offer ($170k) is reasonable based on typical stale-listing flexibility.
- 2 sale attempts with the ask held roughly flat each time — persistent listings suggest the price (not the market) is what's stuck; bring a comps-based counter.
Questions for the listing agent
- What do current leases actually rent for vs. the listed asking? Can we see a recent rent roll and the last 12 months of T-12 income?
- It's been on market 51 days. Have you received any prior offers? Is the seller open to a 30% concession, seller financing, or rate buy-down credit?
- What does the HOA fee cover, when was the last increase, and are there any pending special assessments or reserve-fund shortfalls?
- Any open or pending special assessments — roof, HVAC, plumbing, elevator, façade? What's the per-unit balance and payoff schedule, and is the seller paying it off at close or rolling it to the buyer?
- Is there a deadline driving the sale (1031 exchange, divorce, estate, relocation)? That informs how much negotiation room exists.
- Schools are B-rated — typically a magnet for longer-tenancy family renters. What's the average tenant stay here, and is there a school-zone premium baked into asking?
- The area grade is low — what's the realistic commute time and amenity access for the typical tenant pool here? Any planned neighborhood developments (good or bad) we should know about?
- What's the average days-on-market for RENTAL listings here right now (not sales)? A rising rental-DOM trend means longer vacancies and softer asking-rent achievability than the comps imply.
- What's the recent tenant-quality profile in this submarket — average credit score on applications, eviction rate, late-payment / NSF rate, and stable-employment percentage? A property-management company in the area should have these aggregated.
- How much new apartment / multifamily construction is in the pipeline within 1–3 miles? Heavy new supply (>2% of stock underway) typically softens rents 12–24 months out; light construction supports rent growth.
Investment metrics
- 1% rule
- 0.83% ✗
- Cap rate
- 4.26%
- Cash-on-cash
- -7.25%
- DSCR
- 0.68
- GRM
- 10.1
CMA / ARV
- ARV (median comp)
- $209,409
- List price
- $175,000
- Delta
- -16.43%
- Verdict
- UNDERPRICED
- Comps
- 20 within 1.0 mi
Projected returns pro-forma
-3.0% appreciation · 8.0% rent growth · sell at horizon
- IRR
- -22.2%
- Equity multiple
- 0.20×
- Total profit
- $-39,412
- Equity at exit
- $26,093
- IRR
- -5.9%
- Equity multiple
- 0.53×
- Total profit
- $-23,189
- Equity at exit
- $15,131
Cash invested: $49,000 (down + closing). Projections, not guarantees.
Landlord ↔ Tenant lean methodology
- Overall (STATE)
- 83 Strongly Landlord-Friendly
- State Iowa
- 83 Strongly Landlord-Friendly · R+6
- County
- — inherits STATE
- City
- — inherits STATE
ZIP-level market 52402
- Rents YoY
- 11.0%
- Active inventory
- 286
- Price-to-rent
- 10.1×
Monthly cashflow live
- Estimated rent
- $1,445 medium interval (Pro) →
- Mortgage (P&I)
- −$918
- Tax from tax record
- −$246 /mo · $2,958/yr
- Insurance
- −$73
- HOA
- −$200
- Vacancy / Maint / Mgmt
- −$303
- Net cashflow
- $-296
Break-even live
Sensitivity live
| Price | -10% $-197 | -5% $-246 | +0% $-296 | +5% $-345 | +10% $-395 |
|---|---|---|---|---|---|
| Rent | -10% $-410 | -5% $-353 | +0% $-296 | +5% $-239 | +10% $-182 |
| Rate | -1.0pp $-208 | -0.5pp $-251 | base $-296 | +0.5pp $-341 | +1.0pp $-387 |
UW: 25.0% down · 7.5% · 30yr · 1.5% tax · 5.0% vac · 8.0% maint · 8.0% mgmt
Financing live
Cash to close
- Down payment
- $43,750
- Closing costs
- $5,250
- Reserves months
- —
- Total cash needed
- —
Loan-product check · same deal, 3 products live
Conventional
25% down · 7.5% · 30yr
- Down + closing
- —
- Monthly P&I
- —
- Monthly cashflow
- —
- DSCR
- —
- Eligible?
- —
Personal DTI + credit; lowest rate.
DSCR
20% down · 8.5% · 30yr
- Down + closing
- —
- Monthly P&I
- —
- Monthly cashflow
- —
- DSCR
- —
- Eligible?
- —
No personal income docs; deal must DSCR.
Hard money
10% down · 12.0% · 12mo
- Down + closing
- —
- Monthly P&I
- —
- Monthly cashflow
- —
- DSCR
- —
- Eligible?
- —
Short-term bridge; refi at stabilization.
Rent comps 4 comps
| Address | Beds | Baths | Sqft | Rent | $/sqft | DOM | Units | Dist |
|---|---|---|---|---|---|---|---|---|
| 663 Boyson Rd NE Cedar Rapids, IA | 3.0 | 2.0 | 1344 | $1,765 | $1.31 | 14d | 1 | 0.68mi |
| 150015061524 Petrus Dr NE Cedar Rapids, IA | 2.0 | 1.0–2.0 | 1108 | $1,948 | $1.76 | 14d | 2 | 0.81mi |
| 62 Northwood Dr Unit 4 Hiawatha, IA | 2.0 | 1.0 | 800 | $750 | $0.94 | 44d | 1 | 0.96mi |
| 4521 Rushmore Dr NE Unit D Cedar Rapids, IA | 2.0 | 1.5 | 700 | $895 | $1.28 | 44d | 1 | 1.49mi |
HOA detail condo
- Monthly dues
- $200 · $2,400/yr
- Likely covers
- landscapingsnow removal
- Assessments
- None detected in remarks — confirm with the listing agent.
Listing history 4 events
-
2026-05-30status $175,000 Pending 51 DOM
-
2026-04-16price $175,000 907-char remark
Show marketing remark (907 chars)
Easy living meets a convenient Cedar Rapids location in this move-in ready two-story condo within the Linn-Mar School District. Located just off Council Street NE with quick access to I-380, you are minutes from Hy-Vee, Target, shopping, and everyday conveniences. The main level offers an open and functional layout with a bright living area, breakfast bar, stainless steel appliances, and sliding glass doors leading to a private deck overlooking green common space. Upstairs features two spacious bedrooms, a full Jack-and-Jill bathroom with double vanity, and laundry conveniently located near the bedrooms. The finished lower level adds 313 square feet of flexible space perfect for a family room, office, or workout area. Complete with a one-car attached garage, pet-friendly policies, and a $200/month HOA that covers lawn care and snow removal, this condo offers comfortable, low-maintenance living.
-
2026-04-08$179,999 Active 907-char remark
Show marketing remark (907 chars)
Easy living meets a convenient Cedar Rapids location in this move-in ready two-story condo within the Linn-Mar School District. Located just off Council Street NE with quick access to I-380, you are minutes from Hy-Vee, Target, shopping, and everyday conveniences. The main level offers an open and functional layout with a bright living area, breakfast bar, stainless steel appliances, and sliding glass doors leading to a private deck overlooking green common space. Upstairs features two spacious bedrooms, a full Jack-and-Jill bathroom with double vanity, and laundry conveniently located near the bedrooms. The finished lower level adds 313 square feet of flexible space perfect for a family room, office, or workout area. Complete with a one-car attached garage, pet-friendly policies, and a $200/month HOA that covers lawn care and snow removal, this condo offers comfortable, low-maintenance living.
-
2025-06-09$210,000 Active
ⓘ Source: listings_history table (triggers on properties + properties_extension) + one-shot
backfill from property_details.listing_events for pre-trigger history.
Tax reassessment forecast IA · Partial reset (capped growth)
- Current annual tax
- $2,958 · $246/mo
- Projected year-2 tax
- $2,958 · $246/mo
- Expected delta
- $0/yr ($0/mo · 0.0%)
ⓘ Screening estimate from a state-policy table — verify with the county assessor before closing.
Climate risk First Street
- Flood 1/10 Low FEMA zone X (unshaded) · 0% chance over 30 yrs
- Wildfire 3/10 Moderate
- Heat 3/10 Moderate 7 d/yr ≥103°F today · 15 d/yr by 30 yrs out
- Wind 2/10 Low
- Air quality 2/10 Low 0 unhealthy d/yr today · 1 by 30 yrs out
Nearby sold comps map
Loading sold comps map…
Walkable amenities ~0.75 mi
Loading nearby amenities…
Taxation est. · year 1
- Rental income
- $17,334
- − Mortgage interest
- −$9,803
- − Property taxes
- −$2,958
- − Insurance
- −$875
- − Repairs & maintenance
- −$1,387
- − Management
- −$1,387
- − HOA
- −$2,400
- − Depreciation
- −$5,091
- Taxable loss
- −$6,566
- Est. tax savings @ 24.0%
- +$1,576
- After-tax cash flow
- $-1,976/yr
For passive investors: Depreciation is non-cash, so a rental often shows a tax loss while cash-flowing — sheltering income. Rental losses are passive: they offset passive income freely, and up to $25,000/yr can offset ordinary (W-2) income if you actively participate and your MAGI is under $100k (phasing out to $0 by $150k); unused losses carry forward. On sale, claimed depreciation is recaptured at up to 25%, and gains may owe capital-gains tax (a 1031 exchange can defer both). Figures are a year-1 estimate at your 24.0% rate — not tax advice; consult a CPA.
Schools (NCES district)
- District
- Linn-Mar Community School District
- NCES district ID
- 1917220
- Math proficiency
- 75% ▼ -7.00%
- Reading proficiency
- 76% ▼ -5.00%
- Median HH income
- $72,473
- Composite
- 66.08/100
- National rank
- #440
- State rank
- #44 of 289 in IA
Livability — Cedar Rapids
- Score
- 78/100
- State rank
- #134
- US rank
- #2474
Category grades
Schools grade is shown separately in the Schools card above.
Census & demographics
- Census place
- Cedar Rapids, IA
- County
- Linn County · 179,860 people
- City population
- 137,154
- Metro
- Cedar Rapids, IA
- Population (ZIP)
- 42,938
- Household income
- $73,439
- Rent vs Own
- Severe rent burden
- 971.0
Population outlook (Linn County) Hauer SSP2
- Today (2025)
- 239,589 people
- By 2030
- 248,587 · +3.8%
- By 2040
- 264,817 · +10.5%
- By 2050
- 278,685 · +16.3%
- By 2075
- 311,754 · +30.1%
- By 2100
- 336,773 · +40.6%
Race, ethnicity, and origin ACS 2023
- Neighborhood character
- Predominantly White (77%)
- Race & ethnicity
- White 77% Two or more races 7% Black 6% Asian 6% Hispanic / Latino 4%
- Common ancestry
- Portuguese 4% Lithuanian 2% Iranian 2%
- Foreign-born
- 8% · Canada, Philippines, China
- Languages at home
- 89% English-only · Spanish 3% Other Indo-European 3% Other Asian/Pacific 2%
Political lean MEDSL · Linn
- 2024 margin
- Lean D (+9.9) · D 54.2% · R 44.3% · Other 1.4%
- 2008→2024 swing
- -11.6pp toward R · 2008: 21.5pp · 2024: 9.9pp
- All cycles
- 2024: D+9.9 2020: D+13.7 2016: D+9.0 2012: D+17.6 2008: D+21.5
Not yet ingested
- Civics
- —
Market trends
- HPI YoY
- ▼ -133.31%
- Current HPI
- 201.7061
- Rent YoY
- ▲ 10.97%
- Metro
- Cedar Rapids, IA
- State GDP YoY
- ▲ 2.48%
- F500 in state
- 4
Industry mix (Fortune 500 HQ in IA)
| Industry | F500 HQs | Revenue |
|---|---|---|
| Financial Services | 1 | $16B |
|
||
| Retail / Convenience | 1 | $15B |
|
||
Price history
-16.7% since first listed3 events — show timeline
- 2026-04-16 Price Changed $175,000 CRAAR, CDRMLS
- 2026-04-08 Listed $179,999 CRAAR, CDRMLS
- 2025-06-09 Listed $210,000 ICAARMLS
Property tax history
+2.1%/yrLatest (2025): $2,958 · +10.1% YoY. Source: county tax records.
Cash-flow waterfall
monthlySold comps — $/sqft
last 12 mo · ≤1 miLoading sold comps…