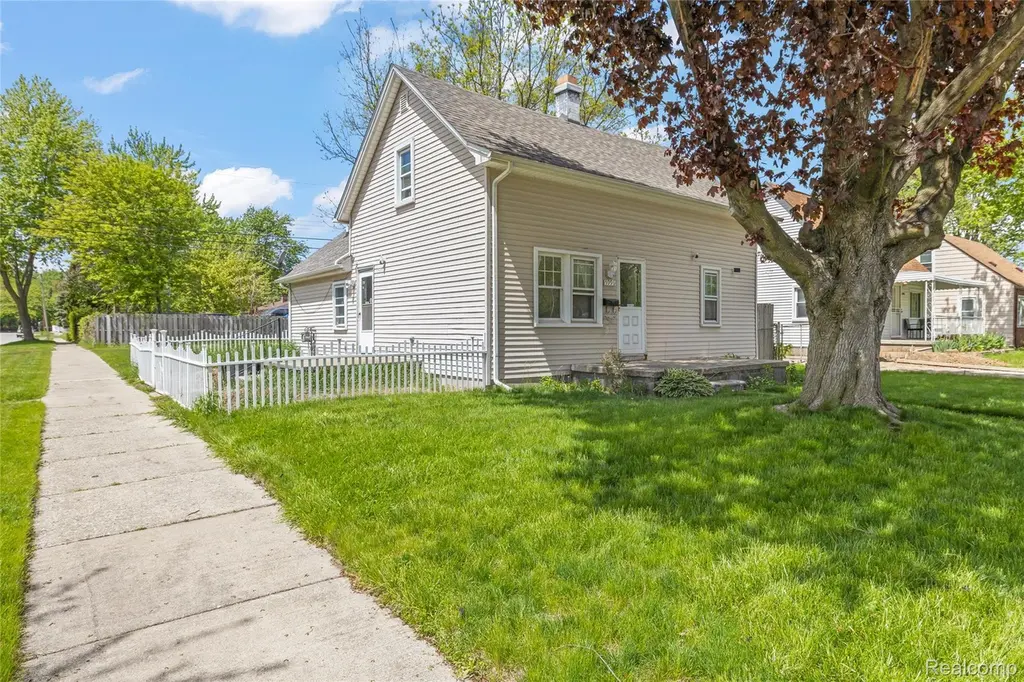
5996 Princess St · Taylor, MI
Flood risk 1/10 · Minimal
- FEMA flood zone
- X (unshaded)
- Chance of flooding over 30 yrs
- 0.0%
- Est. flood insurance / yr
- $507 – $1,088
Fire risk 1/10 · Minimal
- Est. fire insurance / yr
- $784 – $1,456
Heat risk 3/10 · Minor
- Hot days now (above 98°F)
- 7 days/yr
- Hot days in 30 yrs
- 15 days/yr
Wind risk 2/10 · Minimal
- Chance of severe wind over 30 yrs
- —
Air-quality risk 2/10 · Minimal
- Unhealthy air days now
- 1 days/yr
- Unhealthy air days in 30 yrs
- 2 days/yr
Risk factors via First Street. Map © Google.
Why this score? — see what drove the C grade
The composite is a weighted blend of 9 inputs, each scored 0–100. Each bar is that input's sub-score; the figure is the points it added to the 100-point composite (weight × sub-score).
- Cash flow +19.3/30.0
- ARV discount +14.8/15.0
- DSCR +6.1/10.0
- 1% rule +5.9/10.0
- Livability +3.8/5.0
- Rent growth +3.7/5.0
- Condition / age +2.5/5.0
- Schools +1.8/10.0
- Appreciation +0.0/10.0
$129,900
🖨 Deal sheet 📄 Offer letter ✓ Due diligence
Listing remarks MLS
COME IN AND TAKE A PEEK, THIS COULD BE YOUR NEXT HOME!! NOW AVAILABLE!! 3-bedroom 1 bath colonial home. Large open space from living room to kitchen, makes great for entertaining space. Large eat-in kitchen. All 3 bedrooms are large with big closets, convenient for storage, bathroom features a jetted tub. Exterior features: new roof * 2021, large front porch; yard has a small picket fence area off the back door. This home sit on a corner lot in a small neighborhood with a large park and community pool. The middle school is in walking distance. Home needs some TLC and is sold AS-IS. BATVAI, Sellers are MOTIVATED, all measurements are estimated. Licensed Realtor with the state of Michigan must be present for all showings. FHA & VA will be accepted at no cost to the seller. Excluded from the sale of the property are the motion censored security cameras.
Key facts
- Large eat-in kitchen
- Large front porch
- Community pool
Tags
Property features AI
Exterior
- Parking: No garage; Parking pad
- Utilities: Public water; Public sewer
- Home design: Two levels; Ground-level entry with steps; Single-family residence; Vinyl siding
- Construction: Asphalt roof; Block foundation; Vinyl siding construction
- Exterior features: Paved road access; Lot roughly 47 x 130 (0.14 acre)
Interior
- Bathrooms: One full bathroom
- Heating & cooling: Forced air heating (natural gas); Ceiling fan(s); No central cooling
- Interior features: Electric water heater; Crawl space basement; Six total rooms
Neighborhood map
What this means for you Summary
Snapshot
- This is a 3-bed/1.0-bath single-family listed at $130k.
Deal economics
- At list price, monthly cash flow is $144 ($2k/yr) — positive.
- The deal already cash-flows at list — no discount required.
- Meets the 1% rule at list price ($1k rent vs $130k).
- Recommended offer: $128k (1.5% below list) — sets the bar for market timing.
- Cap rate 7.6% vs local median 5.4% in Taylor — top-decile yield for the area; either an underpriced asset or a hidden risk that comps aren't pricing in. Stress-test before assuming the spread holds.
Location & tenants
- Location reads 76/100 on livability (#144 in MI, #3,684 nationally) — a middle-class / working-renter tenant base. Strengths: commute A+, cost of living A+, housing A+; Watch: employment D+, schools F, crime F.
- Taylor School District (urban): math 14% / reading 27% proficiency, ranked #462 of 540 in MI (top 86%) — low school quality limits family demand, transient renter base, plan for 1-2y turnover; 68% free/reduced lunch — lower-income household profile, screen leases tightly.
- Market conditions: Rents rising fast (+4.9%/yr); 281 active listings in the ZIP; 16 comparable units currently listed for rent nearby; rentals at typical pace (median 17d on market — plan ~3-4 weeks tenant-placement turnaround); 2,639 units permitted in Wayne County in 2024 (1,216 in 5+ unit buildings).
Forward outlook
- Local home prices are declining (-3.0%/yr); year-one equity from $898 of loan paydown is wiped out by about $4k of value loss. Plan a longer hold.
- Wayne County population projected at -17% by 2050 — secular population decline; favor cash flow + early exit over multi-decade hold.
Negotiation context
- It's been on market 26 days — a 2% lower offer ($128k) is reasonable based on typical stale-listing flexibility.
- 17 sale attempts since 28y ago; this cycle's ask has dropped $10k (7%) from the opening price — seller is motivated, your offer sets the floor, not the list.
- Current owner paid $96k; 35% above their basis — modest negotiation headroom, anchor on the comps not their cost.
Risks & watch-outs
- Watch-outs: built in 1910 — expect roof / HVAC / electrical / plumbing capex.
Questions for the listing agent
- Built in 1910 — when were the roof, HVAC, electrical panel, plumbing, and water heater last replaced?
- Is there a deadline driving the sale (1031 exchange, divorce, estate, relocation)? That informs how much negotiation room exists.
- Schools are F-rated, which usually means shorter tenancies and higher turnover. Who's the typical renter profile here, and what's been the actual vacancy rate?
- Crime grade is F in this area — have there been break-ins, vandalism, or insurance claims at this property in the last 3 years? What carrier currently insures it and at what premium?
- What's the average days-on-market for RENTAL listings here right now (not sales)? A rising rental-DOM trend means longer vacancies and softer asking-rent achievability than the comps imply.
- What's the recent tenant-quality profile in this submarket — average credit score on applications, eviction rate, late-payment / NSF rate, and stable-employment percentage? A property-management company in the area should have these aggregated.
- How much new for-sale + rental construction is in the pipeline within 1–3 miles? Heavy new supply typically softens prices + rents 12–24 months out; constrained supply supports both.
Investment metrics
- 1% rule
- 1.09% ✓
- Cap rate
- 7.62%
- Cash-on-cash
- 4.74%
- DSCR
- 1.21
- GRM
- 7.6
CMA / ARV
- ARV (median comp)
- $155,192
- List price
- $129,900
- Delta
- -16.30%
- Verdict
- UNDERPRICED
- Comps
- 20 within 1.0 mi
Show comp detail 12 sales within ~0.75 mi
| Address | Dist | Beds/Ba | Sqft | Sold | Price | $/sf | Match |
|---|---|---|---|---|---|---|---|
| 27059 Jeannette Ct | 0.18mi | 3/1.0 | 1,020 (-4%) | 1mo | $112,500 | $110 | 84 |
| 27050 Debra Ct | 0.19mi | 3/1.0 | 1,020 (-4%) | 1mo | $105,000 | $103 | 84 |
| 27051 Joan St | 0.25mi | 3/1.0 | 1,020 (-4%) | 2mo | $152,500 | $150 | 80 |
| 6155 Princess St | 0.14mi | 4/1.0 (+1) | 1,123 (+6%) | 2mo | $179,900 | $160 | 78 |
| 27029 Michelle Ct | 0.28mi | 3/1.0 | 1,020 (-4%) | 3mo | $152,500 | $150 | 78 |
| 6330 Hampden St | 0.29mi | 3/1.0 | 1,008 (-5%) | 2mo | $149,900 | $149 | 76 |
| 6039 Sylvia St | 0.11mi | 3/1.0 | 932 (-12%) | 0mo | $150,000 | $161 | 74 |
| 26396 Pennie St | 0.53mi | 2/1.0 (-1) | 1,080 (+2%) | 2mo | $95,000 | $88 | 66 |
| 6304 Marvin St | 0.53mi | 3/1.0 | 1,008 (-5%) | 2mo | $95,000 | $94 | 65 |
| 5969 Fellrath St | 0.46mi | 2/1.0 (-1) | 1,000 (-6%) | 0mo | $125,000 | $125 | 63 |
| 26333 Eton Ave | 0.57mi | 3/1.0 | 1,000 (-6%) | 1mo | $95,000 | $95 | 62 |
| 26700 Hopkins St | 0.73mi | 3/1.0 | 1,110 (+4%) | 0mo | $120,000 | $108 | 58 |
Match score weights: distance 35% · size 25% · config 20% · recency 20%. Top-matched comps best support the ARV.
Projected returns pro-forma
-3.0% appreciation · 4.9% rent growth · sell at horizon
- IRR
- -6.6%
- Equity multiple
- 0.75×
- Total profit
- $-9,070
- Equity at exit
- $19,369
- IRR
- 5.4%
- Equity multiple
- 1.44×
- Total profit
- $15,960
- Equity at exit
- $11,231
Cash invested: $36,372 (down + closing). Projections, not guarantees.
Landlord ↔ Tenant lean methodology
- Overall (STATE)
- 62 Landlord-Friendly
- State Michigan
- 62 Landlord-Friendly · EVEN
- County
- — inherits STATE
- City
- — inherits STATE
ZIP-level market 48180
- Rents YoY
- 4.9%
- Active inventory
- 281
- Price-to-rent
- 7.6×
Monthly cashflow live
- Estimated rent
- $1,420 high interval (Pro) →
- Mortgage (P&I)
- −$681
- Tax from tax record
- −$243 /mo · $2,912/yr
- Insurance
- −$54
- HOA
- −$0
- Vacancy / Maint / Mgmt
- −$298
- Net cashflow
- $144
Break-even live
UW: 25.0% down · 7.5% · 30yr · 1.5% tax · 5.0% vac · 8.0% maint · 8.0% mgmt
Financing live
Cash to close
- Down payment
- $32,475
- Closing costs
- $3,897
- Reserves months
- —
- Total cash needed
- —
Loan-product check · same deal, 3 products live
Conventional
25% down · 7.5% · 30yr
- Down + closing
- —
- Monthly P&I
- —
- Monthly cashflow
- —
- DSCR
- —
- Eligible?
- —
Personal DTI + credit; lowest rate.
DSCR
20% down · 8.5% · 30yr
- Down + closing
- —
- Monthly P&I
- —
- Monthly cashflow
- —
- DSCR
- —
- Eligible?
- —
No personal income docs; deal must DSCR.
Hard money
10% down · 12.0% · 12mo
- Down + closing
- —
- Monthly P&I
- —
- Monthly cashflow
- —
- DSCR
- —
- Eligible?
- —
Short-term bridge; refi at stabilization.
Rent comps 16 comps
| Address | Beds | Baths | Sqft | Rent | $/sqft | DOM | Units | Dist |
|---|---|---|---|---|---|---|---|---|
| 26274 McDonald St Dearborn Heights, MI | 3.0 | 1.0 | 1365 | $1,575 | $1.15 | 1d | 1 | 0.69mi |
| 26089 Lehigh St Inkster, MI | 2.0 | 1.0 | 900 | $1,295 | $1.44 | 17d | 1 | 0.91mi |
| 26159 Stanford St Inkster, MI | 4.0 | 1.0 | 1056 | $1,350 | $1.28 | 4d | 1 | 0.93mi |
| 26382 Colgate St Inkster, MI | 2.0 | 1.0 | 850 | $935 | $1.10 | 24d | 1 | 1.00mi |
| 4301 Harriet St Unit A-1 Inkster, MI | 2.0 | 1.5 | 1000 | $1,300 | $1.30 | 43d | 1 | 1.21mi |
| 26707 Penn St Inkster, MI | 3.0 | 1.0 | 900 | $1,400 | $1.56 | 4d | 1 | 1.28mi |
| 4167 Isabelle St Inkster, MI | 2.0 | 1.0 | 900 | $1,295 | $1.44 | 17d | 1 | 1.28mi |
| 27139 Penn St Inkster, MI | 3.0 | 1.0 | 832 | $675 | $0.81 | 17d | 1 | 1.29mi |
| 26742 Penn St Inkster, MI | 3.0 | 1.0 | 1000 | $1,300 | $1.30 | 16d | 1 | 1.31mi |
| 4080 Isabelle St Inkster, MI | 4.0 | 1.0 | 975 | $1,150 | $1.18 | 14d | 1 | 1.34mi |
| 25722 Carlysle St Dearborn Heights, MI | 3.0 | 1.0 | 1040 | $1,450 | $1.39 | 17d | 1 | 1.37mi |
| 25016 Lehigh St Dearborn Heights, MI | 2.0 | 1.0 | 1000 | $1,400 | $1.40 | 4d | 1 | 1.38mi |
| 3755 Heritage Pkwy Dearborn, MI | 2.0 | 1.0 | 830 | $1,450 | $1.75 | 43d | 1 | 1.41mi |
| 3809 Heritage Pkwy Dearborn, MI | 2.0 | 1.5 | 1035 | $1,400 | $1.35 | 43d | 1 | 1.45mi |
| 3763 Heritage Pkwy Dearborn, MI | 2.0 | 1.5 | 1035 | $1,450 | $1.40 | 43d | 1 | 1.45mi |
| 24684 Lehigh St Dearborn Heights, MI | 4.0 | 1.0 | 878 | $1,600 | $1.82 | 12d | 1 | 1.48mi |
Listing history 44 events
-
2026-06-08statusdays on market $129,900 Pending 26 DOM
Show marketing remark (869 chars)
COME IN AND TAKE A PEEK, THIS COULD BE YOUR NEXT HOME!! NOW AVAILABLE!! 3-bedroom 1 bath colonial home. Large open space from living room to kitchen, makes great for entertaining space. Large eat-in kitchen. All 3 bedrooms are large with big closets, convenient for storage, bathroom features a jetted tub. Exterior features: new roof * 2021, large front porch; yard has a small picket fence area off the back door. This home sit on a corner lot in a small neighborhood with a large park and community pool. The middle school is in walking distance. Home needs some TLC and is sold AS-IS. BATVAI, Sellers are MOTIVATED, all measurements are estimated. Licensed Realtor with the state of Michigan must be present for all showings. FHA & VA will be accepted at no cost to the seller. Excluded from the sale of the property are the motion censored security cameras.
-
2026-06-07days on market $129,900 Active 25 DOM
-
2026-06-04days on market $129,900 Active 22 DOM
-
2026-06-03days on market $129,900 Active 21 DOM
-
2026-06-02days on market $129,900 Active 20 DOM
-
2026-06-01days on market $129,900 Active 19 DOM
-
2026-05-31days on market $129,900 Active 18 DOM
-
2026-05-13$139,900 Active 790-char remark
Show marketing remark (869 chars)
COME IN AND TAKE A PEEK, THIS COULD BE YOUR NEXT HOME!! NOW AVAILABLE!! 3-bedroom 1 bath colonial home. Large open space from living room to kitchen, makes great for entertaining space. Large eat-in kitchen. All 3 bedrooms are large with big closets, convenient for storage, bathroom features a jetted tub. Exterior features: new roof * 2021, large front porch; yard has a small picket fence area off the back door. This home sit on a corner lot in a small neighborhood with a large park and community pool. The middle school is in walking distance. Home needs some TLC and is sold AS-IS. BATVAI, Sellers are MOTIVATED, all measurements are estimated. Licensed Realtor with the state of Michigan must be present for all showings. FHA & VA will be accepted at no cost to the seller. Excluded from the sale of the property are the motion censored security cameras.
-
2017-03-07historical
-
2017-03-07historical
-
2017-03-07historical
-
2017-03-07historical
-
2017-02-17$44,900 Active
-
2017-02-17price $44,900
-
2017-02-16historical
-
2017-02-16$44,900 Active
-
2017-02-16historical
-
2017-01-03$49,900 Active
-
2017-01-03$44,900
-
2016-12-29$49,900 Active
-
2016-12-29$49,900 Active
-
2007-02-09historical
-
2005-12-30$72,800
-
2005-12-06historical
-
2005-06-06$109,000
-
2005-06-06$109,000
-
2003-11-17soldstatus $96,365
-
2003-08-20soldstatus $96,365
-
2003-08-20soldstatus $96,365
-
2003-08-20soldstatus $96,365
-
2003-07-14historical
-
2003-04-30$99,900
-
2003-04-21$99,900
-
2003-04-21$99,900
-
1999-06-15soldstatus $68,500
-
1999-04-28soldstatus $68,500
-
1999-04-28soldstatus $68,500
-
1999-01-27$69,900
-
1999-01-27$69,900
-
1999-01-27historical
-
1998-09-18$69,900
-
1996-07-17soldstatus $44,000
-
1994-09-30soldstatus $20,000
ⓘ Source: listings_history table (triggers on properties + properties_extension) + one-shot
backfill from property_details.listing_events for pre-trigger history.
Tax reassessment forecast MI · Partial reset (capped growth)
- Current annual tax
- $2,912 · $243/mo
- Projected year-2 tax
- $2,912 · $243/mo
- Expected delta
- $0/yr ($0/mo · 0.0%)
ⓘ Screening estimate from a state-policy table — verify with the county assessor before closing.
Climate risk First Street
- Flood 1/10 Low FEMA zone X (unshaded) · 0% chance over 30 yrs
- Wildfire 1/10 Low
- Heat 3/10 Moderate 7 d/yr ≥98°F today · 15 d/yr by 30 yrs out
- Wind 2/10 Low
- Air quality 2/10 Low 1 unhealthy d/yr today · 2 by 30 yrs out
Nearby sold comps map
Loading sold comps map…
Walkable amenities ~0.75 mi
Loading nearby amenities…
Taxation est. · year 1
- Rental income
- $17,036
- − Mortgage interest
- −$7,276
- − Property taxes
- −$2,912
- − Insurance
- −$650
- − Repairs & maintenance
- −$1,363
- − Management
- −$1,363
- − Depreciation
- −$3,779
- Taxable loss
- −$306
- Est. tax savings @ 24.0%
- +$74
- After-tax cash flow
- $1,796/yr
For passive investors: Depreciation is non-cash, so a rental often shows a tax loss while cash-flowing — sheltering income. Rental losses are passive: they offset passive income freely, and up to $25,000/yr can offset ordinary (W-2) income if you actively participate and your MAGI is under $100k (phasing out to $0 by $150k); unused losses carry forward. On sale, claimed depreciation is recaptured at up to 25%, and gains may owe capital-gains tax (a 1031 exchange can defer both). Figures are a year-1 estimate at your 24.0% rate — not tax advice; consult a CPA.
Schools (NCES district)
- District
- Taylor School District
- NCES district ID
- 2633540
- Math proficiency
- 14% ▼ -7.00%
- Reading proficiency
- 27% ▼ -4.00%
- Median HH income
- $43,062
- Composite
- 17.62/100
- National rank
- #9034
- State rank
- #462 of 540 in MI
Livability — Taylor
- Score
- 76/100
- State rank
- #144
- US rank
- #3684
Category grades
Schools grade is shown separately in the Schools card above.
Census & demographics
- Census place
- Taylor, MI
- County
- Wayne County · 1,562,939 people
- City population
- 62,081
- Metro
- Detroit-Warren-Dearborn, MI
- Population (ZIP)
- 62,081
- Household income
- $61,081
- Rent vs Own
- Severe rent burden
- 1957.0
Population outlook (Wayne County) Hauer SSP2
- Today (2025)
- 1,675,273 people
- By 2030
- 1,620,300 · -3.3%
- By 2040
- 1,502,341 · -10.3%
- By 2050
- 1,384,039 · -17.4%
- By 2075
- 1,124,592 · -32.9%
- By 2100
- 881,193 · -47.4%
Race, ethnicity, and origin ACS 2023
- Neighborhood character
- Majority White (65%)
- Race & ethnicity
- White 65% Black 19% Two or more races 9% Hispanic / Latino 9% Asian 2%
- Hispanic origin (detail)
- Mexican 6% Puerto Rican 2%
- Common ancestry
- Romanian 8% Lithuanian 3% Slovak 2%
- Foreign-born
- 7% · Canada
- Languages at home
- 89% English-only · Spanish 4% Arabic 3% Other Indo-European 3%
Political lean MEDSL · Wayne
- 2024 margin
- Strong D (+29.0) · D 62.7% · R 33.7% · Other 3.6%
- 2008→2024 swing
- -20.5pp toward R · 2008: 49.5pp · 2024: 29.0pp
- All cycles
- 2024: D+29.0 2020: D+38.1 2016: D+37.3 2012: D+46.9 2008: D+49.5
Not yet ingested
- Civics
- —
Market trends
- HPI YoY
- ▼ -212.33%
- Current HPI
- 228.921
- Rent YoY
- ▲ 4.90%
- Metro
- Detroit-Warren-Dearborn, MI
- State GDP YoY
- ▲ 1.37%
- F500 in state
- 28
Industry mix (Fortune 500 HQ in MI)
| Industry | F500 HQs | Revenue |
|---|---|---|
| Automotive Parts | 3 | $48B |
|
||
| Automotive | 2 | $372B |
|
||
| Chemicals | 1 | $45B |
|
||
| Automotive Retail | 1 | $29B |
|
||
| Healthcare / Medical Devices | 1 | $23B |
|
||
| Automotive Technology | 1 | $20B |
|
||
Price history
+549.5% since first listed41 events — show timeline
- 2026-06-08 Pending — MiRealSource-MiMLS
- 2026-06-08 Pending — REALCOMP
- 2026-05-29 Price Changed $129,900 MiRealSource-MiMLS
- 2026-05-29 Price Changed $129,900 REALCOMP
- 2026-05-13 Listed $139,900 REALCOMP
- 2026-05-13 Listed $139,900 MiRealSource-MiMLS
- 2017-03-07 Listing Removed — REALCOMP
- 2017-03-07 Listing Removed — MiRealSource-MiMLS
- 2017-03-07 Listing Removed — MiRealSource-MiMLS
- 2017-03-07 Listing Removed — REALCOMP
- 2017-02-17 Listed $44,900 MiRealSource-MiMLS
- 2017-02-17 Price Changed $44,900 MiRealSource-MiMLS
- 2017-02-16 Listing Removed — REALCOMP
- 2017-02-16 Listed $44,900 REALCOMP
- 2017-02-16 Listing Removed — MiRealSource-MiMLS
- 2017-01-03 Listed $49,900 MiRealSource-MiMLS
- 2017-01-03 Listed $44,900 REALCOMP
- 2016-12-29 Listed $49,900 MiRealSource-MiMLS
- 2016-12-29 Listed $49,900 REALCOMP
- 2007-02-09 Listing Removed — REALCOMP
- 2005-12-30 Listed $72,800 REALCOMP
- 2005-12-06 Listing Removed — MiRealSource-MiMLS
- 2005-06-06 Listed $109,000 REALCOMP
- 2005-06-06 Listed $109,000 MiRealSource-MiMLS
- 2003-11-17 Sold (Public Records) $96,365 Public Records
- 2003-08-20 Sold (MLS) $96,365 REALCOMP
- 2003-08-20 Sold (MLS) $96,365 REALCOMP
- 2003-08-20 Sold (MLS) $96,365 MiRealSource-MiMLS
- 2003-07-14 Listing Removed — MiRealSource-MiMLS
- 2003-04-30 Listed $99,900 REALCOMP
- 2003-04-21 Listed $99,900 REALCOMP
- 2003-04-21 Listed $99,900 MiRealSource-MiMLS
- 1999-06-15 Sold (Public Records) $68,500 Public Records
- 1999-04-28 Sold (MLS) $68,500 MiRealSource-MiMLS
- 1999-04-28 Sold (MLS) $68,500 REALCOMP
- 1999-01-27 Listing Removed — REALCOMP
- 1999-01-27 Listed $69,900 MiRealSource-MiMLS
- 1999-01-27 Listed $69,900 REALCOMP
- 1998-09-18 Listed $69,900 REALCOMP
- 1996-07-17 Sold (Public Records) $44,000 Public Records
- 1994-09-30 Sold (Public Records) $20,000 Public Records
Property tax history
+2.1%/yrLatest (2025): $2,912 · +2.4% YoY. Source: county tax records.
Cash-flow waterfall
monthlySold comps — $/sqft
last 12 mo · ≤1 miLoading sold comps…