 🏷️ Likely Rental
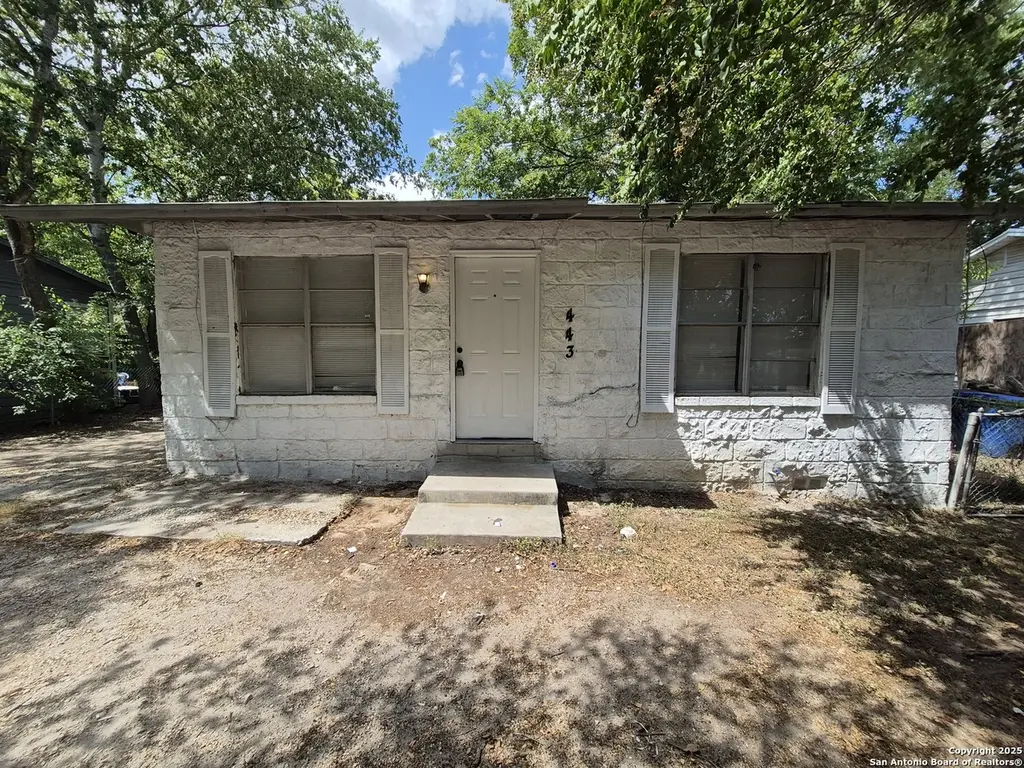
443 Bundy · San Antonio, TX
Flood risk 4/10 · Minor
- FEMA flood zone
- X (unshaded)
- Chance of flooding over 30 yrs
- 0.22%
- Est. flood insurance / yr
- $507 – $1,088
Fire risk 3/10 · Minor
- Est. fire insurance / yr
- $1,222 – $2,270
Heat risk 8/10 · Major
- Hot days now (above 108°F)
- 6 days/yr
- Hot days in 30 yrs
- 19 days/yr
Wind risk 8/10 · Major
- Chance of severe wind over 30 yrs
- 80.0%
Air-quality risk 2/10 · Minimal
- Unhealthy air days now
- 0 days/yr
- Unhealthy air days in 30 yrs
- 2 days/yr
Risk factors via First Street. Map © Google.
Why this score? — see what drove the C- grade
The composite is a weighted blend of 9 inputs, each scored 0–100. Each bar is that input's sub-score; the figure is the points it added to the 100-point composite (weight × sub-score).
- ARV discount +15.0/15.0
- Cash flow +11.9/30.0
- Appreciation +10.0/10.0
- Livability +4.0/5.0
- 1% rule +3.6/10.0
- DSCR +3.5/10.0
- Rent growth +2.6/5.0
- Condition / age +2.5/5.0
- Schools +1.4/10.0
$135,000
🖨 Deal sheet 📄 Offer letter ✓ Due diligence
Listing remarks MLS
Nice 3-bedroom 2 bath house with easy access to I-10. Stove and refrigerator included. Please verify schools if important. Pictures prior to tenant move-in.
Key facts
- 5,488 sq ft lot
- Built 1963
- Listed 101 days
Neighborhood map
What this means for you Summary
Snapshot
- This is a 2-bed/1.0-bath single-family listed at $135k.
Deal economics
- At list price, monthly cash flow is $-35 ($-425/yr) — negative.
- To cash-flow at today's rent, offer at most $129k (4.6% below list).
- To meet the 1% rule (rent ≥ 1% of price), the offer needs to be $116k (14.1% below list).
- Recommended offer: $116k (14.1% below list) — sets the bar for 1% rule.
- Cap rate 6.0% vs local median 3.8% in San Antonio — top-decile yield for the area; either an underpriced asset or a hidden risk that comps aren't pricing in. Stress-test before assuming the spread holds.
Location & tenants
- Location reads 80/100 on livability (#31 in TX, #1,616 nationally) — a professional / high-income tenant draw. Strengths: amenities A+, commute A+, cost of living A+; Watch: schools C-, crime F.
- San Antonio ISD (urban): math 12% / reading 22% proficiency, ranked #805 of 826 in TX (top 98%) — low school quality limits family demand, transient renter base, plan for 1-2y turnover; 80% free/reduced lunch — lower-income household profile, screen leases tightly.
- Market conditions: Rents flat; 113 active listings in the ZIP; 37 comparable units currently listed for rent nearby; rentals at typical pace (median 24d on market — plan ~3-4 weeks tenant-placement turnaround); lower-income renter base — watch delinquency; 8,308 units permitted in Bexar County in 2024 (2,506 in 5+ unit buildings).
- This rent runs 33% of the median local income ($42k/yr) — at the standard rent-burdened threshold; future hikes will face affordability resistance.
Forward outlook
- In year one you build about $14k of equity ($933 loan paydown + $14k appreciation (10.0% local appreciation)).
- Bexar County population projected at +50% by 2050 — long-run rental-demand tailwind backs the buy-and-hold thesis.
- At projected returns (10.0% appreciation + 0.5% rent growth), your $38k cash investment doubles in ~3 years — after that, you're playing with house money.
- By year 3, paydown + projected appreciation supports a ~$37k cash-out refi (75% LTV) — recoverable capital for the next deal without selling this one.
Negotiation context
- It's been on market 101 days — a 9% lower offer ($123k) is reasonable based on typical stale-listing flexibility.
- 7 sale attempts since 16y ago; this cycle's ask is 29% above the opening price — seller raised mid-cycle; expect resistance to lowballs.
Risks & watch-outs
- Climate carrying-cost: severe wind risk, 80% chance of damaging wind over 30y; extreme-heat days projected 6→19/yr by 2055 (HVAC capex compounding) — expect insurance premiums to compound above CPI over the hold.
Questions for the listing agent
- What do current leases actually rent for vs. the listed asking? Can we see a recent rent roll and the last 12 months of T-12 income?
- It's been on market 101 days. Have you received any prior offers? Is the seller open to a 14% concession, seller financing, or rate buy-down credit?
- Built in 1963 — when were the roof, HVAC, electrical panel, plumbing, and water heater last replaced?
- Why hasn't it sold? Are there any deal-killer items the seller is aware of (foundation, flood, title, zoning, code violations)?
- Is there a deadline driving the sale (1031 exchange, divorce, estate, relocation)? That informs how much negotiation room exists.
- Crime grade is F in this area — have there been break-ins, vandalism, or insurance claims at this property in the last 3 years? What carrier currently insures it and at what premium?
- What's the average days-on-market for RENTAL listings here right now (not sales)? A rising rental-DOM trend means longer vacancies and softer asking-rent achievability than the comps imply.
- What's the recent tenant-quality profile in this submarket — average credit score on applications, eviction rate, late-payment / NSF rate, and stable-employment percentage? A property-management company in the area should have these aggregated.
- How much new for-sale + rental construction is in the pipeline within 1–3 miles? Heavy new supply typically softens prices + rents 12–24 months out; constrained supply supports both.
Investment metrics
- 1% rule
- 0.86% ✗
- Cap rate
- 5.98%
- Cash-on-cash
- -1.12%
- DSCR
- 0.95
- GRM
- 9.7
CMA / ARV
- ARV (median comp)
- $183,317
- List price
- $135,000
- Delta
- -26.36%
- Verdict
- UNDERPRICED
- Comps
- 20 within 1.0 mi
Show comp detail 12 sales within ~0.75 mi
| Address | Dist | Beds/Ba | Sqft | Sold | Price | $/sf | Match |
|---|---|---|---|---|---|---|---|
| 647 Ferris Ave | 0.20mi | 2/1.0 | 880 (-2%) | 10mo | $80,000 | $91 | 80 |
| 103 Nellina | 0.47mi | 2/1.0 | 906 (+1%) | 11mo | $85,000 | $94 | 67 |
| 142 Dafoste Ave | 0.31mi | 3/1.0 (+1) | 914 (+2%) | 16mo | $124,000 | $136 | 64 |
| 642 Ferris Ave | 0.21mi | 3/2.0 (+1) | 960 (+7%) | 7mo | $142,000 | $148 | 64 |
| 419 Hub Ave | 0.48mi | 3/1.0 (+1) | 918 (+2%) | 6mo | $196,000 | $214 | 63 |
| 655 Ferris Ave | 0.21mi | 3/1.0 (+1) | 984 (+10%) | 10mo | $85,000 | $86 | 61 |
| 923 F St | 0.54mi | 3/1.0 (+1) | 832 (-7%) | 5mo | $135,000 | $162 | 54 |
| 410 Dorie | 0.30mi | 3/1.0 (+1) | 776 (-13%) | 6mo | $105,000 | $135 | 53 |
| 527 Morningview | 0.41mi | 3/1.0 (+1) | 784 (-12%) | 3mo | $119,000 | $152 | 53 |
| 330 Hub | 0.55mi | 2/1.0 | 832 (-7%) | 16mo | $140,000 | $168 | 49 |
| 450 Sterling | 0.42mi | 3/1.0 (+1) | 792 (-12%) | 12mo | $100,000 | $126 | 46 |
| 778 F St | 0.75mi | 2/1.0 | 960 (+7%) | 16mo | $125,000 | $130 | 40 |
Match score weights: distance 35% · size 25% · config 20% · recency 20%. Top-matched comps best support the ARV.
Projected returns pro-forma
10.0% appreciation · 0.53% rent growth · sell at horizon
- IRR
- 22.7%
- Equity multiple
- 2.81×
- Total profit
- $68,487
- Equity at exit
- $121,619
- IRR
- 19.7%
- Equity multiple
- 6.25×
- Total profit
- $198,363
- Equity at exit
- $262,275
Cash invested: $37,800 (down + closing). Projections, not guarantees.
Landlord ↔ Tenant lean methodology
- Overall (STATE)
- 87 Strongly Landlord-Friendly
- State Texas
- 87 Strongly Landlord-Friendly · R+5
- County
- — inherits STATE
- City
- — inherits STATE
ZIP-level market 78220
- Home prices YoY
- 9.1%
- Rents YoY
- 0.5%
- Active inventory
- 113
- Price-to-rent
- 9.7×
Monthly cashflow live
- Estimated rent
- $1,159 high interval (Pro) →
- Mortgage (P&I)
- −$708
- Tax from tax record
- −$187 /mo · $2,245/yr
- Insurance
- −$56
- HOA
- −$0
- Vacancy / Maint / Mgmt
- −$243
- Net cashflow
- $-35
Break-even live
UW: 25.0% down · 7.5% · 30yr · 1.5% tax · 5.0% vac · 8.0% maint · 8.0% mgmt
Financing live
Cash to close
- Down payment
- $33,750
- Closing costs
- $4,050
- Reserves months
- —
- Total cash needed
- —
Loan-product check · same deal, 3 products live
Conventional
25% down · 7.5% · 30yr
- Down + closing
- —
- Monthly P&I
- —
- Monthly cashflow
- —
- DSCR
- —
- Eligible?
- —
Personal DTI + credit; lowest rate.
DSCR
20% down · 8.5% · 30yr
- Down + closing
- —
- Monthly P&I
- —
- Monthly cashflow
- —
- DSCR
- —
- Eligible?
- —
No personal income docs; deal must DSCR.
Hard money
10% down · 12.0% · 12mo
- Down + closing
- —
- Monthly P&I
- —
- Monthly cashflow
- —
- DSCR
- —
- Eligible?
- —
Short-term bridge; refi at stabilization.
Rent comps 37 comps
| Address | Beds | Baths | Sqft | Rent | $/sqft | DOM | Units | Dist |
|---|---|---|---|---|---|---|---|---|
| 3327 Martin Luther King Dr Unit a San Antonio, TX | 3.0 | 2.0 | 876 | $915 | $1.04 | 1d | 1 | 0.17mi |
| 3318 Martin Luther King Dr San Antonio, TX | 3.0 | 2.0 | 909 | $975 | $1.07 | 43d | 1 | 0.20mi |
| 458 Ferris Ave San Antonio, TX | 3.0 | 2.0 | 909 | $1,380 | $1.52 | 1d | 1 | 0.21mi |
| 3259 Martin Luther King Dr San Antonio, TX | 3.0 | 2.0 | 909 | $1,149 | $1.26 | 4d | 1 | 0.23mi |
| 547 Dorie St San Antonio, TX | 3.0 | 2.0 | 909 | $1,135 | $1.25 | 21d | 1 | 0.36mi |
| 302 Dorie St San Antonio, TX | 3.0 | 2.0 | 1028 | $1,285 | $1.25 | 21d | 1 | 0.37mi |
| 515 Lincolnshire Dr San Antonio, TX | 2.0 | 1.0 | 681 | $885 | $1.30 | 4d | 1 | 0.38mi |
| 455 Lincolnshire Dr San Antonio, TX | 2.0 | 1.0 | 768 | $925 | $1.20 | 20d | 1 | 0.46mi |
| 311 Ferris Ave San Antonio, TX | 3.0 | 2.0 | 909 | $1,245 | $1.37 | 4d | 1 | 0.50mi |
| 380 Sterling St Unit 1 San Antonio, TX | 2.0 | 1.0 | 642 | $550 | $0.86 | 23d | 1 | 0.57mi |
| 231 Noblewood Dr San Antonio, TX | 1.0–4.0 | 1.0–2.0 | 1084 | $1,168 | $1.08 | 23d | 1 | 0.59mi |
| 239 Ferris Ave San Antonio, TX | 3.0 | 2.0 | 909 | $1,249 | $1.37 | 43d | 1 | 0.63mi |
| 3030 Martin Luther King Dr San Antonio, TX | 3.0 | 1.0 | 938 | $1,295 | $1.38 | 23d | 1 | 0.67mi |
| 1311 W Hein Rd Unit 4 San Antonio, TX | 2.0 | 2.0 | 1000 | $1,000 | $1.00 | 43d | 1 | 0.69mi |
| 1311 W Hein Rd Unit 18 San Antonio, TX | 2.0 | 1.5 | 900 | $895 | $0.99 | 43d | 1 | 0.69mi |
| 3815 E Commerce St San Antonio, TX | 3.0 | 1.0–2.0 | 872 | $1,163 | $1.33 | 3d | 60 | 0.77mi |
| 3623 E Commerce St San Antonio, TX | 1.0 | 1.0 | 616 | $955 | $1.55 | 43d | 1 | 0.79mi |
| 215 Edna Ave San Antonio, TX | 2.0 | 1.0 | 968 | $1,260 | $1.30 | 43d | 1 | 0.80mi |
| 368 Readwell Dr San Antonio, TX | 3.0 | 1.0 | 1067 | $1,200 | $1.12 | 43d | 1 | 0.80mi |
| 311 Spriggsdale Ave Unit 610 San Antonio, TX | 1.0 | 1.0 | 745 | $892 | $1.20 | 2d | 1 | 0.92mi |
| 311 Spriggsdale Ave Unit 710 San Antonio, TX | 2.0 | 2.0 | 890 | $981 | $1.10 | 2d | 1 | 0.92mi |
| 334 Tomrob Dr San Antonio, TX | 3.0 | 1.0 | 1064 | $1,300 | $1.22 | 14d | 1 | 0.95mi |
| 302 Kenmar Dr San Antonio, TX | 3.0 | 1.0 | 970 | $1,375 | $1.42 | 23d | 1 | 0.96mi |
| 4319 Algruth Dr San Antonio, TX | 3.0 | 2.0 | 1021 | $1,800 | $1.76 | 23d | 1 | 0.99mi |
| 723 Sewanee St San Antonio, TX | 3.0 | 2.0 | 1028 | $1,264 | $1.23 | 12d | 1 | 1.12mi |
| 4426 N Hein Rd Apt 2204 San Antonio, TX | 2.0 | 1.0 | 723 | $1,250 | $1.73 | 43d | 1 | 1.12mi |
| 4438 N Hein Rd Unit 104 San Antonio, TX | 2.0 | 1.0 | 632 | $1,150 | $1.82 | 43d | 1 | 1.16mi |
| 817 Cresthill Rd San Antonio, TX | 3.0 | 1.0 | 950 | $1,300 | $1.37 | 43d | 1 | 1.18mi |
| 143 Ranger Unit 101 San Antonio, TX | 3.0 | 2.0 | 876 | $1,099 | $1.25 | 1d | 1 | 1.24mi |
| 918 Hampton St Unit 1 San Antonio, TX | 3.0 | 1.0 | 912 | $975 | $1.07 | 43d | 1 | 1.27mi |
| 902 Gembler Rd San Antonio, TX | 1.0–3.0 | 1.0–2.0 | 966 | $1,452 | $1.50 | 1d | 21 | 1.28mi |
| 4606 Hollyspring Dr San Antonio, TX | 3.0 | 2.0 | 1098 | $1,400 | $1.28 | 23d | 1 | 1.37mi |
| 535 Gembler Rd Unit 610 San Antonio, TX | 1.0 | 1.0 | 774 | $852 | $1.10 | 2d | 1 | 1.38mi |
| 535 Gembler Rd Unit 710 San Antonio, TX | 2.0 | 2.0 | 1031 | $1,081 | $1.05 | 2d | 1 | 1.38mi |
| 541 Gembler Rd San Antonio, TX | 1.0 | 1.0 | 726 | $1,100 | $1.52 | 43d | 1 | 1.40mi |
| 915 Creekview San Antonio, TX | 2.0 | 2.0 | 950 | $1,230 | $1.29 | 23d | 1 | 1.47mi |
| 3400 Roland Rd San Antonio, TX | 1.0–2.0 | 1.0 | 769 | $999 | $1.30 | 21d | 1 | 1.49mi |
Listing history 36 events
-
2026-06-18days on market $135,000 Active 101 DOM
-
2026-06-17days on market $135,000 Active 100 DOM
-
2026-06-16days on market $135,000 Active 99 DOM
-
2026-06-15days on market $135,000 Active 98 DOM
-
2026-06-13days on market $135,000 Active 96 DOM
-
2026-06-09days on market $135,000 Active 92 DOM
-
2026-06-08days on market $135,000 Active 91 DOM
-
2026-06-07days on market $135,000 Active 90 DOM
-
2026-06-04days on market $135,000 Active 87 DOM
-
2026-06-03days on market $135,000 Active 86 DOM
-
2026-06-02days on market $135,000 Active 85 DOM
-
2026-06-01days on market $135,000 Active 84 DOM
-
2026-05-31days on market $135,000 Active 83 DOM
-
2026-04-04status Back on Market 158-char remark
Show marketing remark (158 chars)
Nice 3-bedroom 2 bath house with easy access to I-10. Stove and refrigerator included. Please verify schools if important. Pictures prior to tenant move-in.
-
2026-03-31historical 158-char remark
Show marketing remark (158 chars)
Nice 3-bedroom 2 bath house with easy access to I-10. Stove and refrigerator included. Please verify schools if important. Pictures prior to tenant move-in.
-
2026-03-25price $135,000 158-char remark
Show marketing remark (158 chars)
Nice 3-bedroom 2 bath house with easy access to I-10. Stove and refrigerator included. Please verify schools if important. Pictures prior to tenant move-in.
-
2026-03-19price $125,000 158-char remark
Show marketing remark (158 chars)
Nice 3-bedroom 2 bath house with easy access to I-10. Stove and refrigerator included. Please verify schools if important. Pictures prior to tenant move-in.
-
2026-03-05$105,000 New 158-char remark
Show marketing remark (158 chars)
Nice 3-bedroom 2 bath house with easy access to I-10. Stove and refrigerator included. Please verify schools if important. Pictures prior to tenant move-in.
-
2025-11-14historical $995
-
2025-11-13price $995
-
2025-10-30$1,045
-
2025-07-07historical $1,195
-
2025-07-05$1,195
-
2022-04-22soldstatus
-
2022-04-22soldstatus
-
2021-12-15soldstatus Sold 99-char remark
Show marketing remark (99 chars)
Cash offers only. Contact listing agent for showing times 9563791693. Property is currently vacant.
-
2021-11-15soldstatus
-
2021-11-03status Pending 99-char remark
Show marketing remark (99 chars)
Cash offers only. Contact listing agent for showing times 9563791693. Property is currently vacant.
-
2021-10-11status Back on Market 99-char remark
Show marketing remark (99 chars)
Cash offers only. Contact listing agent for showing times 9563791693. Property is currently vacant.
-
2021-08-08historical 99-char remark
Show marketing remark (99 chars)
Cash offers only. Contact listing agent for showing times 9563791693. Property is currently vacant.
-
2021-06-08$94,900 New 99-char remark
Show marketing remark (99 chars)
Cash offers only. Contact listing agent for showing times 9563791693. Property is currently vacant.
-
2021-05-04soldstatus
-
2011-07-29historical
-
2010-08-09$39,000
-
2005-10-14soldstatus
-
2005-10-14soldstatus
ⓘ Source: listings_history table (triggers on properties + properties_extension) + one-shot
backfill from property_details.listing_events for pre-trigger history.
Tax reassessment forecast TX · Resets to sale price
- Current annual tax
- $2,245 · $187/mo
- Projected year-2 tax
- $2,470 · $206/mo
- Expected delta
- +$225/yr (+$19/mo · 10.0%)
ⓘ Screening estimate from a state-policy table — verify with the county assessor before closing.
Climate risk First Street
- Flood 4/10 Moderate FEMA zone X (unshaded) · 22% chance over 30 yrs
- Wildfire 3/10 Moderate
- Heat 8/10 Severe 6 d/yr ≥108°F today · 19 d/yr by 30 yrs out
- Wind 8/10 Severe 80% chance of damaging wind over 30 yrs
- Air quality 2/10 Low 0 unhealthy d/yr today · 2 by 30 yrs out
Nearby sold comps map
Loading sold comps map…
Walkable amenities ~0.75 mi
Loading nearby amenities…
Taxation est. · year 1
- Rental income
- $13,913
- − Mortgage interest
- −$7,562
- − Property taxes
- −$2,245
- − Insurance
- −$675
- − Repairs & maintenance
- −$1,113
- − Management
- −$1,113
- − Depreciation
- −$3,927
- Taxable loss
- −$2,723
- Est. tax savings @ 24.0%
- +$654
- After-tax cash flow
- $229/yr
For passive investors: Depreciation is non-cash, so a rental often shows a tax loss while cash-flowing — sheltering income. Rental losses are passive: they offset passive income freely, and up to $25,000/yr can offset ordinary (W-2) income if you actively participate and your MAGI is under $100k (phasing out to $0 by $150k); unused losses carry forward. On sale, claimed depreciation is recaptured at up to 25%, and gains may owe capital-gains tax (a 1031 exchange can defer both). Figures are a year-1 estimate at your 24.0% rate — not tax advice; consult a CPA.
Schools (NCES district)
- District
- San Antonio ISD
- NCES district ID
- 4838730
- Math proficiency
- 12% ▼ -21.00%
- Reading proficiency
- 22% ▼ -7.00%
- Median HH income
- $30,952
- Composite
- 13.57/100
- National rank
- #9512
- State rank
- #805 of 826 in TX
Livability — San Antonio
- Score
- 80/100
- State rank
- #31
- US rank
- #1616
Category grades
Schools grade is shown separately in the Schools card above.
Census & demographics
- Census place
- San Antonio, TX
- County
- Bexar County · 1,990,555 people
- City population
- 1,806,925
- Metro
- San Antonio-New Braunfels, TX
- Population (ZIP)
- 19,423
- Household income
- $41,710
- Rent vs Own
- Severe rent burden
- 705.0
Population outlook (Bexar County) Hauer SSP2
- Today (2025)
- 2,336,851 people
- By 2030
- 2,560,728 · +9.6%
- By 2040
- 3,020,569 · +29.3%
- By 2050
- 3,493,522 · +49.5%
- By 2075
- 4,668,459 · +99.8%
- By 2100
- 5,533,242 · +136.8%
Race, ethnicity, and origin ACS 2023
- Neighborhood character
- Majority Hispanic (60%)
- Race & ethnicity
- Hispanic / Latino 60% Black 30% Two or more races 22% White 8%
- Hispanic origin (detail)
- Mexican 47% Puerto Rican 1%
- Foreign-born
- 11% · Canada
- Languages at home
- 63% English-only · Spanish 36%
Political lean MEDSL · Bexar
- 2024 margin
- Lean D (+9.8) · D 54.3% · R 44.6% · Other 1.1%
- 2008→2024 swing
- +4.2pp toward D · 2008: 5.6pp · 2024: 9.8pp
- All cycles
- 2024: D+9.8 2020: D+18.2 2016: D+13.5 2012: D+4.6 2008: D+5.6
Not yet ingested
- Civics
- —
Market trends
- HPI YoY
- ▲ 23.86%
- Current HPI
- 284.9844
- Rent YoY
- ▲ 0.53%
- Metro
- San Antonio-New Braunfels, TX
- State GDP YoY
- ▲ 3.95%
- F500 in state
- 110
Industry mix (Fortune 500 HQ in TX)
| Industry | F500 HQs | Revenue |
|---|---|---|
| Energy | 16 | $1,198B |
|
||
| Technology | 5 | $198B |
|
||
| Engineering / Construction | 4 | $72B |
|
||
| Energy Services | 3 | $60B |
|
||
| Utilities | 3 | $41B |
|
||
| Healthcare | 2 | $330B |
|
||
Price history
+246.2% since first listed23 events — show timeline
- 2026-04-04 Relisted — LERA
- 2026-03-31 Listing Removed — LERA
- 2026-03-25 Price Changed $135,000 LERA
- 2026-03-19 Price Changed $125,000 LERA
- 2026-03-05 Listed $105,000 LERA
- 2025-11-14 Rental Removed $995 APPFOLIO
- 2025-11-13 Price Changed $995 APPFOLIO
- 2025-10-30 Listed for Rent $1,045 APPFOLIO
- 2025-07-07 Rental Removed $1,195 APPFOLIO
- 2025-07-05 Listed for Rent $1,195 APPFOLIO
- 2022-04-22 Sold (Public Records) — Public Records
- 2022-04-22 Sold (Public Records) — Public Records
- 2021-12-15 Sold (MLS) — LERA
- 2021-11-15 Sold (Public Records) — Public Records
- 2021-11-03 Pending — LERA
- 2021-10-11 Relisted — LERA
- 2021-08-08 Listing Removed — LERA
- 2021-06-08 Listed $94,900 LERA
- 2021-05-04 Sold (Public Records) — Public Records
- 2011-07-29 Listing Removed — LERA
- 2010-08-09 Listed $39,000 LERA
- 2005-10-14 Sold (Public Records) — Public Records
- 2005-10-14 Sold (Public Records) — Public Records
Property tax history
+6.6%/yrLatest (2025): $2,245 · -10.7% YoY. Source: county tax records.
Cash-flow waterfall
monthlySold comps — $/sqft
last 12 mo · ≤1 miLoading sold comps…