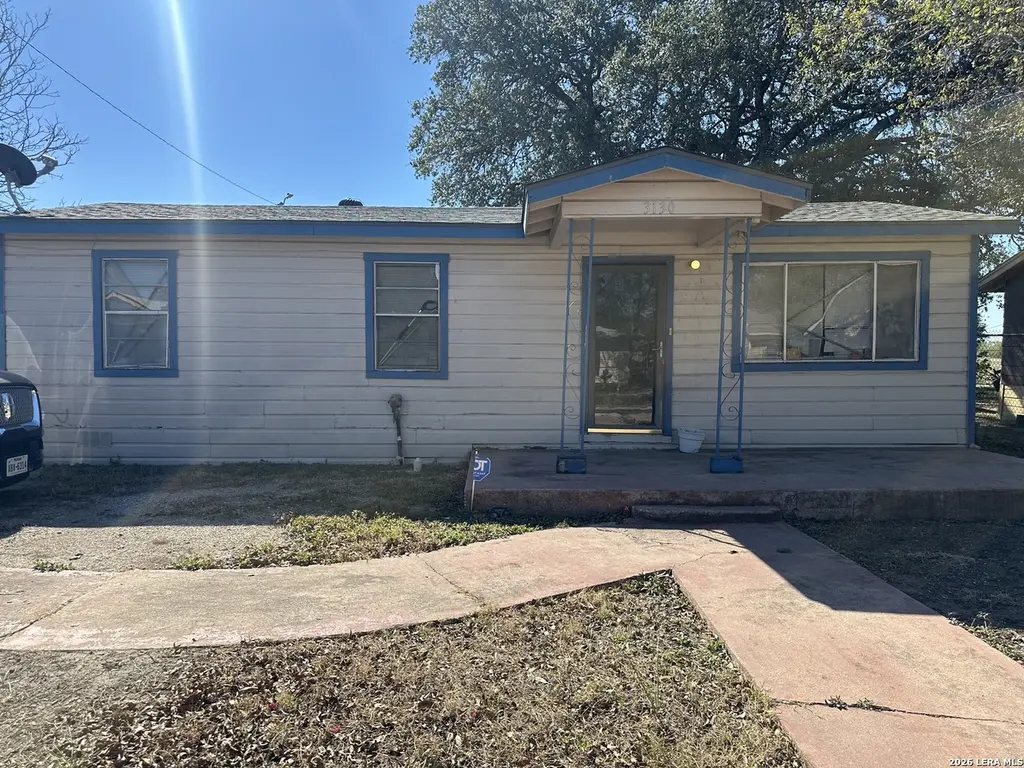
3130 Golden Ave · San Antonio, TX
Flood risk 4/10 · Minor
- FEMA flood zone
- X (unshaded)
- Chance of flooding over 30 yrs
- 0.22%
- Est. flood insurance / yr
- $507 – $1,088
Fire risk 4/10 · Minor
- Est. fire insurance / yr
- $1,222 – $2,270
Heat risk 8/10 · Major
- Hot days now (above 109°F)
- 7 days/yr
- Hot days in 30 yrs
- 23 days/yr
Wind risk 8/10 · Major
- Chance of severe wind over 30 yrs
- 80.0%
Air-quality risk 2/10 · Minimal
- Unhealthy air days now
- 1 days/yr
- Unhealthy air days in 30 yrs
- 1 days/yr
Risk factors via First Street. Map © Google.
Why this score? — see what drove the B grade
The composite is a weighted blend of 9 inputs, each scored 0–100. Each bar is that input's sub-score; the figure is the points it added to the 100-point composite (weight × sub-score).
- Cash flow +26.3/30.0
- ARV discount +15.0/15.0
- DSCR +8.9/10.0
- 1% rule +8.0/10.0
- Appreciation +4.8/10.0
- Livability +4.0/5.0
- Rent growth +2.5/5.0
- Condition / age +2.5/5.0
- Schools +1.4/10.0
$75,000
🖨 Deal sheet 📄 Offer letter ✓ Due diligence
Key facts
- 6,250 sq ft lot
- 2 garage spots
- Built 1968
Property features AI
Finance
- Other: Possession at closing/funding; For sale
- Financial info: Down payment resources not indicated
- HOA & community: Subdivision legal name: QUINTANA/SOUTH SAN AREA (SS)
Exterior
- Parking: 2-car garage; Side entry parking
- Utilities: Water system available
- Home design: Pre-owned property; Approximately 58 years old
- Construction: Composition roof; Wood shingle/shake roof
- Exterior features: Asbestos shingle exterior; Subdivision: QUINTANA ROAD
Interior
- Kitchen: Kitchen roughly 6 x 8
- Bedrooms: Master bedroom about 10 x 10; Bedroom 2 about 8 x 8; Bedroom 3 about 7 x 7
- Flooring: Laminate flooring
- Bathrooms: One full bath; One half bath; Master bath with shower only
- Heating & cooling: Central heating; Natural gas heating; Central air conditioning
- Interior features: One living area; All window coverings remain
Neighborhood map
What this means for you Summary
Snapshot
- This is a 2-bed/1.0-bath single-family listed at $75k.
Deal economics
- At list price, monthly cash flow is $193 ($2k/yr) — positive.
- The deal already cash-flows at list — no discount required.
- Meets the 1% rule at list price ($976 rent vs $75k).
- Cap rate 9.4% vs local median 3.8% in San Antonio — top-decile yield for the area; either an underpriced asset or a hidden risk that comps aren't pricing in. Stress-test before assuming the spread holds.
Location & tenants
- Location reads 80/100 on livability (#31 in TX, #1,616 nationally) — a professional / high-income tenant draw. Strengths: amenities A+, commute A+, cost of living A+; Watch: schools C-, crime F.
- South San Antonio ISD (urban): math 13% / reading 20% proficiency, ranked #804 of 826 in TX (top 97%) — low school quality limits family demand, transient renter base, plan for 1-2y turnover.
- Market conditions: 152 active listings in the ZIP; 9 comparable units currently listed for rent nearby; rentals at typical pace (median 24d on market — plan ~3-4 weeks tenant-placement turnaround); 44% of comp listings sitting > 30 days — soft ceiling on asking rent; 8,308 units permitted in Bexar County in 2024 (2,506 in 5+ unit buildings).
Forward outlook
- In year one you build about $182 of equity ($519 loan paydown + $-337 appreciation (-0.5% local appreciation)).
- Bexar County population projected at +50% by 2050 — long-run rental-demand tailwind backs the buy-and-hold thesis.
- At projected returns (-0.5% appreciation + 3.0% rent growth), your $21k cash investment doubles in ~7 years — after that, you're playing with house money.
Negotiation context
- Only 9 days on market — expect competitive offers; lowballing is unlikely to land.
Risks & watch-outs
- Climate carrying-cost: severe wind risk, 80% chance of damaging wind over 30y; extreme-heat days projected 7→23/yr by 2055 (HVAC capex compounding) — expect insurance premiums to compound above CPI over the hold.
Questions for the listing agent
- Built in 1968 — when were the roof, HVAC, electrical panel, plumbing, and water heater last replaced?
- Is there a deadline driving the sale (1031 exchange, divorce, estate, relocation)? That informs how much negotiation room exists.
- Crime grade is F in this area — have there been break-ins, vandalism, or insurance claims at this property in the last 3 years? What carrier currently insures it and at what premium?
- What's the average days-on-market for RENTAL listings here right now (not sales)? A rising rental-DOM trend means longer vacancies and softer asking-rent achievability than the comps imply.
- What's the recent tenant-quality profile in this submarket — average credit score on applications, eviction rate, late-payment / NSF rate, and stable-employment percentage? A property-management company in the area should have these aggregated.
- How much new for-sale + rental construction is in the pipeline within 1–3 miles? Heavy new supply typically softens prices + rents 12–24 months out; constrained supply supports both.
Investment metrics
- 1% rule
- 1.30% ✓
- Cap rate
- 9.37%
- Cash-on-cash
- 11.01%
- DSCR
- 1.49
- GRM
- 6.4
CMA / ARV
- ARV (on-the-fly)
- $119,520
- Comps found
- 6
Show comp detail 6 sales within ~0.75 mi
| Address | Dist | Beds/Ba | Sqft | Sold | Price | $/sf | Match |
|---|---|---|---|---|---|---|---|
| 3130 Golden Ave | 0.00mi | 3/1.5 (+1) | 720 (0%) | 1mo | $75,000 | $104 | 92 |
| 250 Yuma | 0.23mi | 2/1.0 | 768 (+7%) | 8mo | $75,000 | $98 | 72 |
| 235 Mohawk | 0.31mi | 3/1.0 (+1) | 816 (+13%) | 5mo | $139,899 | $171 | 55 |
| 134 Fernleaf Ave | 0.73mi | 2/1.0 | 658 (-9%) | 3mo | $109,000 | $166 | 49 |
| 223 Mohawk | 0.32mi | 1/1.0 (-1) | 648 (-10%) | 22mo | $50,000 | $77 | 45 |
| 2618 Misty Spray Dr | 0.73mi | 2/1.0 | 816 (+13%) | 14mo | $142,800 | $175 | 32 |
Match score weights: distance 35% · size 25% · config 20% · recency 20%. Top-matched comps best support the ARV.
Projected returns pro-forma
-0.45% appreciation · 3.0% rent growth · sell at horizon
- IRR
- 8.8%
- Equity multiple
- 1.41×
- Total profit
- $8,555
- Equity at exit
- $20,109
- IRR
- 14.3%
- Equity multiple
- 2.50×
- Total profit
- $31,558
- Equity at exit
- $22,877
Cash invested: $21,000 (down + closing). Projections, not guarantees.
Landlord ↔ Tenant lean methodology
- Overall (STATE)
- 87 Strongly Landlord-Friendly
- State Texas
- 87 Strongly Landlord-Friendly · R+5
- County
- — inherits STATE
- City
- — inherits STATE
ZIP-level market 78211
- Home prices YoY
- -0.2%
- Active inventory
- 152
- Price-to-rent
- 6.4×
Monthly cashflow live
- Estimated rent
- $976 high interval (Pro) →
- Mortgage (P&I)
- −$393
- Tax from tax record
- −$154 /mo · $1,848/yr
- Insurance
- −$31
- HOA
- −$0
- Vacancy / Maint / Mgmt
- −$205
- Net cashflow
- $193
Break-even live
UW: 25.0% down · 7.5% · 30yr · 1.5% tax · 5.0% vac · 8.0% maint · 8.0% mgmt
Financing live
Cash to close
- Down payment
- $18,750
- Closing costs
- $2,250
- Reserves months
- —
- Total cash needed
- —
Loan-product check · same deal, 3 products live
Conventional
25% down · 7.5% · 30yr
- Down + closing
- —
- Monthly P&I
- —
- Monthly cashflow
- —
- DSCR
- —
- Eligible?
- —
Personal DTI + credit; lowest rate.
DSCR
20% down · 8.5% · 30yr
- Down + closing
- —
- Monthly P&I
- —
- Monthly cashflow
- —
- DSCR
- —
- Eligible?
- —
No personal income docs; deal must DSCR.
Hard money
10% down · 12.0% · 12mo
- Down + closing
- —
- Monthly P&I
- —
- Monthly cashflow
- —
- DSCR
- —
- Eligible?
- —
Short-term bridge; refi at stabilization.
Rent comps 9 comps
| Address | Beds | Baths | Sqft | Rent | $/sqft | DOM | Units | Dist |
|---|---|---|---|---|---|---|---|---|
| 146 Caddo Unit A San Antonio, TX | 2.0 | 1.0 | 600 | $950 | $1.58 | 23d | 1 | 0.44mi |
| 3632 SW Military Dr Unit 14 San Antonio, TX | 2.0 | 1.0 | 700 | $915 | $1.31 | 21d | 1 | 0.57mi |
| 518 Briggs St San Antonio, TX | 2.0 | 1.0 | 740 | $699 | $0.94 | 16d | 1 | 0.59mi |
| 518 Briggs Ave Apt 401 San Antonio, TX | 2.0 | 1.0 | 740 | $699 | $0.94 | 23d | 1 | 0.59mi |
| 130 Camino de Oro San Antonio, TX | 1.0–2.0 | 1.0 | 629 | $1,060 | $1.69 | 1d | 40 | 0.63mi |
| 130 Camino de Oro San Antonio, TX | 2.0 | 1.0 | 629 | $1,690 | $2.69 | 43d | 10 | 0.63mi |
| 130 Camino De Oro Unit 601 San Antonio, TX | 1.0 | 1.0 | 586 | $914 | $1.56 | 43d | 1 | 0.63mi |
| 223 Kelsey Ave Unit 1 San Antonio, TX | 1.0 | 1.0 | 650 | $795 | $1.22 | 43d | 1 | 0.69mi |
| 602 Lovett Ave Unit 5 San Antonio, TX | 1.0 | 1.0 | 550 | $645 | $1.17 | 43d | 1 | 1.12mi |
Listing history 2 events
-
2026-04-30status Pending
-
2026-04-21$75,000 New
ⓘ Source: listings_history table (triggers on properties + properties_extension) + one-shot
backfill from property_details.listing_events for pre-trigger history.
Tax reassessment forecast TX · Resets to sale price
- Current annual tax
- $1,848 · $154/mo
- Projected year-2 tax
- $1,848 · $154/mo
- Expected delta
- $0/yr ($0/mo · 0.0%)
ⓘ Screening estimate from a state-policy table — verify with the county assessor before closing.
Climate risk First Street
- Flood 4/10 Moderate FEMA zone X (unshaded) · 22% chance over 30 yrs
- Wildfire 4/10 Moderate
- Heat 8/10 Severe 7 d/yr ≥109°F today · 23 d/yr by 30 yrs out
- Wind 8/10 Severe 80% chance of damaging wind over 30 yrs
- Air quality 2/10 Low 1 unhealthy d/yr today · 1 by 30 yrs out
Nearby sold comps map
Loading sold comps map…
Walkable amenities ~0.75 mi
Loading nearby amenities…
Taxation est. · year 1
- Rental income
- $11,714
- − Mortgage interest
- −$4,201
- − Property taxes
- −$1,848
- − Insurance
- −$375
- − Repairs & maintenance
- −$937
- − Management
- −$937
- − Depreciation
- −$2,182
- Taxable income
- $1,234
- Est. tax owed @ 24.0%
- −$296
- After-tax cash flow
- $2,015/yr
For passive investors: Depreciation is non-cash, so a rental often shows a tax loss while cash-flowing — sheltering income. Rental losses are passive: they offset passive income freely, and up to $25,000/yr can offset ordinary (W-2) income if you actively participate and your MAGI is under $100k (phasing out to $0 by $150k); unused losses carry forward. On sale, claimed depreciation is recaptured at up to 25%, and gains may owe capital-gains tax (a 1031 exchange can defer both). Figures are a year-1 estimate at your 24.0% rate — not tax advice; consult a CPA.
Schools (NCES district)
- District
- South San Antonio ISD
- NCES district ID
- 4840680
- Math proficiency
- 13% ▼ -20.00%
- Reading proficiency
- 20% ▼ -10.00%
- Median HH income
- $35,460
- Composite
- 13.6/100
- National rank
- #9511
- State rank
- #804 of 826 in TX
Livability — San Antonio
- Score
- 80/100
- State rank
- #31
- US rank
- #1616
Category grades
Schools grade is shown separately in the Schools card above.
Census & demographics
- Census place
- San Antonio, TX
- County
- Bexar County · 1,990,555 people
- City population
- 1,806,925
- Metro
- San Antonio-New Braunfels, TX
- Population (ZIP)
- 30,857
- Household income
- $55,436
- Rent vs Own
- Severe rent burden
- 729.0
Population outlook (Bexar County) Hauer SSP2
- Today (2025)
- 2,336,851 people
- By 2030
- 2,560,728 · +9.6%
- By 2040
- 3,020,569 · +29.3%
- By 2050
- 3,493,522 · +49.5%
- By 2075
- 4,668,459 · +99.8%
- By 2100
- 5,533,242 · +136.8%
Race, ethnicity, and origin ACS 2023
- Neighborhood character
- Predominantly Hispanic (93%)
- Race & ethnicity
- Hispanic / Latino 93% Two or more races 30% White 5% Black 1% Native American 1%
- Hispanic origin (detail)
- Mexican 76%
- Foreign-born
- 18% · Canada
- Languages at home
- 35% English-only · Spanish 65%
Political lean MEDSL · Bexar
- 2024 margin
- Lean D (+9.8) · D 54.3% · R 44.6% · Other 1.1%
- 2008→2024 swing
- +4.2pp toward D · 2008: 5.6pp · 2024: 9.8pp
- All cycles
- 2024: D+9.8 2020: D+18.2 2016: D+13.5 2012: D+4.6 2008: D+5.6
Not yet ingested
- Civics
- —
Market trends
- HPI YoY
- ▼ -0.45%
- Current HPI
- 241.1709
- Rent YoY
- —
- Metro
- San Antonio-New Braunfels, TX
- State GDP YoY
- ▲ 3.95%
- F500 in state
- 110
Industry mix (Fortune 500 HQ in TX)
| Industry | F500 HQs | Revenue |
|---|---|---|
| Energy | 16 | $1,198B |
|
||
| Technology | 5 | $198B |
|
||
| Engineering / Construction | 4 | $72B |
|
||
| Energy Services | 3 | $60B |
|
||
| Utilities | 3 | $41B |
|
||
| Healthcare | 2 | $330B |
|
||
Price history
2 events — show timeline
- 2026-04-30 Pending — LERA
- 2026-04-21 Listed $75,000 LERA
Property tax history
+5.8%/yrLatest (2025): $1,848 · +10.0% YoY. Source: county tax records.
Cash-flow waterfall
monthlySold comps — $/sqft
last 12 mo · ≤1 miLoading sold comps…