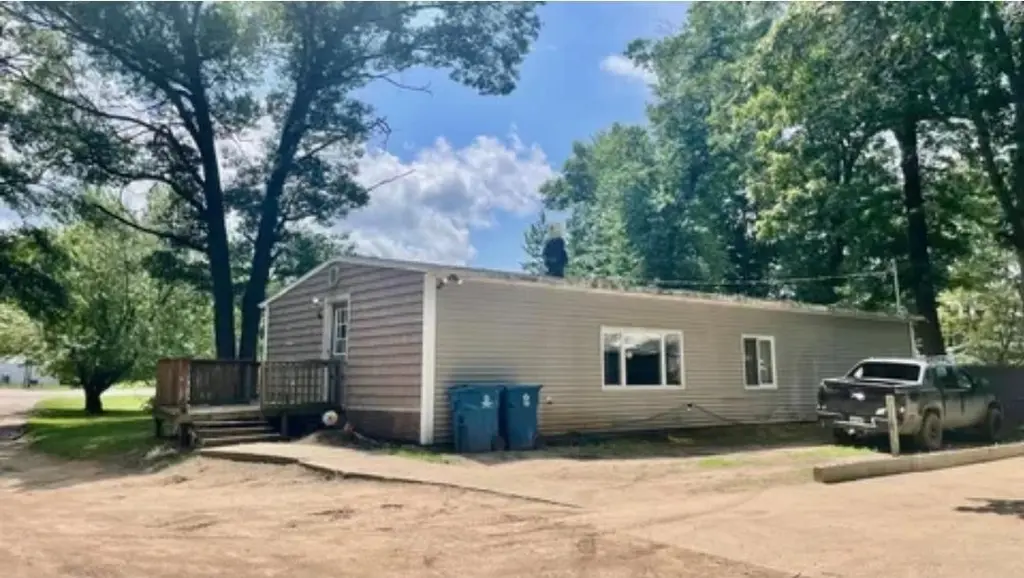
654 W Isabella Rd · Sanford, MI
Flood risk No data
- FEMA flood zone
- —
- Chance of flooding over 30 yrs
- —
- Est. flood insurance / yr
- —
Fire risk No data
- Est. fire insurance / yr
- —
Heat risk No data
- Hot days now (above threshold)
- —
- Hot days in 30 yrs
- —
Wind risk No data
- Chance of severe wind over 30 yrs
- —
Air-quality risk No data
- Unhealthy air days now
- —
- Unhealthy air days in 30 yrs
- —
Risk factors via First Street. Map © Google.
Why this score? — see what drove the B- grade
The composite is a weighted blend of 9 inputs, each scored 0–100. Each bar is that input's sub-score; the figure is the points it added to the 100-point composite (weight × sub-score).
- Cash flow +29.3/30.0
- DSCR +10.0/10.0
- 1% rule +7.8/10.0
- ARV discount +7.5/15.0
- Schools +4.0/10.0
- Livability +3.5/5.0
- Rent growth +2.5/5.0
- Condition / age +2.5/5.0
- Appreciation +0.0/10.0
$125,000
🖨 Deal sheet 📄 Offer letter ✓ Due diligence
Listing remarks
BEAUTIFUL 3 BEDROOM, 1 BATH RANCH NESTLED ON 2.75 ACRES OF LAND.
Key facts
- 2.75 acre lot
- Built 1974
Property features AI
Finance
- Other: Approximately 2.75 acres
Exterior
- Utilities: Private well water; Septic sewer
- Home design: Residential property; One-story structure; Built in 1974
- Construction: Crawl foundation
- Exterior features: Vinyl siding; Road frontage
Interior
- Kitchen: Kitchen on the first floor, approximately 15 x 15
- Bedrooms: Primary bedroom on the first floor, approximately 19 x 11; Second bedroom on the first floor, approximately 8 x 9; Third bedroom on the first floor, approximately 10 (width listed as W=10)
- Bathrooms: One full bathroom on the first floor, roughly 10 x 10
- Heating & cooling: Forced air heating; Natural gas fuel
- Interior features: 6 total rooms
Neighborhood map
What this means for you Summary
Snapshot
- This is a 3-bed/1.0-bath single-family listed at $125k.
Deal economics
- At list price, monthly cash flow is $439 ($5k/yr) — positive.
- The deal already cash-flows at list — no discount required.
- Meets the 1% rule at list price ($2k rent vs $125k).
- Cap rate 10.5% vs local median 2.6% in Sanford — top-decile yield for the area; either an underpriced asset or a hidden risk that comps aren't pricing in. Stress-test before assuming the spread holds.
Location & tenants
- Location reads 70/100 on livability (#330 in MI) — a middle-class / working-renter tenant base. Strengths: cost of living A+, housing A+, employment B+; Watch: health & safety C-, schools D, amenities F.
- Bullock Creek School District (rural): math 37% / reading 55% proficiency, ranked #132 of 540 in MI (top 24%) — families likely to look elsewhere, expect single-tenant / working-renter base with shorter leases.
- Market conditions: 110 active listings in the ZIP; solid renter incomes; 320 units permitted in Midland County in 2024 (204 in 5+ unit buildings).
Forward outlook
- Local home prices are declining (-3.0%/yr); year-one equity from $864 of loan paydown is wiped out by about $4k of value loss. Plan a longer hold.
- Midland County population projected to shrink 9% by 2050 — rents likely to lag national; underwrite the cash flow, not the appreciation.
- At projected returns (-3.0% appreciation + 3.0% rent growth), your $35k cash investment doubles in ~8 years — after that, you're playing with house money.
Negotiation context
- Only 1 days on market — expect competitive offers; lowballing is unlikely to land.
- 9 sale attempts since 2y ago with the ask held roughly flat each time — persistent listings suggest the price (not the market) is what's stuck; bring a comps-based counter.
- Current owner paid $58k; list at $125k implies a 116% gain — meaningful room to come down on a strong offer.
Questions for the listing agent
- Built in 1974 — when were the roof, HVAC, electrical panel, plumbing, and water heater last replaced?
- Is there a deadline driving the sale (1031 exchange, divorce, estate, relocation)? That informs how much negotiation room exists.
- Schools are D-rated, which usually means shorter tenancies and higher turnover. Who's the typical renter profile here, and what's been the actual vacancy rate?
- What's the average days-on-market for RENTAL listings here right now (not sales)? A rising rental-DOM trend means longer vacancies and softer asking-rent achievability than the comps imply.
- What's the recent tenant-quality profile in this submarket — average credit score on applications, eviction rate, late-payment / NSF rate, and stable-employment percentage? A property-management company in the area should have these aggregated.
- How much new for-sale + rental construction is in the pipeline within 1–3 miles? Heavy new supply typically softens prices + rents 12–24 months out; constrained supply supports both.
Investment metrics
- 1% rule
- 1.28% ✓
- Cap rate
- 10.50%
- Cash-on-cash
- 15.04%
- DSCR
- 1.67
- GRM
- 6.5
CMA / ARV
No comps found within radius.
Projected returns pro-forma
-3.0% appreciation · 3.0% rent growth · sell at horizon
- IRR
- 5.6%
- Equity multiple
- 1.22×
- Total profit
- $7,678
- Equity at exit
- $18,638
- IRR
- 15.1%
- Equity multiple
- 2.22×
- Total profit
- $42,664
- Equity at exit
- $10,808
Cash invested: $35,000 (down + closing). Projections, not guarantees.
Landlord ↔ Tenant lean methodology
- Overall (STATE)
- 62 Landlord-Friendly
- State Michigan
- 62 Landlord-Friendly · EVEN
- County
- — inherits STATE
- City
- — inherits STATE
ZIP-level market 48640
- Home prices YoY
- -21.7%
- Active inventory
- 110
- Price-to-rent
- 6.5×
Monthly cashflow live
- Estimated rent
- $1,606 medium interval (Pro) →
- Mortgage (P&I)
- −$656
- Tax from tax record
- −$122 /mo · $1,468/yr
- Insurance
- −$52
- HOA
- −$0
- Vacancy / Maint / Mgmt
- −$337
- Net cashflow
- $439
Break-even live
UW: 25.0% down · 7.5% · 30yr · 1.5% tax · 5.0% vac · 8.0% maint · 8.0% mgmt
Financing live
Cash to close
- Down payment
- $31,250
- Closing costs
- $3,750
- Reserves months
- —
- Total cash needed
- —
Loan-product check · same deal, 3 products live
Conventional
25% down · 7.5% · 30yr
- Down + closing
- —
- Monthly P&I
- —
- Monthly cashflow
- —
- DSCR
- —
- Eligible?
- —
Personal DTI + credit; lowest rate.
DSCR
20% down · 8.5% · 30yr
- Down + closing
- —
- Monthly P&I
- —
- Monthly cashflow
- —
- DSCR
- —
- Eligible?
- —
No personal income docs; deal must DSCR.
Hard money
10% down · 12.0% · 12mo
- Down + closing
- —
- Monthly P&I
- —
- Monthly cashflow
- —
- DSCR
- —
- Eligible?
- —
Short-term bridge; refi at stabilization.
Listing history 4 events
-
2026-06-03status $125,000 Pending 1 DOM
-
2026-06-02$125,000 Active 1 DOM
-
2026-06-01remarks 64-char remark
-
2026-06-01$125,000 Active 1 DOM
ⓘ Source: listings_history table (triggers on properties + properties_extension) + one-shot
backfill from property_details.listing_events for pre-trigger history.
Tax reassessment forecast MI · Partial reset (capped growth)
- Current annual tax
- $1,468 · $122/mo
- Projected year-2 tax
- $1,697 · $141/mo
- Expected delta
- +$228/yr (+$19/mo · 15.5%)
ⓘ Screening estimate from a state-policy table — verify with the county assessor before closing.
Nearby sold comps map
Loading sold comps map…
Walkable amenities ~0.75 mi
Loading nearby amenities…
Taxation est. · year 1
- Rental income
- $19,268
- − Mortgage interest
- −$7,002
- − Property taxes
- −$1,468
- − Insurance
- −$625
- − Repairs & maintenance
- −$1,541
- − Management
- −$1,541
- − Depreciation
- −$3,636
- Taxable income
- $3,454
- Est. tax owed @ 24.0%
- −$829
- After-tax cash flow
- $4,433/yr
For passive investors: Depreciation is non-cash, so a rental often shows a tax loss while cash-flowing — sheltering income. Rental losses are passive: they offset passive income freely, and up to $25,000/yr can offset ordinary (W-2) income if you actively participate and your MAGI is under $100k (phasing out to $0 by $150k); unused losses carry forward. On sale, claimed depreciation is recaptured at up to 25%, and gains may owe capital-gains tax (a 1031 exchange can defer both). Figures are a year-1 estimate at your 24.0% rate — not tax advice; consult a CPA.
Schools (NCES district)
- District
- Bullock Creek School District
- NCES district ID
- 2607320
- Math proficiency
- 37% ▼ -12.00%
- Reading proficiency
- 55% ▼ -5.00%
- Median HH income
- $52,984
- Composite
- 39.68/100
- National rank
- #3907
- State rank
- #132 of 540 in MI
Livability — Sanford
- Score
- 70/100
- State rank
- #330
- US rank
- #8145
Category grades
Schools grade is shown separately in the Schools card above.
Census & demographics
- County
- Midland County · 66,531 people
- Metro
- Midland, MI
- Population (ZIP)
- 32,492
- Household income
- $80,574
- Rent vs Own
- Severe rent burden
- 939.0
Population outlook (Midland County) Hauer SSP2
- Today (2025)
- 83,968 people
- By 2030
- 83,368 · -0.7%
- By 2040
- 80,713 · -3.9%
- By 2050
- 76,698 · -8.7%
- By 2075
- 67,617 · -19.5%
- By 2100
- 57,529 · -31.5%
Race, ethnicity, and origin ACS 2023
- Neighborhood character
- Predominantly White (90%)
- Race & ethnicity
- White 90% Two or more races 5% Hispanic / Latino 4% Asian 1% Black 1%
- Common ancestry
- Romanian 7% Lithuanian 4% Italian 3%
- Foreign-born
- 3% · Canada, South Korea, China
- Languages at home
- 97% English-only · Spanish 1% Other Indo-European 1% German/W. Germanic 1%
Political lean MEDSL · Midland
- 2024 margin
- R (+15.2) · D 41.6% · R 56.8% · Other 1.6%
- 2008→2024 swing
- -11.6pp toward R · 2008: -3.6pp · 2024: -15.2pp
- All cycles
- 2024: R+15.2 2020: R+14.6 2016: R+19.4 2012: R+15.5 2008: R+3.6
Not yet ingested
- Civics
- —
Market trends
- HPI YoY
- ▼ -63.88%
- Current HPI
- 230.5702
- Rent YoY
- —
- Metro
- Midland, MI
- State GDP YoY
- ▲ 1.37%
- F500 in state
- 28
Industry mix (Fortune 500 HQ in MI)
| Industry | F500 HQs | Revenue |
|---|---|---|
| Automotive Parts | 3 | $48B |
|
||
| Automotive | 2 | $372B |
|
||
| Chemicals | 1 | $45B |
|
||
| Automotive Retail | 1 | $29B |
|
||
| Healthcare / Medical Devices | 1 | $23B |
|
||
| Automotive Technology | 1 | $20B |
|
||
Price history
+284.6% since first listed45 events — show timeline
- 2026-06-01 Listed $125,000 MiRealSource-MiMLS
- 2026-02-02 Sold (Public Records) $58,000 Public Records
- 2026-01-29 Sold (Public Records) $55,000 Public Records
- 2025-11-12 Pending — REALCOMP
- 2025-11-12 Pending — MiRealSource-MiMLS
- 2025-11-07 Listing Removed — MiRealSource-MiMLS
- 2025-11-07 Listing Removed — REALCOMP
- 2025-10-19 Price Changed $119,900 MiRealSource-MiMLS
- 2025-10-19 Price Changed $119,900 REALCOMP
- 2025-10-07 Price Changed $139,999 MiRealSource-MiMLS
- 2025-10-07 Price Changed $139,999 REALCOMP
- 2025-10-02 Price Changed $149,999 MiRealSource-MiMLS
- 2025-10-02 Price Changed $149,999 REALCOMP
- 2025-09-17 Price Changed $159,999 MiRealSource-MiMLS
- 2025-09-17 Price Changed $159,999 REALCOMP
- 2025-09-04 Price Changed $169,000 MiRealSource-MiMLS
- 2025-09-03 Price Changed $169,000 REALCOMP
- 2025-08-25 Price Changed $169,999 MiRealSource-MiMLS
- 2025-08-24 Price Changed $169,999 REALCOMP
- 2025-07-30 Price Changed $175,000 MiRealSource-MiMLS
- 2025-07-30 Relisted — REALCOMP
- 2025-07-30 Price Changed $175,000 REALCOMP
- 2025-07-30 Relisted — MiRealSource-MiMLS
- 2025-05-22 Pending — REALCOMP
- 2025-05-22 Pending — MiRealSource-MiMLS
- 2025-05-21 Listed $185,000 MiRealSource-MiMLS
- 2025-05-21 Listed $185,000 REALCOMP
- 2024-12-20 Sold (MLS) $58,000 REALCOMP
- 2024-12-20 Sold (MLS) $58,000 MiRealSource-MiMLS
- 2024-12-17 Pending — REALCOMP
- 2024-12-04 Pending — REALCOMP
- 2024-12-04 Pending — MiRealSource-MiMLS
- 2024-11-07 Price Changed $105,000 MiRealSource-MiMLS
- 2024-11-07 Price Changed $105,000 REALCOMP
- 2024-10-21 Price Changed $129,900 MiRealSource-MiMLS
- 2024-10-21 Price Changed $129,900 REALCOMP
- 2024-09-25 Relisted — REALCOMP
- 2024-09-25 Relisted — MiRealSource-MiMLS
- 2024-07-25 Pending — REALCOMP
- 2024-07-25 Pending — MiRealSource-MiMLS
- 2024-07-17 Listed $139,900 REALCOMP
- 2024-07-17 Listed $139,900 MiRealSource-MiMLS
- 2007-12-05 Sold (Public Records) $55,000 Public Records
- 2002-12-18 Sold (Public Records) $54,500 Public Records
- 1994-04-01 Sold (Public Records) $32,500 Public Records
Property tax history
+1.4%/yrLatest (2024): $1,468 · +4.9% YoY. Source: county tax records.
Cash-flow waterfall
monthlySold comps — $/sqft
last 12 mo · ≤1 miLoading sold comps…